Washington, Massachusetts (MA) income map, earnings map, and wages data
The median household income in Washington, MA in 2022 was $103,689, which was 8.9% greater than the median annual income of $94,488 across the entire state of Massachusetts. Compared to the median income of $54,583 in 2000 this represents an increase of 47.4%. The per capita income in 2022 was $52,957, which means an increase of 55.4% compared to 2000 when it was $23,610.
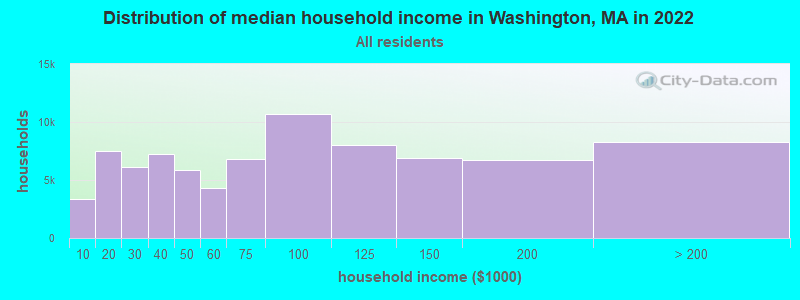
Income statistics for all residents
Median household income in Washington, MA in 2022:| Washington: | $103,689 |
| State: | $94,488 |
Change in median household income between 2000 and 2022:| Washington, Massachusetts: | +90.0% |
| State: | +87.1% |
Number of households with income < $10k:| Washington: | 4.1% (3,365) |
| Massachusetts: | 5.2% (146,170) |
Number of households with income $10k - 20k:| Washington: | 9.2% (7,494) |
| State: | 6.4% (180,001) |
Number of households with income $20k - 30k:| Washington: | 7.5% (6,086) |
| Massachusetts: | 5.6% (156,667) |
Number of households with income $30k - 40k:| Washington: | 8.9% (7,255) |
| Massachusetts: | 5.6% (157,168) |
Number of households with income $40k - 50k:| Washington: | 7.1% (5,821) |
| Massachusetts: | 5.4% (151,455) |
Number of households with income $50k - 60k:| Washington: | 5.2% (4,271) |
| State: | 5.1% (142,726) |
Number of households with income $60k - 75k:| Washington: | 8.3% (6,783) |
| State: | 7.6% (212,203) |
Number of households with income $75k - 100k:| Washington: | 13.1% (10,656) |
| Massachusetts: | 11.3% (317,064) |
Number of households with income $100k - 125k:| Washington: | 9.8% (8,020) |
| State: | 9.7% (270,603) |
Number of households with income $125k - 150k:| Washington: | 8.5% (6,908) |
| State: | 8.0% (223,140) |
Number of households with income $150k - 200k:| Washington: | 8.2% (6,700) |
| Massachusetts: | 11.0% (308,695) |
Number of households with income > $200k:| Washington: | 10.1% (8,236) |
| State: | 19.0% (531,884) |
Aggregate household income in Washington in 2022: $37,220,151
Median family income in Washington in 2022:| Washington: | $105,896 |
| Massachusetts: | $120,263 |
Median non-family income in Washington in 2022:| Washington: | $80,697 |
| Massachusetts: | $55,979 |
Change in median non-family income between 2000 and 2022:| Washington, Massachusetts: | +95.6% |
| Massachusetts: | +88.0% |
Median per capita income in Washington in 2022:| Washington: | $52,957 |
| State: | $54,025 |
Change in median per capita income between 2000 and 2022:| Washington, Massachusetts: | +124.3% |
| State: | +108.2% |
Income statistics for White residents
Median household income in Washington, MA in 2022:| Washington: | $105,199 |
| State: | $101,391 |
Change in median household income between 2000 and 2022:| Washington, Massachusetts: | +92.7% |
| State: | +93.3% |
Number of households with income < $10k:| Washington: | 4.3% (3,181) |
| State: | 4.4% (91,120) |
Number of households with income $10k - 20k:| Washington: | 8.5% (6,194) |
| Massachusetts: | 5.9% (122,055) |
Number of households with income $20k - 30k:| Washington: | 8.1% (5,919) |
| Massachusetts: | 5.1% (105,311) |
Number of households with income $30k - 40k:| Washington: | 8.2% (5,984) |
| State: | 5.3% (110,239) |
Number of households with income $40k - 50k:| Washington: | 7.0% (5,148) |
| State: | 5.0% (104,636) |
Number of households with income $50k - 60k:| Washington: | 4.5% (3,273) |
| Massachusetts: | 4.8% (99,486) |
Number of households with income $60k - 75k:| Washington: | 8.9% (6,502) |
| Massachusetts: | 7.5% (155,124) |
Number of households with income $75k - 100k:| Washington: | 13.0% (9,501) |
| State: | 11.4% (236,252) |
Number of households with income $100k - 125k:| Washington: | 9.6% (7,027) |
| State: | 9.9% (204,731) |
Number of households with income $125k - 150k:| Washington: | 8.6% (6,281) |
| State: | 8.5% (175,324) |
Number of households with income $150k - 200k:| Washington: | 8.8% (6,465) |
| Massachusetts: | 11.7% (242,980) |
Number of households with income > $200k:| Washington: | 10.6% (7,799) |
| State: | 20.5% (425,966) |
Aggregate household income in Washington in 2022: $34,539,339
Median family income in Washington in 2022:| Washington: | $107,935 |
| State: | $133,153 |
Number of families with income < $10k:| Washington: | 2.0% (3) |
| State: | 2.0% (25,038) |
Number of families with income $10k - 20k:| Washington: | 3.5% (6) |
| State: | 2.1% (26,403) |
Number of families with income $20k - 30k:| Washington: | 3.2% (6) |
| Massachusetts: | 2.6% (32,525) |
Number of families with income $30k - 40k:| Washington: | 7.9% (14) |
| State: | 3.9% (48,079) |
Number of families with income $40k - 50k:| Washington: | 1.8% (3) |
| State: | 3.8% (46,908) |
Number of families with income $50k - 60k:| Washington: | 3.9% (7) |
| Massachusetts: | 3.8% (46,476) |
Number of families with income $60k - 75k:| Washington: | 13.0% (23) |
| State: | 6.4% (79,040) |
Number of families with income $75k - 100k:| Washington: | 10.5% (19) |
| State: | 11.1% (137,395) |
Number of families with income $100k - 125k:| Washington: | 8.4% (15) |
| State: | 11.1% (136,771) |
Number of families with income $125k - 150k:| Washington: | 4.7% (8) |
| State: | 10.0% (123,709) |
Number of families with income $150k - 200k:| Washington: | 35.3% (62) |
| State: | 14.7% (181,602) |
Number of families with income > $200k:| Washington: | 5.8% (10) |
| State: | 28.5% (351,887) |
Median non-family income in Washington in 2022:| Washington: | $80,574 |
| State: | $59,323 |
Change in median non-family income between 2000 and 2022:| Washington, Massachusetts: | +95.3% |
| State: | +94.3% |
Median per capita income in Washington in 2022:| Washington: | $54,136 |
| State: | $60,804 |
Change in median per capita income between 2000 and 2022:| Washington, Massachusetts: | +128.4% |
| State: | +118.7% |