Wilmington, NC (North Carolina) Houses and Residents
Estimated median house or condo value in 2022: $370,700 (it was $121,600 in 2000 )
Wilmington:
$370,700North Carolina:
$280,600
Lower value quartile - upper value quartile: $250,000 - $549,100Mean price in 2022: Detached houses: $473,435 Here:
$473,435State:
$375,326
Townhouses or other attached units: $303,879 Here:
$303,879State:
$317,935
In 2-unit structures: $149,023 Here:
$149,023State:
$250,488
In 3-to-4-unit structures: $160,536 Here:
$160,536State:
$254,939
In 5-or-more-unit structures: $244,863 Here:
$244,863State:
$329,290
Mobile homes: $92,856 Here:
$92,856State:
$124,933
Total population: 113,657 (Urban population: 75,340, Rural population: 202 (all nonfarm) )
Houses: 62,489 (55,512 occupied: 24,616 owner occupied, 30,896 renter occupied )
% of renters here:
56%State:
33%
Housing density: 1,524 houses/condos per square mile
Median price asked for vacant for-sale houses and condos in 2022: $106,569.
Median contract rent in 2022: $1,154 (lower quartile is $871, upper quartile is $1,583)
Median rent asked for vacant for-rent units in 2022: $2,524
Median gross rent in Wilmington, NC in 2022: $1,298
Housing units in Wilmington with a mortgage: 15,732 (1,498 second mortgage, 0 home equity loan, 1,287 both second mortgage and home equity loan )Houses without a mortgage: 178
Median household income for houses/condos with a mortgage: $110,962
Median household income for apartments without a mortgage: $86,623
Median monthly housing costs: $1,319
Data:
Median house or condo value ($)
Median house or condo value ($ change since 2000)
Median house or condo value ($) - White
Median house or condo value ($) - Black or African American
Median house or condo value ($) - Asian
Median house or condo value ($) - Hispanic or Latino
Median house or condo value ($) - American Indian and Alaska Native
Median house or condo value ($) - Multirace
Median house or condo value ($) - Other Race
Median price asked for mobile homes ($)
Household density (households per square mile)
Mean house or condo value by units in structure - 1, detached ($)
Mean house or condo value by units in structure - 1, attached ($)
Mean house or condo value by units in structure - 2 ($)
Mean house or condo value by units in structure by units in structure - 3 or 4 ($)
Mean house or condo value by units in structure - 5 or more ($)
Mean house or condo value by units in structure - Boat, RV, van, etc. ($)
Mean house or condo value by units in structure - Mobile home ($)
Median contract rent ($)
Median contract rent - Lower quartile ($)
Median contract rent - Upper quartile ($)
Median gross rent ($)
Urban houses (%)
Rural houses (%)
Houses occupied (%)
Houses occupied (% change since 2000)
Houses owner occupied (%)
Houses owner occupied (% change since 2000)
Houses renter occupied (%)
Houses renter occupied (% change since 2000)
Vacant housing units - For rent (%)
Vacant housing units - For rent (% change since 2000)
Vacant housing units - For sale only (%)
Vacant housing units - For sale only (% change since 2000)
Vacant housing units - Rented or sold, not occupied (%)
Vacant housing units - Rented or sold, not occupied (% change since 2000)
Vacant housing units - For seasonal, recreational, or occasional use (%)
Vacant housing units - For seasonal, recreational, or occasional use (% change since 2000)
Vacant housing units - For migrant workers (%)
Vacant housing units - For migrant workers (% change since 2000)
Vacant housing units - Other vacant (%)
Vacant housing units - Other vacant (% change since 2000)
Median monthly housing costs ($)
Median household income for houses/condos with a mortgage ($)
Median household income for houses/condos without a mortgage ($)
Median household income ($)
Median household income ($) - White
Median household income ($) - Black or African American
Median household income ($) - Asian
Median household income ($) - Hispanic or Latino
Median household income ($) - American Indian and Alaska Native
Median household income ($) - Multirace
Median household income ($) - Other Race
Mortgage status - with mortgage (%)
Mortgage status - with second mortgage (%)
Mortgage status - with home equity loan (%)
Mortgage status - with both second mortgage and home equity loan (%)
Mortgage status - without a mortgage (%)
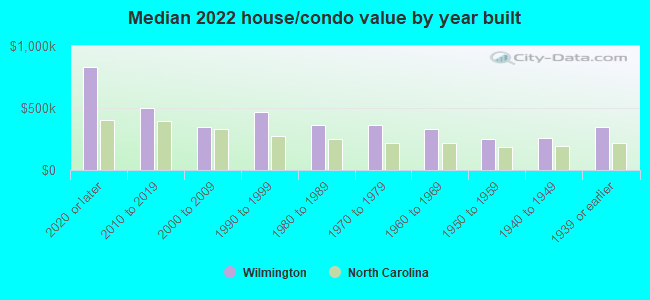
Median year house/condo built
Median year apartment built
Household type by relationship - Male householder living alone (%)
Household type by relationship - Male householder not living alone (%)
Household type by relationship - Female householder living alone (%)
Household type by relationship - Female householder not living alone (%)
Household type by relationship - Opposite-Sex spouse (%)
Household type by relationship - Same-Sex spouse (%)
Household type by relationship - Opposite-Sex unmarried partner (%)
Household type by relationship - Same-Sex unmarried partner (%)
Household type by relationship - In group quarters (%)
Size of family households - 2-person household (%)
Size of family households - 3-person household (%)
Size of family households - 4-person household (%)
Size of family households - 5-person household (%)
Size of family households - 6-person household (%)
Size of family households - 7-or-more-person household (%)
Size of nonfamily households - 1-person household (%)
Size of nonfamily households - 2-person household (%)
Size of nonfamily households - 3-person household (%)
Size of nonfamily households - 4-person household (%)
Size of nonfamily households - 5-person household (%)
Size of nonfamily households - 6-person household (%)
Size of nonfamily households - 7-or-moreperson household (%)
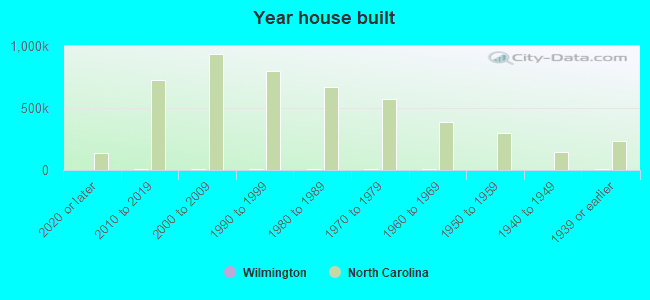
Year house built - Built 2010 or later (%)
Year house built - Built 2000 to 2009 (%)
Year house built - Built 1990 to 1999 (%)
Year house built - Built 1980 to 1989 (%)
Year house built - Built 1970 to 1979 (%)
Year house built - Built 1960 to 1969 (%)
Year house built - Built 1950 to 1959 (%)
Year house built - Built 1940 to 1949 (%)
Year house built - Built 1939 or earlier (%)
Median number of rooms in houses and condos
Median number of rooms in apartments
Median number of bedrooms in owner occupied houses
Mean number of bedrooms in owner occupied houses
Median number of bedrooms in renter occupied houses
Mean number of bedrooms in renter occupied houses
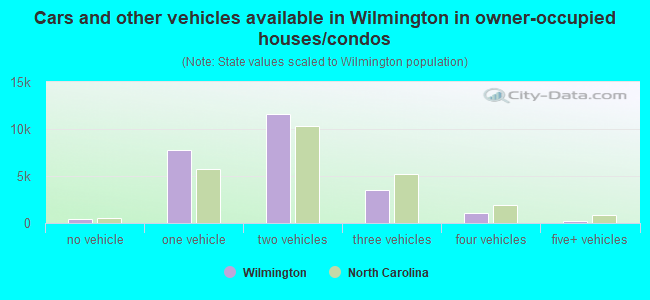
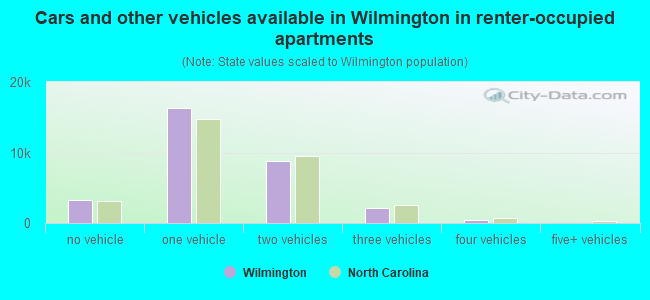
Median number of vehichles in owner occupied houses
Mean number of vehichles in owner occupied houses
Median number of vehichles in renter occupied houses
Mean number of vehichles in renter occupied houses
Rooms in owner-occupied houses - 1 room (%)
Rooms in owner-occupied houses - 2 rooms (%)
Rooms in owner-occupied houses - 3 rooms (%)
Rooms in owner-occupied houses - 4 rooms (%)
Rooms in owner-occupied houses - 5 rooms (%)
Rooms in owner-occupied houses - 6 rooms (%)
Rooms in owner-occupied houses - 7 rooms (%)
Rooms in owner-occupied houses - 8 rooms (%)
Rooms in owner-occupied houses - 9+ rooms (%)
Rooms in renter-occupied houses - 1 room (%)
Rooms in renter-occupied houses - 2 rooms (%)
Rooms in renter-occupied houses - 3 rooms (%)
Rooms in renter-occupied houses - 4 rooms (%)
Rooms in renter-occupied houses - 5 rooms (%)
Rooms in renter-occupied houses - 6 rooms (%)
Rooms in renter-occupied houses - 7 rooms (%)
Rooms in renter-occupied houses - 8 rooms (%)
Rooms in renter-occupied houses - 9+ rooms (%)
Bedrooms in owner-occupied houses - no bedrooms (%)
Bedrooms in owner-occupied houses - 1 bedroom (%)
Bedrooms in owner-occupied houses - 2 bedrooms (%)
Bedrooms in owner-occupied houses - 3 bedrooms (%)
Bedrooms in owner-occupied houses - 4 bedrooms (%)
Bedrooms in owner-occupied houses - 5+ bedrooms (%)
Bedrooms in renter-occupied houses - no bedrooms (%)
Bedrooms in renter-occupied houses - 1 bedroom (%)
Bedrooms in renter-occupied houses - 2 bedrooms (%)
Bedrooms in renter-occupied houses - 3 bedrooms (%)
Bedrooms in renter-occupied houses - 4 bedrooms (%)
Bedrooms in renter-occupied houses - 5+ bedrooms (%)
Vehicles available in owner-occupied houses - no vehicle available (%)
Vehicles available in owner-occupied houses - 1 vehicle available(%)
Vehicles available in owner-occupied houses - 2 Vehicles available (%)
Vehicles available in owner-occupied houses - 3 Vehicles available (%)
Vehicles available in owner-occupied houses - 4 Vehicles available (%)
Vehicles available in owner-occupied houses - 5+ Vehicles available (%)
Vehicles available in renter-occupied houses - no vehicle available (%)
Vehicles available in renter-occupied houses - 1 vehicle available (%)
Vehicles available in renter-occupied houses - 2 Vehicles available (%)
Vehicles available in renter-occupied houses - 3 Vehicles available (%)
Vehicles available in renter-occupied houses - 4 Vehicles available (%)
Vehicles available in renter-occupied houses - 5+ Vehicles available (%)
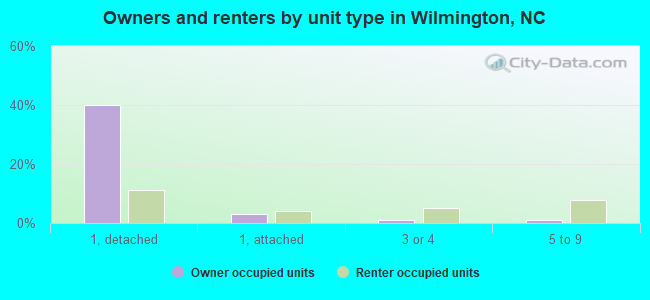
Housing units in structures - 1, detached (%)
Housing units in structures - 1, attached (%)
Housing units in structures - 2 (%)
Housing units in structures - 3 or 4 (%)
Housing units in structures - 5 to 9 (%)
Housing units in structures - 10 to 19 (%)
Housing units in structures - 20 to 49 (%)
Housing units in structures - 50 or more (%)
Housing units in structures - Mobile home (%)
Housing units in structures - Boat, RV, van, etc. (%)
Housing units in structures - Owners - 1, detached (%)
Housing units in structures - Owners - 1, attached (%)
Housing units in structures - Owners - 2 (%)
Housing units in structures - Owners - 3 or 4 (%)
Housing units in structures - Owners - 5 to 9 (%)
Housing units in structures - Owners - 10 to 19 (%)
Housing units in structures - Owners - 20 to 49 (%)
Housing units in structures - Owners - 50 or more (%)
Housing units in structures - Owners - Mobile home (%)
Housing units in structures - Owners - Boat, RV, van, etc. (%)
Housing units in structures - Renters - 1, detached (%)
Housing units in structures - Renters - 1, attached (%)
Housing units in structures - Renters - 2 (%)
Housing units in structures - Renters - 3 or 4 (%)
Housing units in structures - Renters - 5 to 9 (%)
Housing units in structures - Renters - 10 to 19 (%)
Housing units in structures - Renters - 20 to 49 (%)
Housing units in structures - Renters - 50 or more (%)
Housing units in structures - Renters - Mobile home (%)
Housing units in structures - Renters - Boat, RV, van, etc. (%)
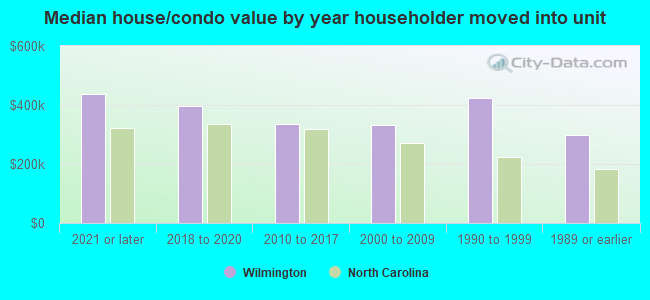
House/condo owner moved in on average (years ago)
Renter moved in on average (years ago)
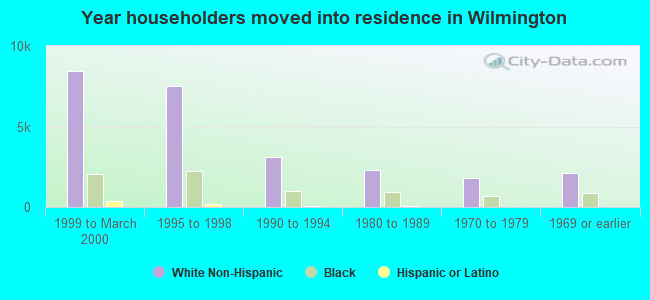
Year householder moved into unit - Moved in 1999 to March 2000 (%)
Year householder moved into unit - Moved in 1999 to March 2000 (%) - White
Year householder moved into unit - Moved in 1999 to March 2000 (%) - Black or African American
Year householder moved into unit - Moved in 1999 to March 2000 (%) - Asian
Year householder moved into unit - Moved in 1999 to March 2000 (%) - Hispanic or Latino
Year householder moved into unit - Moved in 1999 to March 2000 (%) - American Indian and Alaska Native
Year householder moved into unit - Moved in 1999 to March 2000 (%) - Multirace
Year householder moved into unit - Moved in 1999 to March 2000 (%) - Other Race
Year householder moved into unit - Moved in 1995 to 1998 (%)
Year householder moved into unit - Moved in 1995 to 1998 (%) - White
Year householder moved into unit - Moved in 1995 to 1998 (%) - Black or African American
Year householder moved into unit - Moved in 1995 to 1998 (%) - Asian
Year householder moved into unit - Moved in 1995 to 1998 (%) - Hispanic or Latino
Year householder moved into unit - Moved in 1995 to 1998 (%) - American Indian and Alaska Native
Year householder moved into unit - Moved in 1995 to 1998 (%) - Multirace
Year householder moved into unit - Moved in 1995 to 1998 (%) - Other Race
Year householder moved into unit - Moved in 1990 to 1994 (%)
Year householder moved into unit - Moved in 1990 to 1994 (%) - White
Year householder moved into unit - Moved in 1990 to 1994 (%) - Black or African American
Year householder moved into unit - Moved in 1990 to 1994 (%) - Asian
Year householder moved into unit - Moved in 1990 to 1994 (%) - Hispanic or Latino
Year householder moved into unit - Moved in 1990 to 1994 (%) - American Indian and Alaska Native
Year householder moved into unit - Moved in 1990 to 1994 (%) - Multirace
Year householder moved into unit - Moved in 1990 to 1994 (%) - Other Race
Year householder moved into unit - Moved in 1980 to 1989 (%)
Year householder moved into unit - Moved in 1980 to 1989 (%) - White
Year householder moved into unit - Moved in 1980 to 1989 (%) - Black or African American
Year householder moved into unit - Moved in 1980 to 1989 (%) - Asian
Year householder moved into unit - Moved in 1980 to 1989 (%) - Hispanic or Latino
Year householder moved into unit - Moved in 1980 to 1989 (%) - American Indian and Alaska Native
Year householder moved into unit - Moved in 1980 to 1989 (%) - Multirace
Year householder moved into unit - Moved in 1980 to 1989 (%) - Other Race
Year householder moved into unit - Moved in 1970 to 1979 (%)
Year householder moved into unit - Moved in 1970 to 1979 (%) - White
Year householder moved into unit - Moved in 1970 to 1979 (%) - Black or African American
Year householder moved into unit - Moved in 1970 to 1979 (%) - Asian
Year householder moved into unit - Moved in 1970 to 1979 (%) - Hispanic or Latino
Year householder moved into unit - Moved in 1970 to 1979 (%) - American Indian and Alaska Native
Year householder moved into unit - Moved in 1970 to 1979 (%) - Multirace
Year householder moved into unit - Moved in 1970 to 1979 (%) - Other Race
Year householder moved into unit - Moved in 1969 or earlier (%)
Year householder moved into unit - Moved in 1969 or earlier (%) - White
Year householder moved into unit - Moved in 1969 or earlier (%) - Black or African American
Year householder moved into unit - Moved in 1969 or earlier (%) - Asian
Year householder moved into unit - Moved in 1969 or earlier (%) - Hispanic or Latino
Year householder moved into unit - Moved in 1969 or earlier (%) - American Indian and Alaska Native
Year householder moved into unit - Moved in 1969 or earlier (%) - Multirace
Year householder moved into unit - Moved in 1969 or earlier (%) - Other Race
Housing units lacking complete plumbing facilities (%)
Housing units lacking complete kitchen facilities (%)
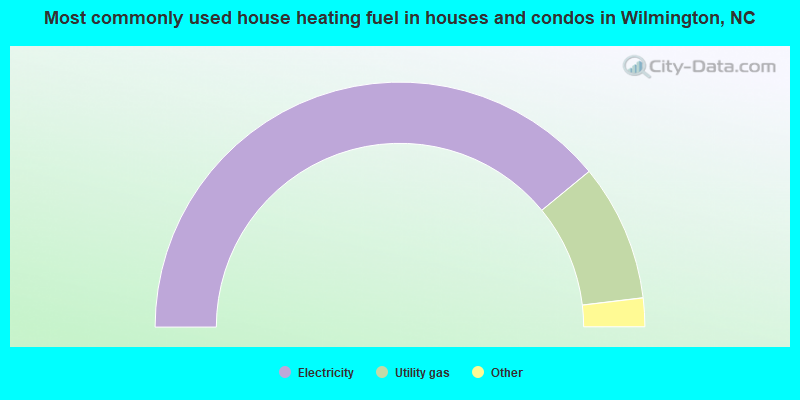
House heating fuel used in houses and condos - Utility gas (%)
House heating fuel used in houses and condos - Bottled, tank, or LP gas (%)
House heating fuel used in houses and condos - Electricity (%)
House heating fuel used in houses and condos - Fuel oil, kerosene, etc. (%)
House heating fuel used in houses and condos - Coal or coke (%)
House heating fuel used in houses and condos - Wood (%)
House heating fuel used in houses and condos - Solar energy (%)
House heating fuel used in houses and condos - Other fuel (%)
House heating fuel used in houses and condos - No fuel used (%)
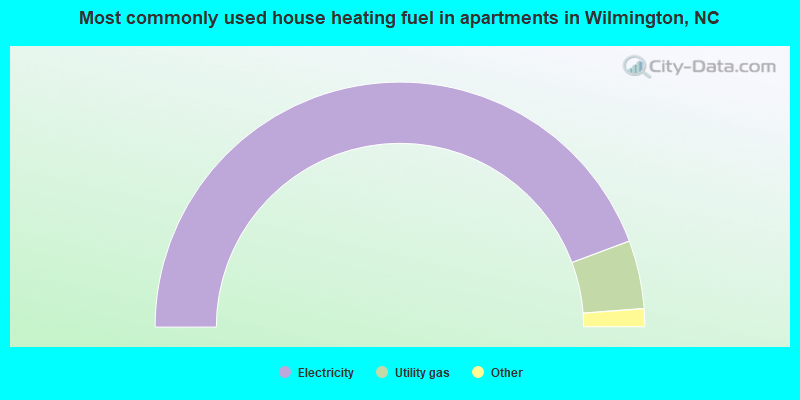
House heating fuel used in apartments - Utility gas (%)
House heating fuel used in apartments - Bottled, tank, or LP gas (%)
House heating fuel used in apartments - Electricity (%)
House heating fuel used in apartments - Fuel oil, kerosene, etc. (%)
House heating fuel used in apartments - Coal or coke (%)
House heating fuel used in apartments - Wood (%)
House heating fuel used in apartments - Solar energy (%)
House heating fuel used in apartments - Other fuel (%)
House heating fuel used in apartments - No fuel used (%)
Latest news about housing in Wilmington, NC collected exclusively by city-data.com from local newspapers, TV, and radio stations
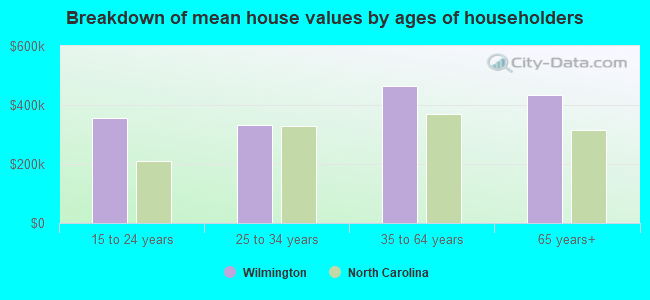
Median year house/condo built: 1985Median year apartment built: 1999Household type by relationship:
Households: 120,320
Male householders: 26,503 (8,027 living alone ), Female householders: 29,009 (11,140 living alone )19,858 spouses (19,492 opposite-sex spouses ), 5,257 unmarried partners , (4,819 opposite-sex unmarried partners ), 23,361 children (22,736 natural , 26 adopted , 599 stepchildren ), 1,477 grandchildren , 907 brothers or sisters , 563 parents , 0 foster children , 3,115 other relatives , 6,230 non-relatives In group quarters: 4,040
Size of family households: 16,298 2-persons , 7,215 3-persons , 3,240 4-persons , 1,243 5-persons , 471 6-persons , 115 7-or-more-persons .
Size of nonfamily households: 19,167 1-person , 6,329 2-persons , 1,300 3-persons , 134 4-persons .
10,811 married couples with children. single-parent households (681 men , 7,009 women ).
91.8% of residents of Wilmington speak English at home. of residents speak Spanish at home (59% speak English very well , 21% speak English well , 10% speak English not well , 10% don't speak English at all ).of residents speak other Indo-European language at home (61% speak English very well , 21% speak English well , 18% speak English not well ).of residents speak Asian or Pacific Island language at home (60% speak English very well , 25% speak English well , 5% speak English not well , 10% don't speak English at all ).of residents speak other language at home (67% speak English very well , 17% speak English well , 5% speak English not well , 11% don't speak English at all ).
Foreign born population: 7,809 (6.5%)of them are naturalized citizens )
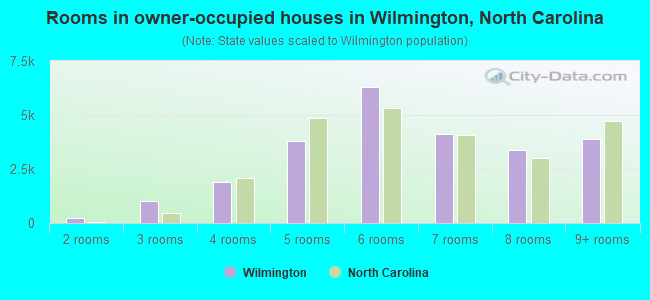
Median number of rooms in houses and condos:
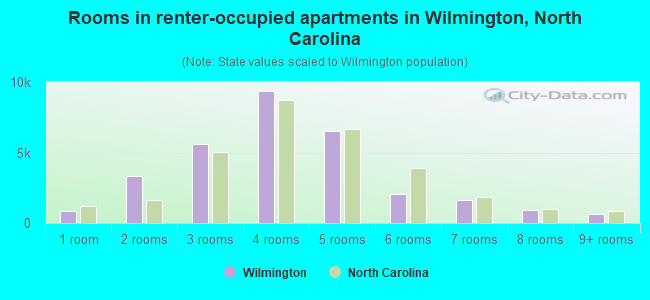
Median number of rooms in apartments
Owner-occupied Renter-occupied
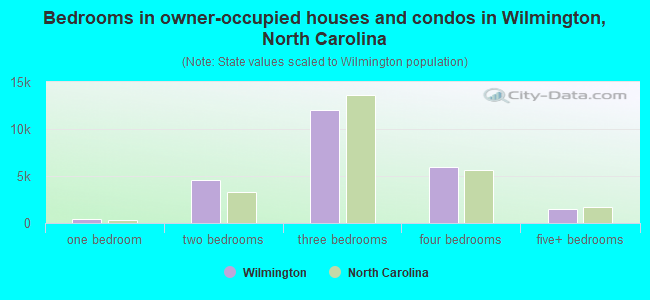
Bedrooms in owner-occupied houses and condos in Wilmington, North Carolina
120 no bedroom 446 1 bedroom 4,536 2 bedrooms 12,030 3 bedrooms 5,963 4 bedrooms 1,521 5+ bedrooms
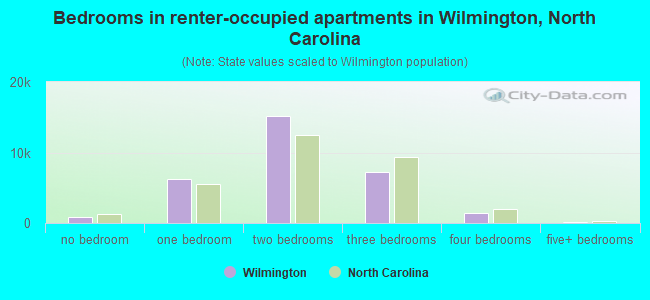
Bedrooms in renter-occupied apartments in Wilmington, North Carolina
870 no bedroom 6,179 1 bedroom 15,193 2 bedrooms 7,174 3 bedrooms 1,367 4 bedrooms 113 5+ bedrooms
Owner-occupied Renter-occupied
Rooms in owner-occupied houses in Wilmington, North Carolina
0 1 room 239 2 rooms 1,003 3 rooms 1,907 4 rooms 3,776 5 rooms 6,283 6 rooms 4,131 7 rooms 3,370 8 rooms 3,907 9+ rooms
Rooms in renter-occupied apartments in Wilmington, North Carolina
870 1 room 3,310 2 rooms 5,629 3 rooms 9,385 4 rooms 6,506 5 rooms 2,080 6 rooms 1,618 7 rooms 895 8 rooms 603 9+ rooms
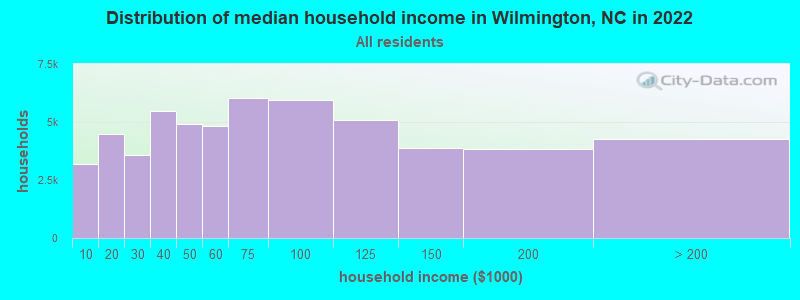
Wilmington, NC household income distribution 3,172 Less than $10,0004,489 $10,000 to $19,9993,572 $20,000 to $29,9995,491 $30,000 to $39,9994,911 $40,000 to $49,9994,809 $50,000 to $59,9996,033 $60,000 to $74,9995,944 $75,000 to $99,9995,092 $100,000 to $124,9993,891 $125,000 to $149,9993,824 $150,000 to $199,9994,284 $200,000 or more
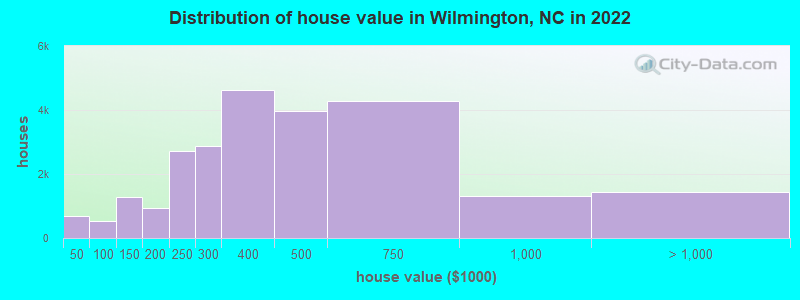
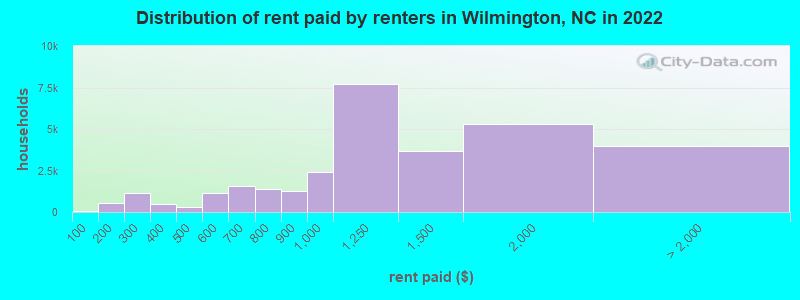
Home value of owner - occupied houses in 2022 in Wilmington, NC 163 $15,000 to $19,999125 $20,000 to $24,999122 $25,000 to $29,999276 $35,000 to $39,99967 $50,000 to $59,99969 $60,000 to $69,99928 $80,000 to $89,999371 $90,000 to $99,999830 $100,000 to $124,999465 $125,000 to $149,999425 $150,000 to $174,999504 $175,000 to $199,9992,709 $200,000 to $249,9992,876 $250,000 to $299,9994,634 $300,000 to $399,9993,959 $400,000 to $499,9994,268 $500,000 to $749,9991,298 $750,000 to $999,999677 $1,000,000 to $1,499,999513 $1,500,000 to $1,999,999237 $2,000,000 or moreRent paid by renters in 2022 in Wilmington, NC 80 Less than $100252 $100 to $149273 $150 to $199639 $200 to $249517 $250 to $299298 $300 to $349181 $350 to $39958 $400 to $449249 $450 to $4991,034 $500 to $549124 $550 to $599538 $600 to $6491,007 $650 to $699115 $700 to $7491,266 $750 to $7991,236 $800 to $8992,419 $900 to $9997,682 $1,000 to $1,2493,648 $1,250 to $1,4995,300 $1,500 to $1,9991,744 $2,000 to $2,499901 $2,500 to $2,999186 $3,000 to $3,499263 $3,500 or more886 No cash rent
Percentage of workers working in this county: 91.5%Number of people working at home: 11,648 (17.8% of all workers )
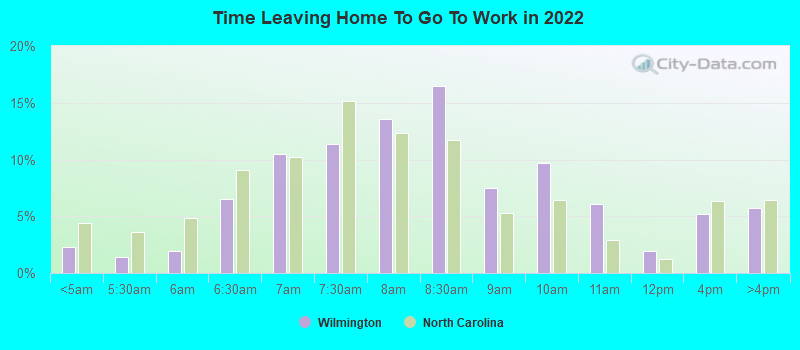
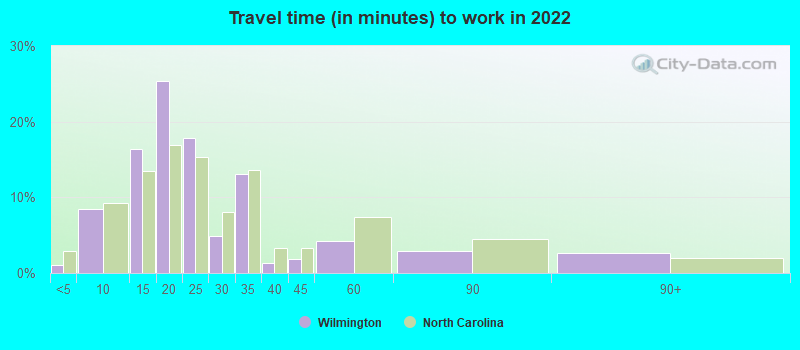
Travel time to work (commute)
Less than 5 minutes: 9365 to 9 minutes: 6,86410 to 14 minutes: 11,66315 to 19 minutes: 16,26520 to 24 minutes: 8,10725 to 29 minutes: 1,48930 to 34 minutes: 5,75435 to 39 minutes: 11540 to 44 minutes: 16145 to 59 minutes: 1,46860 to 89 minutes: 36190 or more minutes: 1,150
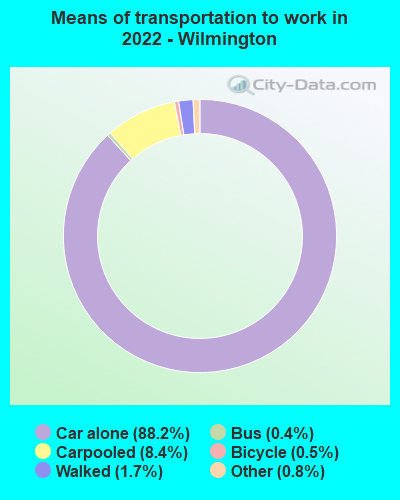
Means of transportation to work:
Drove a car alone: 80,527 (77.6%)Carpooled: 7,065 (6.8%)Bus : 191 (0.2%)Subway or elevated rail : 19 (0.0%)Long-distance train or commuter rail : 25 (0.0%)Taxi: 1,022 (1.0%)Bicycle: 924 (0.9%)Walked: 1,606 (1.5%)Worked at home: 11,648 (11.2%)
Unemployment by race in 2022
Unemployment rate for White non-Hispanic residents 3.3% Males3.1% FemalesUnemployment rate for Black residents 9.4% Males4.3% FemalesUnemployment rate for American Indian and Alaska Native residents 31.0% MalesUnemployment rate for Asian residents 29.5% Males3.9% FemalesUnemployment rate for other race residents 1.0% Males0.5% FemalesUnemployment rate for two or more race residents 11.4% Males0.3% FemalesUnemployment rate for Hispanic or Latino residents 3.3% Males3.9% Females
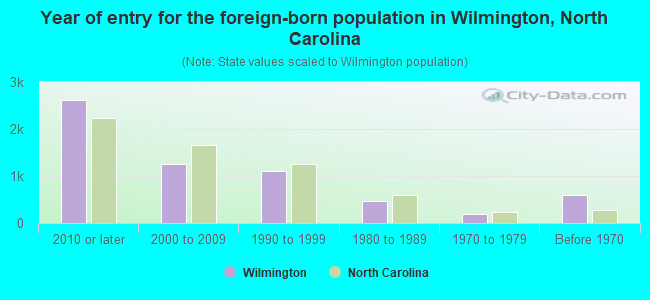
Year of entry for the foreign-born population in Wilmington, North Carolina
2,612 2010 or later 1,250 2000 to 2009 1,107 1990 to 1999 477 1980 to 1989 181 1970 to 1979 599 Before 1970
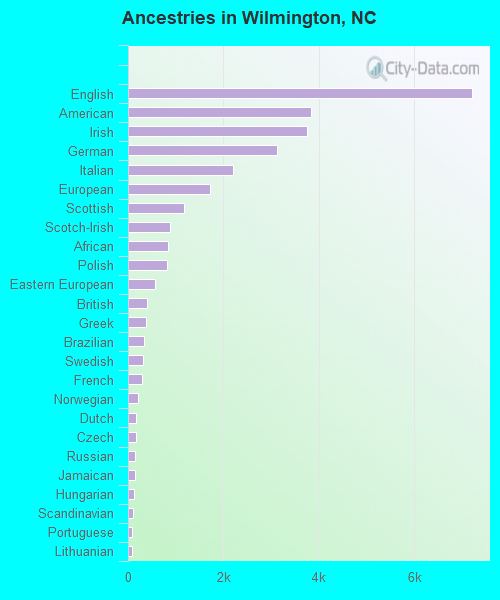
First ancestries reported:
English: 7,203 (14.6%)
American: 3,837 (7.8%)
Irish: 3,750 (7.6%)
German: 3,115 (6.3%)
Italian: 2,200 (4.5%)
European: 1,717 (3.5%)
Scottish: 1,163 (2.4%)
Scotch-Irish: 887 (1.8%)
African: 834 (1.7%)
Polish: 811 (1.6%)
Eastern European: 560 (1.1%)
British: 391 (0.8%)
Greek: 387 (0.8%)
Brazilian: 345 (0.7%)
Swedish: 321 (0.6%)
French: 292 (0.6%)
Norwegian: 210 (0.4%)
Dutch: 171 (0.3%)
Czech: 170 (0.3%)
Russian: 151 (0.3%)
Jamaican: 148 (0.3%)
Hungarian: 124 (0.3%)
Scandinavian: 100 (0.2%)
Portuguese: 81 (0.2%)
Lithuanian: 81 (0.2%)
French Canadian: 80 (0.2%)
Canadian: 75 (0.2%)
Welsh: 69 (0.1%)
Ukrainian: 60 (0.1%)
Turkish: 56 (0.1%)
Armenian: 54 (0.1%)
Albanian: 51 (0.1%)
Austrian: 51 (0.1%)
Danish: 48 (0.10%)
Swiss: 47 (0.10%)
Nigerian: 45 (0.09%)
Northern European: 43 (0.09%)
Moroccan: 39 (0.08%)
Latvian: 39 (0.08%)
Lebanese: 36 (0.07%)
Israeli: 35 (0.07%)
Finnish: 34 (0.07%)
Slovak: 33 (0.07%)
Croatian: 28 (0.06%)
South African: 24 (0.05%)
Arab: 17 (0.03%)
Jordanian: 17 (0.03%)
Romanian: 13 (0.03%)
Slavic: 11 (0.02%)
Celtic: 9 (0.02%)
British West Indian: 8 (0.02%)
Belgian: 5 (0.01%)
Palestinian: 5 (0.01%)
Iranian: 4 (0.01%)
Most common places of birth for foreign-born residents (%): Mexico Wilmington:
18.8% (1,168)North Carolina:
24.7% (214,776)
Honduras Wilmington:
11.1% (686)North Carolina:
4.7% (40,707)
China, excluding Hong Kong and Taiwan Wilmington:
5.0% (312)North Carolina:
3.2% (27,477)
Philippines Wilmington:
4.2% (261)North Carolina:
2.4% (20,695)
Canada Wilmington:
4.2% (258)North Carolina:
2.1% (18,105)
Korea Wilmington:
4.1% (256)North Carolina:
1.8% (15,988)
England Wilmington:
3.7% (232)North Carolina:
1.2% (10,140)
Cuba Wilmington:
3.5% (214)North Carolina:
1.0% (9,005)
Venezuela Wilmington:
3.2% (199)North Carolina:
1.2% (9,986)
Germany Wilmington:
3.0% (184)North Carolina:
1.8% (15,534)
Colombia Wilmington:
2.8% (172)North Carolina:
2.1% (18,275)
Afghanistan Wilmington:
2.5% (157)North Carolina:
0.2% (1,745)
Brazil Wilmington:
2.3% (144)North Carolina:
1.0% (8,426)
Chile Wilmington:
2.3% (140)North Carolina:
0.3% (2,274)
United Kingdom, excluding England and Scotland Wilmington:
2.1% (131)North Carolina:
1.1% (9,831)
Yemen Wilmington:
1.8% (113)North Carolina:
0.2% (1,937)
Jamaica Wilmington:
1.5% (95)North Carolina:
1.3% (11,419)
Place of birth for U.S.-born residents:
This state: 55,392Other state: 54,251Northeast: 19,970Midwest: 9,667South: 20,039West: 4,575 81.5% of Wilmington residents lived in the same house 1 years ago.
Out of people who lived in different houses, 28.6% lived in this county.
Out of people who lived in different counties, 60.5% lived in North Carolina.
Wilmington:
81.5%State average:
87.3%
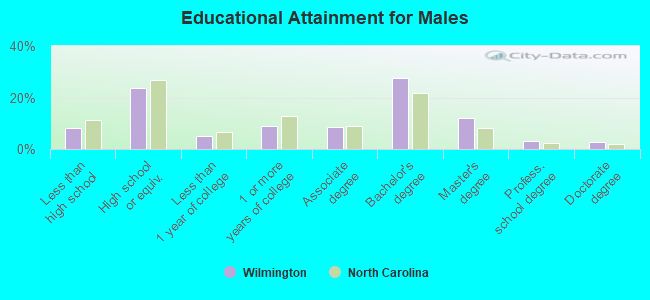
Education attainment for males 25 years and older:
No schooling: 627Nursery to 4th grade: 1765th and 6th grade: 3787th and 8th grade: 1799th grade: 69010th grade: 47511th grade: 40112th grade, no diploma: 291High school graduate (or equivalency): 9,181Less than 1 year of college: 2,025Some college more than 1 year, no degree: 3,445Associate degree: 3,351Bachelor's degree: 10,732Master's degree: 4,609Professional school degree: 1,159Doctorate degree: 1,021
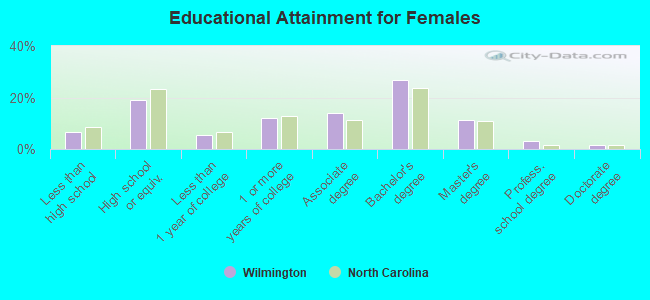
Education attainment for females 25 years and older:
No schooling: 922Nursery to 4th grade: 1025th and 6th grade: 497th and 8th grade: 889th grade: 32110th grade: 54311th grade: 12212th grade, no diploma: 715High school graduate (or equivalency): 8,184Less than 1 year of college: 2,391Some college more than 1 year, no degree: 5,196Associate degree: 5,927Bachelor's degree: 11,513Master's degree: 4,858Professional school degree: 1,249Doctorate degree: 595
Housing units in structures:
One, detached: 28,995One, attached: 3,760Two: 3,0753 or 4: 6,7735 to 9: 4,18510 to 19: 6,30220 to 49: 4,01550 or more: 4,660Mobile homes: 724Housing units lacking complete plumbing facilities in 2022: 1.7%Housing units lacking complete kitchen facilities in 2022: 1.9%House/condo owner moved in on average 8 years ago
Renter moved in on average 1 years ago
Private vs. public school enrollment:
Students in private schools in grades 1 to 8 (elementary and middle school): 1,221 Here:
13.9%North Carolina:
13.8%
Students in private schools in grades 9 to 12 (high school): 258 Here:
8.2%North Carolina:
11.9%
Students in private undergraduate colleges: 482 Here:
4.4%North Carolina:
19.3%