Races in Wilmington, North Carolina (NC) Detailed Stats
Data:
Races - White alone (%)
Races - White alone (% change since 2000)
Races - Black alone (%)
Races - Black alone (% change since 2000)
Races - American Indian alone (%)
Races - American Indian alone (% change since 2000)
Races - Asian alone (%)
Races - Asian alone (% change since 2000)
Races - Hispanic (%)
Races - Hispanic (% change since 2000)
Races - Native Hawaiian and Other Pacific Islander alone (%)
Races - Native Hawaiian and Other Pacific Islander alone (% change since 2000)
Races - Two or more races(%)
Races - Two or more races(% change since 2000)
Races - Other race alone (%)
Races - Other race alone (% change since 2000)
Racial diversity
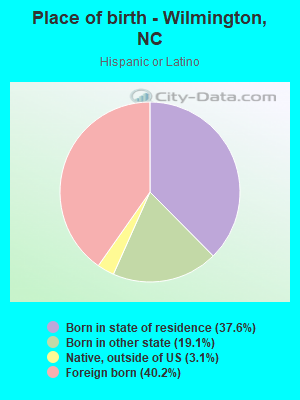
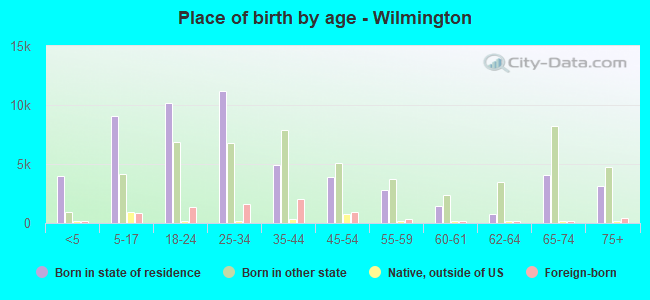
Place of birth - Born in state of residence (%)
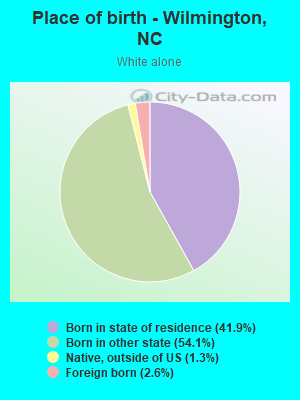
Place of birth - Born in state of residence (%) - White
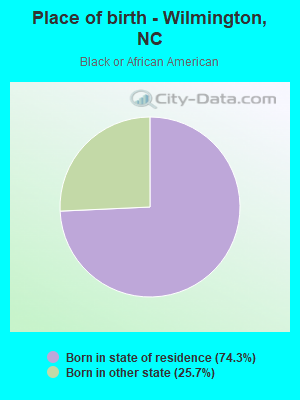
Place of birth - Born in state of residence (%) - Black or African American
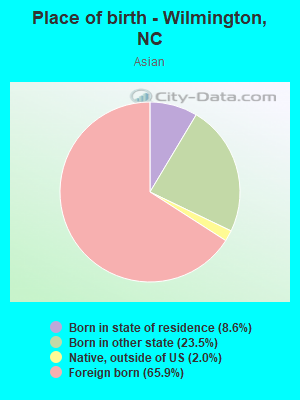
Place of birth - Born in state of residence (%) - Asian
Place of birth - Born in state of residence (%) - Hispanic or Latino
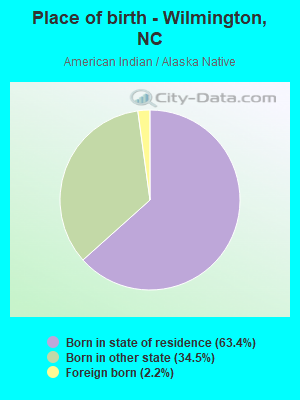
Place of birth - Born in state of residence (%) - American Indian and Alaska Native
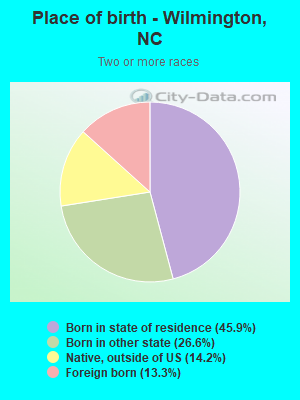
Place of birth - Born in state of residence (%) - Multirace
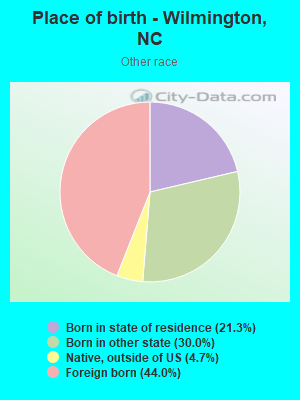
Place of birth - Born in state of residence (%) - Other Race
Place of birth - Born in other state (%)
Place of birth - Born in other state (%) - White
Place of birth - Born in other state (%) - Black or African American
Place of birth - Born in other state (%) - Asian
Place of birth - Born in other state (%) - Hispanic or Latino
Place of birth - Born in other state (%) - American Indian and Alaska Native
Place of birth - Born in other state (%) - Multirace
Place of birth - Born in other state (%) - Other Race
Place of birth - Native, outside of US (%)
Place of birth - Native, outside of US (%) - White
Place of birth - Native, outside of US (%) - Black or African American
Place of birth - Native, outside of US (%) - Asian
Place of birth - Native, outside of US (%) - Hispanic or Latino
Place of birth - Native, outside of US (%) - American Indian and Alaska Native
Place of birth - Native, outside of US (%) - Multirace
Place of birth - Native, outside of US (%) - Other Race
Place of birth - Foreign born (%)
Place of birth - Foreign born (%) - White
Place of birth - Foreign born (%) - Black or African American
Place of birth - Foreign born (%) - Asian
Place of birth - Foreign born (%) - Hispanic or Latino
Place of birth - Foreign born (%) - American Indian and Alaska Native
Place of birth - Foreign born (%) - Multirace
Place of birth - Foreign born (%) - Other Race
Residents speaking English at home (%)
Residents speaking English at home - Born in the United States (%)
Residents speaking English at home - Native, born elsewhere (%)
Residents speaking English at home - Foreign born (%)
Residents speaking Spanish at home (%)
Residents speaking Spanish at home - Born in the United States (%)
Residents speaking Spanish at home - Native, born elsewhere (%)
Residents speaking Spanish at home - Foreign born (%)
Residents speaking other language at home (%)
Residents speaking other language at home - Born in the United States (%)
Residents speaking other language at home - Native, born elsewhere (%)
Residents speaking other language at home - Foreign born (%)
Marital status - Never married (%)
Marital status - Now married (%)
Marital status - Separated (%)
Marital status - Widowed (%)
Marital status - Divorced (%)
Ancestries Reported - Arab (%)
Ancestries Reported - Czech (%)
Ancestries Reported - Danish (%)
Ancestries Reported - Dutch (%)
Ancestries Reported - English (%)
Ancestries Reported - French (%)
Ancestries Reported - French Canadian (%)
Ancestries Reported - German (%)
Ancestries Reported - Greek (%)
Ancestries Reported - Hungarian (%)
Ancestries Reported - Irish (%)
Ancestries Reported - Italian (%)
Ancestries Reported - Lithuanian (%)
Ancestries Reported - Norwegian (%)
Ancestries Reported - Polish (%)
Ancestries Reported - Portuguese (%)
Ancestries Reported - Russian (%)
Ancestries Reported - Scotch-Irish (%)
Ancestries Reported - Scottish (%)
Ancestries Reported - Slovak (%)
Ancestries Reported - Subsaharan African (%)
Ancestries Reported - Swedish (%)
Ancestries Reported - Swiss (%)
Ancestries Reported - Ukrainian (%)
Ancestries Reported - United States (%)
Ancestries Reported - Welsh (%)
Ancestries Reported - West Indian (%)
Ancestries Reported - Other (%)
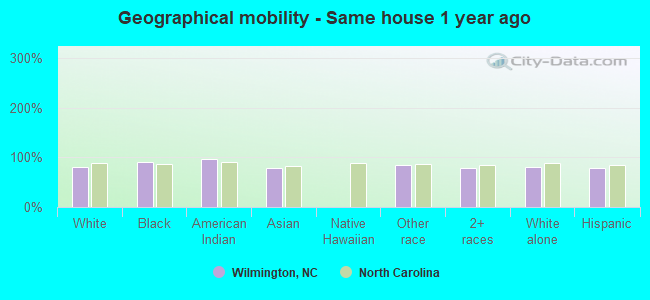
Geographical mobility - Same house 1 year ago (%)
Geographical mobility - Same house 1 year ago (%) - White
Geographical mobility - Same house 1 year ago (%) - Black or African American
Geographical mobility - Same house 1 year ago (%) - Asian
Geographical mobility - Same house 1 year ago (%) - Hispanic or Latino
Geographical mobility - Same house 1 year ago (%) - American Indian and Alaska Native
Geographical mobility - Same house 1 year ago (%) - Multirace
Geographical mobility - Same house 1 year ago (%) - Other Race
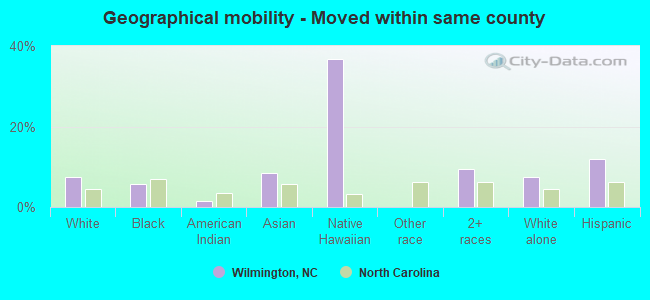
Geographical mobility - Moved within same county (%)
Geographical mobility - Moved within same county (%) - White
Geographical mobility - Moved within same county (%) - Black or African American
Geographical mobility - Moved within same county (%) - Asian
Geographical mobility - Moved within same county (%) - Hispanic or Latino
Geographical mobility - Moved within same county (%) - American Indian and Alaska Native
Geographical mobility - Moved within same county (%) - Multirace
Geographical mobility - Moved within same county (%) - Other Race
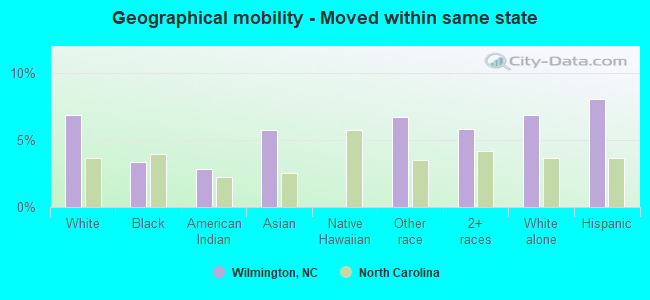
Geographical mobility - Moved from different county within same state (%)
Geographical mobility - Moved from different county within same state (%) - White
Geographical mobility - Moved from different county within same state (%) - Black or African American
Geographical mobility - Moved from different county within same state (%) - Asian
Geographical mobility - Moved from different county within same state (%) - Hispanic or Latino
Geographical mobility - Moved from different county within same state (%) - American Indian and Alaska Native
Geographical mobility - Moved from different county within same state (%) - Multirace
Geographical mobility - Moved from different county within same state (%) - Other Race
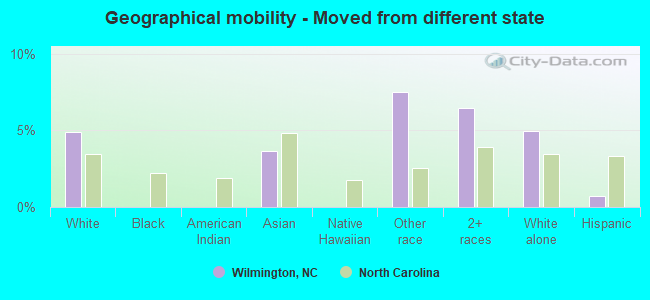
Geographical mobility - Moved from different state (%)
Geographical mobility - Moved from different state (%) - White
Geographical mobility - Moved from different state (%) - Black or African American
Geographical mobility - Moved from different state (%) - Asian
Geographical mobility - Moved from different state (%) - Hispanic or Latino
Geographical mobility - Moved from different state (%) - American Indian and Alaska Native
Geographical mobility - Moved from different state (%) - Multirace
Geographical mobility - Moved from different state (%) - Other Race
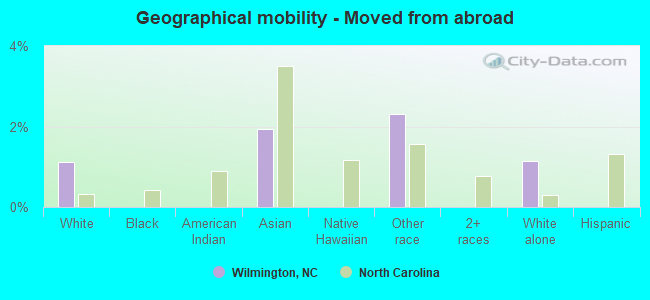
Geographical mobility - Moved from abroad (%)
Geographical mobility - Moved from abroad (%) - White
Geographical mobility - Moved from abroad (%) - Black or African American
Geographical mobility - Moved from abroad (%) - Asian
Geographical mobility - Moved from abroad (%) - Hispanic or Latino
Geographical mobility - Moved from abroad (%) - American Indian and Alaska Native
Geographical mobility - Moved from abroad (%) - Multirace
Geographical mobility - Moved from abroad (%) - Other Race
Place of birth for the foreign-born population - Ireland (%)
Place of birth for the foreign-born population - Denmark (%)
Place of birth for the foreign-born population - Norway (%)
Place of birth for the foreign-born population - Sweden (%)
Place of birth for the foreign-born population - United Kingdom (%)
Place of birth for the foreign-born population - England (%)
Place of birth for the foreign-born population - Scotland (%)
Place of birth for the foreign-born population - Other Northern Europe (%)
Place of birth for the foreign-born population - Austria (%)
Place of birth for the foreign-born population - Belgium (%)
Place of birth for the foreign-born population - France (%)
Place of birth for the foreign-born population - Germany (%)
Place of birth for the foreign-born population - Netherlands (%)
Place of birth for the foreign-born population - Switzerland (%)
Place of birth for the foreign-born population - Other Western Europe (%)
Place of birth for the foreign-born population - Greece (%)
Place of birth for the foreign-born population - Italy (%)
Place of birth for the foreign-born population - Portugal (%)
Place of birth for the foreign-born population - Spain (%)
Place of birth for the foreign-born population - Other Southern Europe (%)
Place of birth for the foreign-born population - Albania (%)
Place of birth for the foreign-born population - Belarus (%)
Place of birth for the foreign-born population - Bosnia and Herzegovina (%)
Place of birth for the foreign-born population - Bulgaria (%)
Place of birth for the foreign-born population - Croatia (%)
Place of birth for the foreign-born population - Czechoslovakia (%)
Place of birth for the foreign-born population - Hungary (%)
Place of birth for the foreign-born population - Latvia (%)
Place of birth for the foreign-born population - Lithuania (%)
Place of birth for the foreign-born population - North Macedonia (Macedonia) (%)
Place of birth for the foreign-born population - Moldova (%)
Place of birth for the foreign-born population - Poland (%)
Place of birth for the foreign-born population - Romania (%)
Place of birth for the foreign-born population - Russia (%)
Place of birth for the foreign-born population - Serbia (%)
Place of birth for the foreign-born population - Ukraine (%)
Place of birth for the foreign-born population - Other Eastern Europe (%)
Place of birth for the foreign-born population - China (%)
Place of birth for the foreign-born population - Hong Kong (%)
Place of birth for the foreign-born population - Taiwan (%)
Place of birth for the foreign-born population - Japan (%)
Place of birth for the foreign-born population - Korea (%)
Place of birth for the foreign-born population - Other Eastern Asia (%)
Place of birth for the foreign-born population - Afghanistan (%)
Place of birth for the foreign-born population - Bangladesh (%)
Place of birth for the foreign-born population - India (%)
Place of birth for the foreign-born population - Iran (%)
Place of birth for the foreign-born population - Kazakhstan (%)
Place of birth for the foreign-born population - Nepal (%)
Place of birth for the foreign-born population - Pakistan (%)
Place of birth for the foreign-born population - Sri Lanka (%)
Place of birth for the foreign-born population - Uzbekistan (%)
Place of birth for the foreign-born population - Other South Central Asia (%)
Place of birth for the foreign-born population - Burma (%)
Place of birth for the foreign-born population - Cambodia (%)
Place of birth for the foreign-born population - Indonesia (%)
Place of birth for the foreign-born population - Laos (%)
Place of birth for the foreign-born population - Malaysia (%)
Place of birth for the foreign-born population - Philippines (%)
Place of birth for the foreign-born population - Singapore (%)
Place of birth for the foreign-born population - Thailand (%)
Place of birth for the foreign-born population - Vietnam (%)
Place of birth for the foreign-born population - Other South Eastern Asia (%)
Place of birth for the foreign-born population - Armenia (%)
Place of birth for the foreign-born population - Iraq (%)
Place of birth for the foreign-born population - Israel (%)
Place of birth for the foreign-born population - Jordan (%)
Place of birth for the foreign-born population - Kuwait (%)
Place of birth for the foreign-born population - Lebanon (%)
Place of birth for the foreign-born population - Saudi Arabia (%)
Place of birth for the foreign-born population - Syria (%)
Place of birth for the foreign-born population - Turkey (%)
Place of birth for the foreign-born population - Yemen (%)
Place of birth for the foreign-born population - Other Western Asia (%)
Place of birth for the foreign-born population - Eritrea (%)
Place of birth for the foreign-born population - Ethiopia (%)
Place of birth for the foreign-born population - Kenya (%)
Place of birth for the foreign-born population - Somalia (%)
Place of birth for the foreign-born population - Uganda (%)
Place of birth for the foreign-born population - Zimbabwe (%)
Place of birth for the foreign-born population - Other Eastern Africa (%)
Place of birth for the foreign-born population - Cameroon (%)
Place of birth for the foreign-born population - Congo (%)
Place of birth for the foreign-born population - Democratic Republic of Congo (Zaire) (%)
Place of birth for the foreign-born population - Other Middle Africa (%)
Place of birth for the foreign-born population - Egypt (%)
Place of birth for the foreign-born population - Morocco (%)
Place of birth for the foreign-born population - Sudan (%)
Place of birth for the foreign-born population - Other Northern Africa (%)
Place of birth for the foreign-born population - South Africa (%)
Place of birth for the foreign-born population - Other Southern Africa (%)
Place of birth for the foreign-born population - Cabo Verde (%)
Place of birth for the foreign-born population - Ghana (%)
Place of birth for the foreign-born population - Liberia (%)
Place of birth for the foreign-born population - Nigeria (%)
Place of birth for the foreign-born population - Senegal (%)
Place of birth for the foreign-born population - Sierra Leone (%)
Place of birth for the foreign-born population - Other Western Africa (%)
Place of birth for the foreign-born population - Australia (%)
Place of birth for the foreign-born population - New Zealand (%)
Place of birth for the foreign-born population - Fiji (%)
Place of birth for the foreign-born population - Micronesia (%)
Place of birth for the foreign-born population - Bahamas (%)
Place of birth for the foreign-born population - Barbados (%)
Place of birth for the foreign-born population - Cuba (%)
Place of birth for the foreign-born population - Dominica (%)
Place of birth for the foreign-born population - Dominican Republic (%)
Place of birth for the foreign-born population - Grenada (%)
Place of birth for the foreign-born population - Haiti (%)
Place of birth for the foreign-born population - Jamaica (%)
Place of birth for the foreign-born population - St. Vincent and the Grenadines (%)
Place of birth for the foreign-born population - Trinidad and Tobago (%)
Place of birth for the foreign-born population - West Indies (%)
Place of birth for the foreign-born population - Other Caribbean (%)
Place of birth for the foreign-born population - Belize (%)
Place of birth for the foreign-born population - Costa Rica (%)
Place of birth for the foreign-born population - El Salvador (%)
Place of birth for the foreign-born population - Guatemala (%)
Place of birth for the foreign-born population - Honduras (%)
Place of birth for the foreign-born population - Mexico (%)
Place of birth for the foreign-born population - Nicaragua (%)
Place of birth for the foreign-born population - Panama (%)
Place of birth for the foreign-born population - Other Central America (%)
Place of birth for the foreign-born population - Argentina (%)
Place of birth for the foreign-born population - Bolivia (%)
Place of birth for the foreign-born population - Brazil (%)
Place of birth for the foreign-born population - Chile (%)
Place of birth for the foreign-born population - Colombia (%)
Place of birth for the foreign-born population - Ecuador (%)
Place of birth for the foreign-born population - Guyana (%)
Place of birth for the foreign-born population - Peru (%)
Place of birth for the foreign-born population - Uruguay (%)
Place of birth for the foreign-born population - Venezuela (%)
Place of birth for the foreign-born population - Other South America (%)
Place of birth for the foreign-born population - Canada (%)
Place of birth for the foreign-born population - Other Northern America (%)
Place of birth for the foreign-born population - Other (%)
Latest news about races in Wilmington, NC collected exclusively by city-data.com from local newspapers, TV, and radio stations
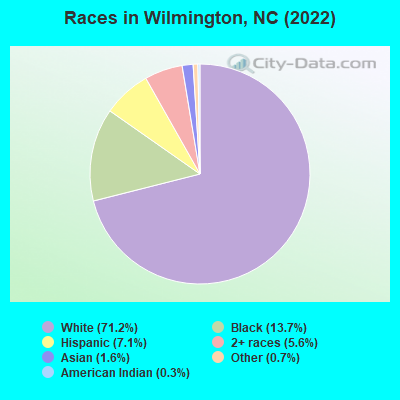
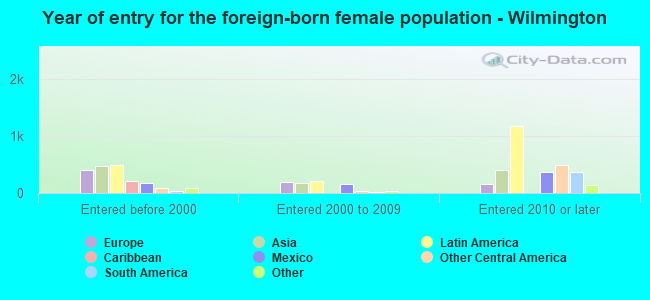
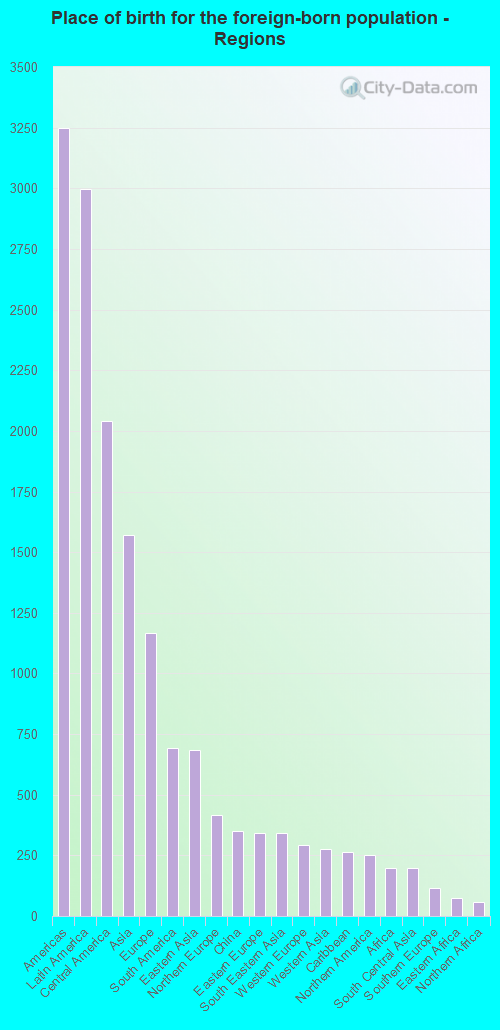
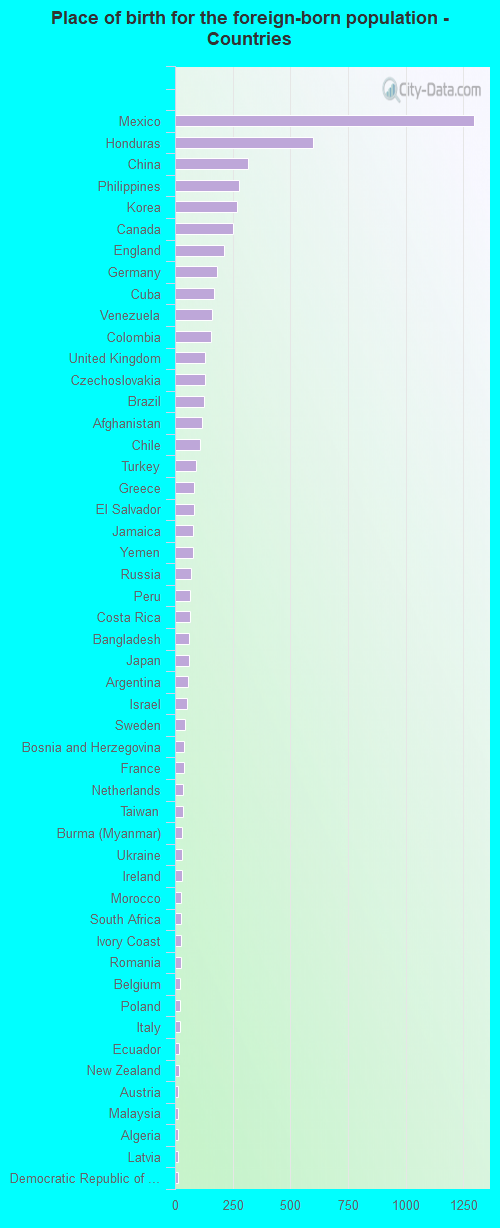
According to 2022 data, the most numerous races in Wilmington, NC are White alone (85,622 residents), Black alone (16,500 residents), and Hispanic (8,492 residents). 92.8% of Wilmington residents speak English at home. 5.1% of Wilmington, NC residents are foreign-born (2.4% born in Latin America, 1.3% born in Asia, 0.9% born in Europe), which is 55.4% less than the foreign-born rate of 8.0% across the entire state of North Carolina.
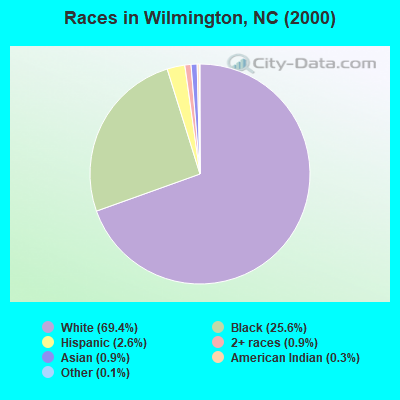
Race distribution in Wilmington
2000 2022
5,647,155 70.2% White alone 1,723,301 21.4% Black alone 378,963 4.7% Hispanic 112,416 1.4% Asian alone 95,333 1.2% American Indian alone 79,965 1.0% Two or more races 9,015 0.1% Other race alone 3,165 0.04% Native Hawaiian and Other
6,497,519 60.7% White alone 2,155,650 20.1% Black alone 1,114,799 10.4% Hispanic 438,061 4.1% Two or more races 341,052 3.2% Asian alone 91,758 0.9% American Indian alone 50,180 0.5% Other race alone 9,954 0.09% Native Hawaiian and Other
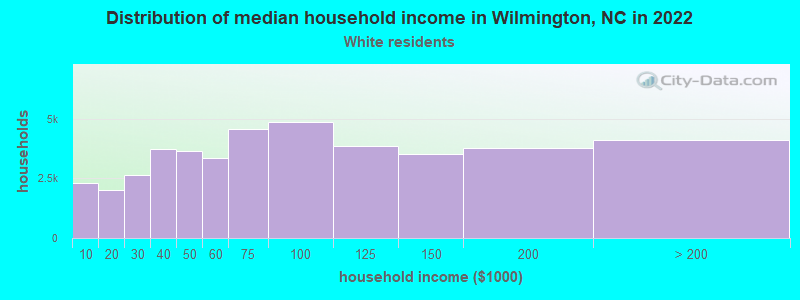
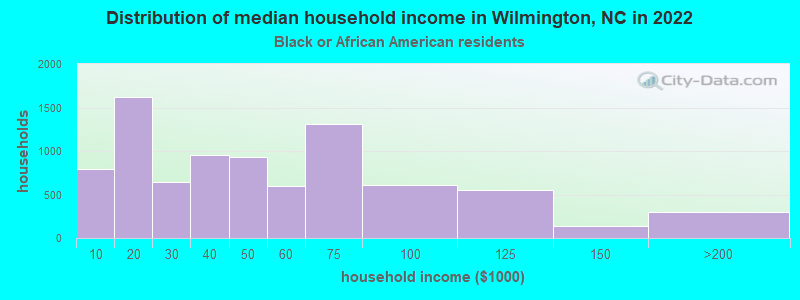
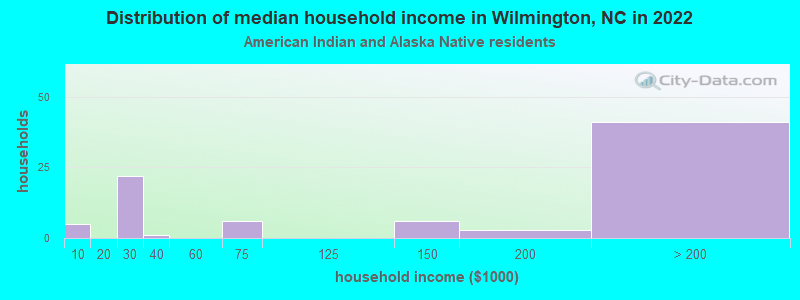
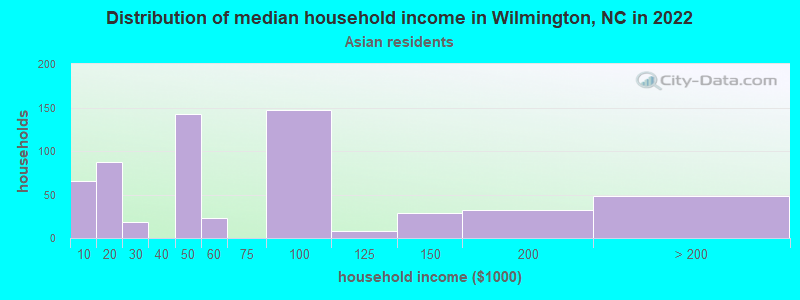
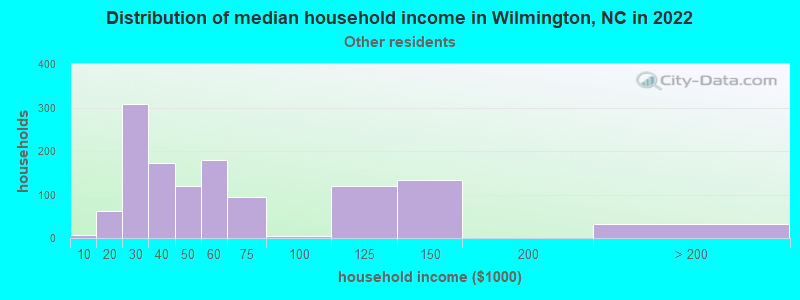
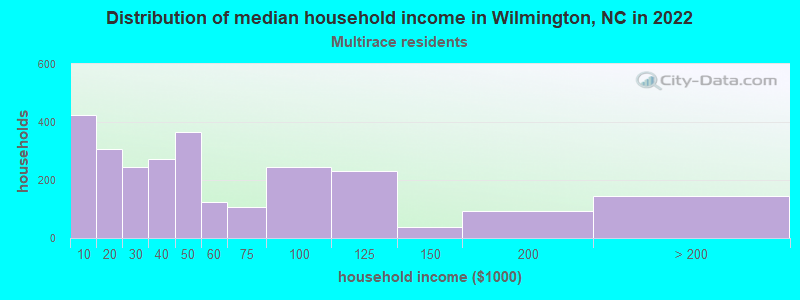
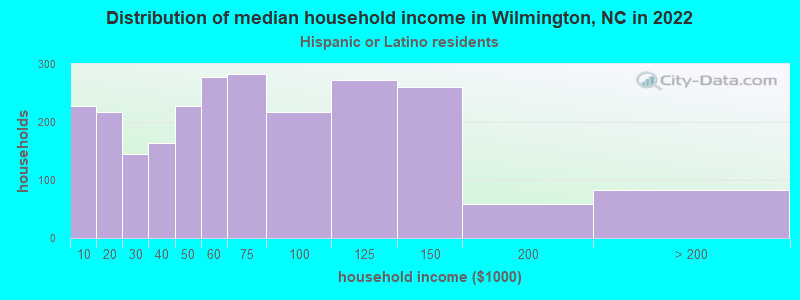
Income and house value in Wilmington Median household income in 2022 $71,951 White non-Hispanic householders$45,613 Black householders$34,786 Asian householders$42,317 Some other race householders$41,263 Two or more races householders$73,619 Hispanic or Latino race householdersMedian 2022 house value $429,231 White Non-Hispanic householders$228,029 Black or African American householders$451,790 American Indian or Alaska Native householders $495,384 Asian householdersover $1,000,000 Native Hawaiian and other Pacific Islander householders$289,609 Some other race householders$341,129 Two or more races householders$385,332 Hispanic or Latino householders
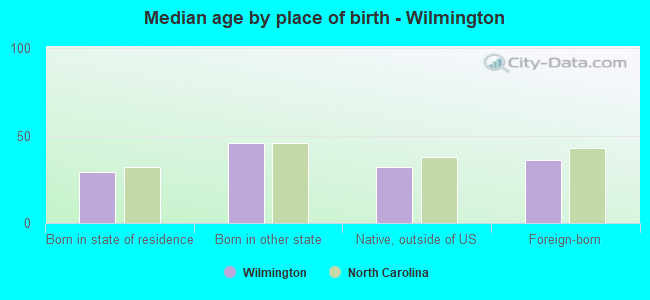
Median age by race in Wilmington
38.9 Median age for White residents37.5 40.4 33.2 Median age for Black or African American residents40.7 32.4 49.9 Median age for American Indian / Alaska Native residents24.7 49.2 41.2 Median age for Asian residents23.5 42.3 -666,666,666.0 Median age for Native Hawaiian / Pacific Islander residents-666,666,666.0 -666,666,666.0 29.1 Median age for Other race residents29.4 27.6 24.2 Median age for Two or more races residents20.8 33.0 39.4 Median age for White alone residents38.4 41.0 24.2 Median age for Hispanic or Latino residents22.4 24.6
Owner/renter occupied households by race in Wilmington
House owners and renters - White residents 21,365 50.6% Owner occupied20,876 49.4% Renter occupiedHouse owners and renters - Black or African American residents 1,741 22.5% Owner occupied5,985 77.5% Renter occupiedHouse owners and renters - American Indian / Alaska Native residents 47 66.3% Owner occupied24 33.7% Renter occupiedHouse owners and renters - Asian residents 107 14.5% Owner occupied635 85.5% Renter occupiedHouse owners and renters - Other race residents 476 42.4% Owner occupied647 57.6% Renter occupiedHouse owners and renters - Two or more races residents 770 21.1% Owner occupied2,884 78.9% Renter occupiedHouse owners and renters - White alone residents 21,298 51.0% Owner occupied20,491 49.0% Renter occupiedHouse owners and renters - Hispanic or Latino residents 625 27.1% Owner occupied1,684 72.9% Renter occupied
Language usage in Wilmington
English speakers - Total 92.8% of residents of Wilmington speak English at home.
4.6% of residents speak Spanish at home 2,568 48.1% Speak English very well2,769 51.9% Speak English less than very well2.6% of residents speak other language at home 1,329 45.2% Speak English very well1,611 54.8% Speak English less than very well
English speakers - Born in the United States 98.3% of residents of Wilmington speak English at home.
0.9% of residents speak Spanish at home 483 100.0% Speak English very well0.8% of residents speak other language at home 333 78.5% Speak English very well91 21.5% Speak English less than very well
English speakers - Native, born elsewhere 76.8% of residents of Wilmington speak English at home.
1.8% of residents speak Spanish at home 49 100.0% Speak English less than very well21.3% of residents speak other language at home 174 30.6% Speak English very well395 69.4% Speak English less than very well
English speakers - Foreign-born 37.9% of residents of Wilmington speak English at home.
39.8% of residents speak Spanish at home 1,105 35.9% Speak English very well1,970 64.1% Speak English less than very well22.4% of residents speak other language at home 801 46.3% Speak English very well928 53.7% Speak English less than very well
White (Caucasian) - Speak only English Native:
98.1% (80,123)Foreign-born:
58.6% (1,732)
White (Caucasian) - Speak another language Native:
1.9% (1,581)Foreign-born:
41.4% (1,224)
Black or African American - Speak only English Native:
99.3% (17,597)Foreign-born:
29.7% (69)
Black or African American - Speak another language Native:
0.7% (131)Foreign-born:
70.1% (162)
American Indian / Alaska Native - Speak another language Native:
27.5% (81)Foreign-born:
100.0% (8)
Asian - Speak only English Native:
53.4% (232)Foreign-born:
43.1% (443)
Asian - Speak another language Native:
39.8% (173)Foreign-born:
59.7% (614)
Other race - Speak only English Native:
87.2% (1,104)Foreign-born:
6.6% (128)
Other race - Speak another language Native:
81.9% (1,036)Foreign-born:
85.6% (1,652)
Two or more races - Speak only English Native:
85.9% (5,764)Foreign-born:
8.4% (118)
Two or more races - Speak another language Native:
13.9% (934)Foreign-born:
82.6% (1,163)
White alone - Speak only English Native:
98.4% (79,400)Foreign-born:
73.6% (1,593)
White alone - Speak another language Native:
1.6% (1,314)Foreign-born:
26.4% (572)
Hispanic or Latino - Speak only English Native:
71.9% (2,936)Foreign-born:
17.0% (580)
Hispanic or Latino - Speak another language Native:
28.1% (1,148)Foreign-born:
83.0% (2,838)
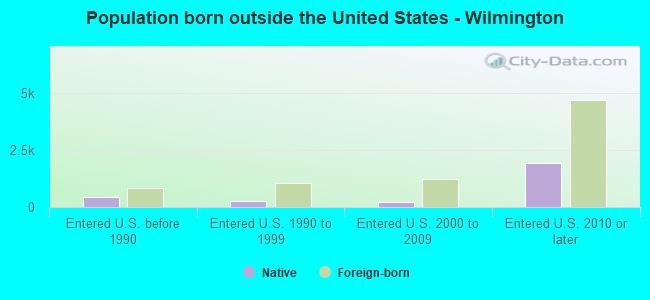
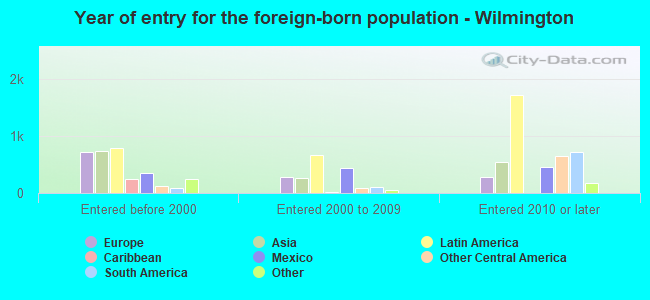
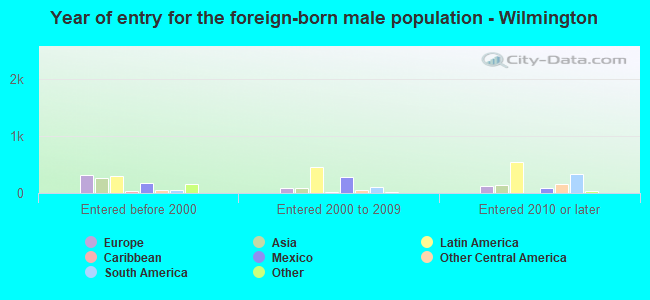
Foreign-born residents in Wilmington 6,200 residents are foreign born (2.4% Latin America , 1.3% Asia , 0.9% Europe ).
This city:
5.1%North Carolina:
8.3%
Marital status for residents in Wilmington Marital status - White (Caucasian) population 15 years and over
Males 41.4% Never married47.4% Now married2.6% Separated2.2% Widowed6.5% DivorcedFemales 34.4% Never married43.3% Now married1.6% Separated7.2% Widowed13.7% DivorcedWomen who gave birth in the past 12 months Now married:
100.0% (576)Unmarried:
0.0% (0)
Women who did not give birth in the past 12 months Now married:
33.0% (7,404)Unmarried:
67.0% (15,022)
Marital status - Black or African American population 15 years and over
Males 52.1% Never married25.7% Now married4.8% Separated13.2% Widowed4.2% DivorcedFemales 61.3% Never married11.1% Now married0.6% Separated12.2% Widowed14.9% DivorcedWomen who gave birth in the past 12 months Now married:
10.3% (16)Unmarried:
89.7% (139)
Women who did not give birth in the past 12 months Now married:
15.1% (771)Unmarried:
84.9% (4,349)
Marital status - American Indian / Alaska Native population 15 years and over
Males 52.1% Never married4.2% Now married6.7% Separated0.0% Widowed37.0% DivorcedFemales 17.6% Never married54.9% Now married0.0% Separated4.9% Widowed22.5% DivorcedWomen who did not give birth in the past 12 months Now married:
56.8% (57)Unmarried:
43.2% (43)
Marital status - Asian population 15 years and over
Males 52.2% Never married39.4% Now married0.0% Separated0.0% Widowed8.4% DivorcedFemales 44.5% Never married44.4% Now married0.0% Separated5.8% Widowed5.3% DivorcedWomen who gave birth in the past 12 months Now married:
100.0% (10)Unmarried:
0.0% (0)
Women who did not give birth in the past 12 months Now married:
38.0% (248)Unmarried:
62.0% (406)
Marital status - Other race population 15 years and over
Males 67.9% Never married28.7% Now married0.0% Separated0.0% Widowed3.4% DivorcedFemales 47.2% Never married40.5% Now married9.3% Separated0.1% Widowed2.9% DivorcedWomen who gave birth in the past 12 months Now married:
75.0% (37)Unmarried:
25.0% (12)
Women who did not give birth in the past 12 months Now married:
40.4% (402)Unmarried:
59.6% (594)
Marital status - Two or more races population 15 years and over
Males 46.8% Never married49.3% Now married3.8% Separated0.0% Widowed0.0% DivorcedFemales 36.6% Never married37.6% Now married2.3% Separated1.9% Widowed21.5% DivorcedWomen who gave birth in the past 12 months Now married:
68.6% (33)Unmarried:
31.4% (15)
Women who did not give birth in the past 12 months Now married:
33.5% (736)Unmarried:
66.5% (1,459)
Marital status - White alone, not Hispanic / Latino population 15 years and over
Males 40.9% Never married47.9% Now married2.6% Separated2.2% Widowed6.4% DivorcedFemales 33.5% Never married43.8% Now married1.6% Separated7.2% Widowed13.8% DivorcedWomen who gave birth in the past 12 months Now married:
100.0% (576)Unmarried:
0.0% (0)
Women who did not give birth in the past 12 months Now married:
33.6% (7,404)Unmarried:
66.4% (14,663)
Marital status - Hispanic or Latino population 15 years and over
Males 60.2% Never married34.1% Now married0.0% Separated0.5% Widowed5.2% DivorcedFemales 48.5% Never married38.0% Now married7.3% Separated2.5% Widowed3.7% DivorcedWomen who gave birth in the past 12 months Now married:
42.6% (77)Unmarried:
57.4% (103)
Women who did not give birth in the past 12 months Now married:
40.0% (903)Unmarried:
60.0% (1,354)
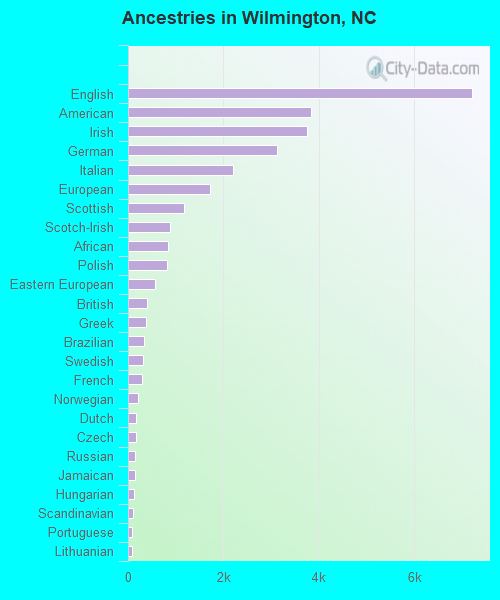
Ancestries in Wilmington
7,203 14.6% English3,837 7.8% American3,750 7.6% Irish3,115 6.3% German2,200 4.5% Italian1,717 3.5% European1,163 2.4% Scottish887 1.8% Scotch-Irish834 1.7% African811 1.6% Polish560 1.1% Eastern European391 0.8% British387 0.8% Greek345 0.7% Brazilian321 0.6% Swedish292 0.6% French210 0.4% Norwegian171 0.3% Dutch170 0.3% Czech151 0.3% Russian148 0.3% Jamaican124 0.3% Hungarian100 0.2% Scandinavian81 0.2% Portuguese81 0.2% Lithuanian80 0.2% French Canadian75 0.2% Canadian69 0.1% Welsh60 0.1% Ukrainian56 0.1% Turkish54 0.1% Armenian51 0.1% Albanian51 0.1% Austrian48 0.10% Danish47 0.10% Swiss45 0.09% Nigerian43 0.09% Northern European39 0.08% Moroccan39 0.08% Latvian36 0.07% Lebanese35 0.07% Israeli34 0.07% Finnish33 0.07% Slovak28 0.06% Croatian24 0.05% South African17 0.03% Arab17 0.03% Jordanian13 0.03% Romanian11 0.02% Slavic9 0.02% Celtic8 0.02% British West Indian5 0.01% Belgian5 0.01% Palestinian4 0.01% Iranian
Geographical mobility in Wilmington Same house 1 year ago 69,004 79.7% White (Caucasian)15,164 90.8% Black or African American339 96.4% American Indian / Alaska Native1,274 79.1% Asian3,826 84.8% Other race8,465 78.3% Two or more races67,415 79.5% White alone, not Hispanic / Latino6,588 79.4% Hispanic or LatinoMoved within same county 6,393 7.4% White / Caucasian966 5.8% Black or African American6 1.6% American Indian / Alaska Native135 8.4% Asian14 36.9% Native Hawaiian / Pacific Islander2 0.0% Other race1,017 9.4% Two or more races6,393 7.5% White alone, not Hispanic / Latino981 11.8% Hispanic or LatinoMoved within same state 5,966 6.9% White / Caucasian562 3.4% Black or African American10 2.9% American Indian / Alaska Native93 5.7% Asian302 6.7% Other race630 5.8% Two or more races5,835 6.9% White alone, not Hispanic / Latino667 8.0% Hispanic or LatinoMoved from different state 4,237 4.9% White / Caucasian58 3.6% Asian339 7.5% Other race701 6.5% Two or more races4,176 4.9% White alone, not Hispanic / Latino61 0.7% Hispanic or LatinoMoved from abroad 978 1.1% White31 1.9% Asian104 2.3% Other race978 1.2% White alone, not Hispanic / Latino
Children Nativity (place of birth) in Wilmington
Children under 6 years - Living with two parents Both parents native 3,478 100.0% NativeBoth parents foreign-born 165 67.9% Native78 32.1% Foreign-bornOne native, one foreign-born parent 616 100.0% NativeChildren under 6 years - Living with one parent Native parent 1,382 100.0% NativeForeign-born parent 665 92.9% Native51 7.1% Foreign-bornChildren 6 to 17 years - Living with two parents Both parents native 5,357 100.0% NativeBoth parents foreign-born 329 82.4% Native71 17.6% Foreign-bornOne native, one foreign-born parent 586 100.0% NativeChildren 6 to 17 years - Living with one parent Native parent 5,370 100.0% NativeForeign-born parent 693 59.6% Native469 40.4% Foreign-born
Grandparents responsible for own grandchildren in Wilmington
Grandparents (30 to 59 years) White / Caucasian 11 18.9% Responsible for grandchildren46 81.1% Not responsible for grandchildrenBlack or African American 97 49.1% Responsible for grandchildren101 50.9% Not responsible for grandchildrenOther race 15 100.0% Not responsible for grandchildrenTwo or more races 3 100.0% Not responsible for grandchildrenWhite alone, not Hispanic / Latino 12 19.4% Responsible for grandchildren48 80.6% Not responsible for grandchildrenHispanic or Latino 14 100.0% Not responsible for grandchildrenGrandparents (60 years and over) White / Caucasian 92 35.6% Responsible for grandchildren166 64.4% Not responsible for grandchildrenBlack or African American 125 90.3% Responsible for grandchildren13 9.7% Not responsible for grandchildrenTwo or more races 33 100.0% Not responsible for grandchildrenWhite alone, not Hispanic / Latino 94 35.7% Responsible for grandchildren170 64.3% Not responsible for grandchildren