West Seneca, NY (New York) Houses and Residents
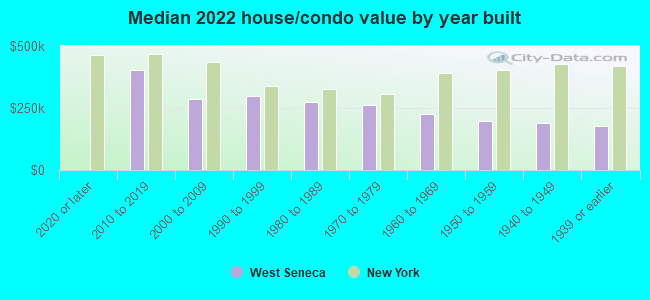
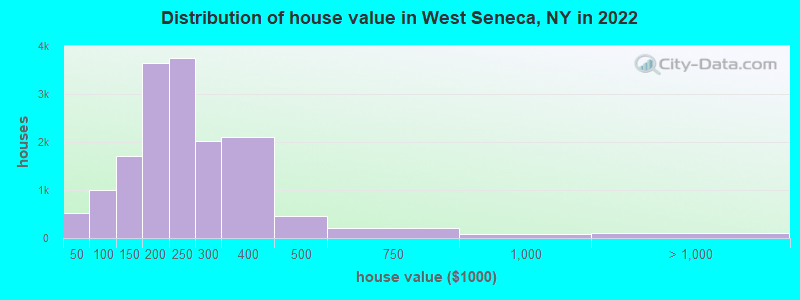
Estimated median house or condo value in 2022: $225,714 (it was $94,100 in 2000 )
West Seneca:
$225,714New York:
$400,400
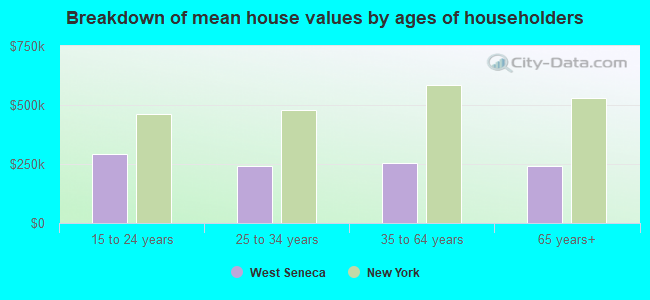
Lower value quartile - upper value quartile: $170,632 - $295,176Mean price in 2022: Detached houses: $234,556 Here:
$234,556State:
$476,719
Townhouses or other attached units: $183,737 Here:
$183,737State:
$699,270
In 2-unit structures: $165,821 Here:
$165,821State:
$713,077
In 3-to-4-unit structures: $124,170 Here:
$124,170State:
$764,568
In 5-or-more-unit structures: $98,799 Here:
$98,799State:
$912,009
Mobile homes: $329,478 Here:
$329,478State:
$88,925
Total population: 44,711 (All urban)
Houses: 21,331 (20,137 occupied: 15,628 owner occupied, 4,627 renter occupied )
% of renters here:
23%State:
46%
Housing density: 998 houses/condos per square mile
Median price asked for vacant for-sale houses and condos in 2022: $233,472.
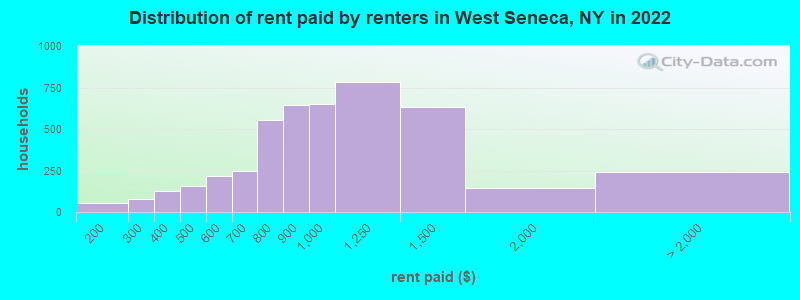
Median contract rent in 2022: $928 (lower quartile is $775, upper quartile is $1,184)
Median rent asked for vacant for-rent units in 2022: $2,099
Median gross rent in West Seneca, NY in 2022: $1,042
Housing units in West Seneca with a mortgage: 9,353 (1,282 second mortgage, 45 home equity loan, 1,097 both second mortgage and home equity loan )Houses without a mortgage: 789
Median household income for houses/condos with a mortgage: $102,115
Median household income for apartments without a mortgage: $64,302
Median monthly housing costs: $1,095
Data:
Median house or condo value ($)
Median house or condo value ($ change since 2000)
Median house or condo value ($) - White
Median house or condo value ($) - Black or African American
Median house or condo value ($) - Asian
Median house or condo value ($) - Hispanic or Latino
Median house or condo value ($) - American Indian and Alaska Native
Median house or condo value ($) - Multirace
Median house or condo value ($) - Other Race
Median price asked for mobile homes ($)
Household density (households per square mile)
Mean house or condo value by units in structure - 1, detached ($)
Mean house or condo value by units in structure - 1, attached ($)
Mean house or condo value by units in structure - 2 ($)
Mean house or condo value by units in structure by units in structure - 3 or 4 ($)
Mean house or condo value by units in structure - 5 or more ($)
Mean house or condo value by units in structure - Boat, RV, van, etc. ($)
Mean house or condo value by units in structure - Mobile home ($)
Median contract rent ($)
Median contract rent - Lower quartile ($)
Median contract rent - Upper quartile ($)
Median gross rent ($)
Urban houses (%)
Rural houses (%)
Houses occupied (%)
Houses occupied (% change since 2000)
Houses owner occupied (%)
Houses owner occupied (% change since 2000)
Houses renter occupied (%)
Houses renter occupied (% change since 2000)
Vacant housing units - For rent (%)
Vacant housing units - For rent (% change since 2000)
Vacant housing units - For sale only (%)
Vacant housing units - For sale only (% change since 2000)
Vacant housing units - Rented or sold, not occupied (%)
Vacant housing units - Rented or sold, not occupied (% change since 2000)
Vacant housing units - For seasonal, recreational, or occasional use (%)
Vacant housing units - For seasonal, recreational, or occasional use (% change since 2000)
Vacant housing units - For migrant workers (%)
Vacant housing units - For migrant workers (% change since 2000)
Vacant housing units - Other vacant (%)
Vacant housing units - Other vacant (% change since 2000)
Median monthly housing costs ($)
Median household income for houses/condos with a mortgage ($)
Median household income for houses/condos without a mortgage ($)
Median household income ($)
Median household income ($) - White
Median household income ($) - Black or African American
Median household income ($) - Asian
Median household income ($) - Hispanic or Latino
Median household income ($) - American Indian and Alaska Native
Median household income ($) - Multirace
Median household income ($) - Other Race
Mortgage status - with mortgage (%)
Mortgage status - with second mortgage (%)
Mortgage status - with home equity loan (%)
Mortgage status - with both second mortgage and home equity loan (%)
Mortgage status - without a mortgage (%)
Median year house/condo built
Median year apartment built
Household type by relationship - Male householder living alone (%)
Household type by relationship - Male householder not living alone (%)
Household type by relationship - Female householder living alone (%)
Household type by relationship - Female householder not living alone (%)
Household type by relationship - Opposite-Sex spouse (%)
Household type by relationship - Same-Sex spouse (%)
Household type by relationship - Opposite-Sex unmarried partner (%)
Household type by relationship - Same-Sex unmarried partner (%)
Household type by relationship - In group quarters (%)
Size of family households - 2-person household (%)
Size of family households - 3-person household (%)
Size of family households - 4-person household (%)
Size of family households - 5-person household (%)
Size of family households - 6-person household (%)
Size of family households - 7-or-more-person household (%)
Size of nonfamily households - 1-person household (%)
Size of nonfamily households - 2-person household (%)
Size of nonfamily households - 3-person household (%)
Size of nonfamily households - 4-person household (%)
Size of nonfamily households - 5-person household (%)
Size of nonfamily households - 6-person household (%)
Size of nonfamily households - 7-or-moreperson household (%)
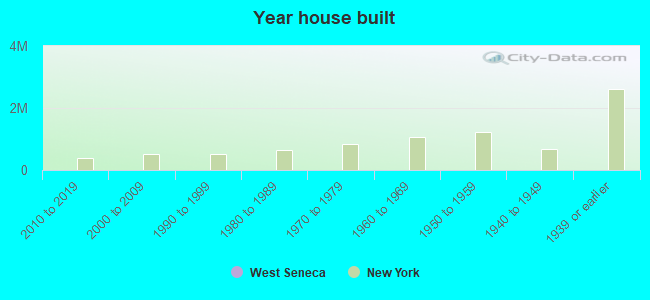
Year house built - Built 2010 or later (%)
Year house built - Built 2000 to 2009 (%)
Year house built - Built 1990 to 1999 (%)
Year house built - Built 1980 to 1989 (%)
Year house built - Built 1970 to 1979 (%)
Year house built - Built 1960 to 1969 (%)
Year house built - Built 1950 to 1959 (%)
Year house built - Built 1940 to 1949 (%)
Year house built - Built 1939 or earlier (%)
Median number of rooms in houses and condos
Median number of rooms in apartments
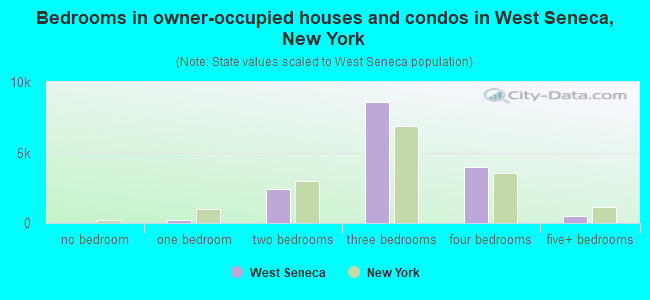
Median number of bedrooms in owner occupied houses
Mean number of bedrooms in owner occupied houses
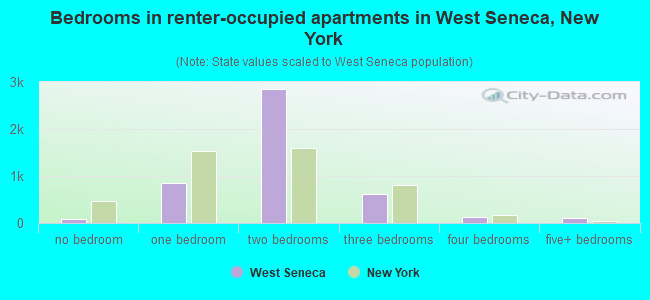
Median number of bedrooms in renter occupied houses
Mean number of bedrooms in renter occupied houses
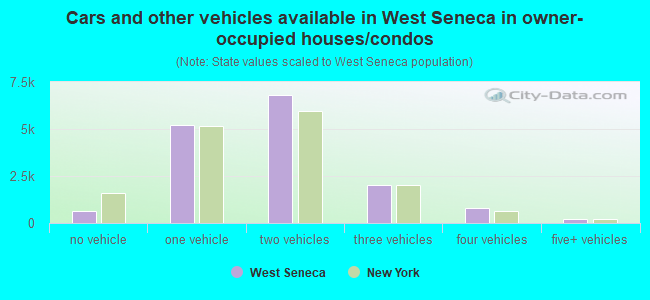
Median number of vehichles in owner occupied houses
Mean number of vehichles in owner occupied houses
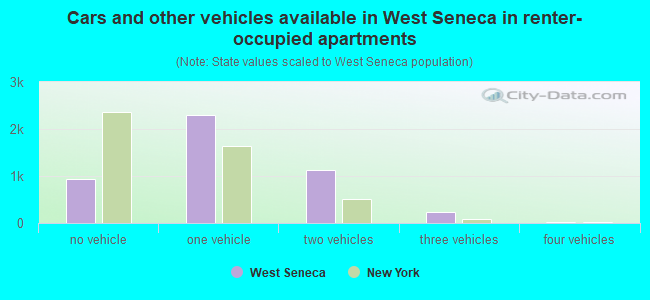
Median number of vehichles in renter occupied houses
Mean number of vehichles in renter occupied houses
Rooms in owner-occupied houses - 1 room (%)
Rooms in owner-occupied houses - 2 rooms (%)
Rooms in owner-occupied houses - 3 rooms (%)
Rooms in owner-occupied houses - 4 rooms (%)
Rooms in owner-occupied houses - 5 rooms (%)
Rooms in owner-occupied houses - 6 rooms (%)
Rooms in owner-occupied houses - 7 rooms (%)
Rooms in owner-occupied houses - 8 rooms (%)
Rooms in owner-occupied houses - 9+ rooms (%)
Rooms in renter-occupied houses - 1 room (%)
Rooms in renter-occupied houses - 2 rooms (%)
Rooms in renter-occupied houses - 3 rooms (%)
Rooms in renter-occupied houses - 4 rooms (%)
Rooms in renter-occupied houses - 5 rooms (%)
Rooms in renter-occupied houses - 6 rooms (%)
Rooms in renter-occupied houses - 7 rooms (%)
Rooms in renter-occupied houses - 8 rooms (%)
Rooms in renter-occupied houses - 9+ rooms (%)
Bedrooms in owner-occupied houses - no bedrooms (%)
Bedrooms in owner-occupied houses - 1 bedroom (%)
Bedrooms in owner-occupied houses - 2 bedrooms (%)
Bedrooms in owner-occupied houses - 3 bedrooms (%)
Bedrooms in owner-occupied houses - 4 bedrooms (%)
Bedrooms in owner-occupied houses - 5+ bedrooms (%)
Bedrooms in renter-occupied houses - no bedrooms (%)
Bedrooms in renter-occupied houses - 1 bedroom (%)
Bedrooms in renter-occupied houses - 2 bedrooms (%)
Bedrooms in renter-occupied houses - 3 bedrooms (%)
Bedrooms in renter-occupied houses - 4 bedrooms (%)
Bedrooms in renter-occupied houses - 5+ bedrooms (%)
Vehicles available in owner-occupied houses - no vehicle available (%)
Vehicles available in owner-occupied houses - 1 vehicle available(%)
Vehicles available in owner-occupied houses - 2 Vehicles available (%)
Vehicles available in owner-occupied houses - 3 Vehicles available (%)
Vehicles available in owner-occupied houses - 4 Vehicles available (%)
Vehicles available in owner-occupied houses - 5+ Vehicles available (%)
Vehicles available in renter-occupied houses - no vehicle available (%)
Vehicles available in renter-occupied houses - 1 vehicle available (%)
Vehicles available in renter-occupied houses - 2 Vehicles available (%)
Vehicles available in renter-occupied houses - 3 Vehicles available (%)
Vehicles available in renter-occupied houses - 4 Vehicles available (%)
Vehicles available in renter-occupied houses - 5+ Vehicles available (%)
Housing units in structures - 1, detached (%)
Housing units in structures - 1, attached (%)
Housing units in structures - 2 (%)
Housing units in structures - 3 or 4 (%)
Housing units in structures - 5 to 9 (%)
Housing units in structures - 10 to 19 (%)
Housing units in structures - 20 to 49 (%)
Housing units in structures - 50 or more (%)
Housing units in structures - Mobile home (%)
Housing units in structures - Boat, RV, van, etc. (%)
Housing units in structures - Owners - 1, detached (%)
Housing units in structures - Owners - 1, attached (%)
Housing units in structures - Owners - 2 (%)
Housing units in structures - Owners - 3 or 4 (%)
Housing units in structures - Owners - 5 to 9 (%)
Housing units in structures - Owners - 10 to 19 (%)
Housing units in structures - Owners - 20 to 49 (%)
Housing units in structures - Owners - 50 or more (%)
Housing units in structures - Owners - Mobile home (%)
Housing units in structures - Owners - Boat, RV, van, etc. (%)
Housing units in structures - Renters - 1, detached (%)
Housing units in structures - Renters - 1, attached (%)
Housing units in structures - Renters - 2 (%)
Housing units in structures - Renters - 3 or 4 (%)
Housing units in structures - Renters - 5 to 9 (%)
Housing units in structures - Renters - 10 to 19 (%)
Housing units in structures - Renters - 20 to 49 (%)
Housing units in structures - Renters - 50 or more (%)
Housing units in structures - Renters - Mobile home (%)
Housing units in structures - Renters - Boat, RV, van, etc. (%)
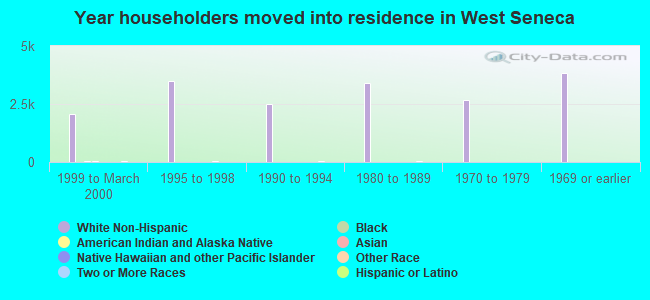
House/condo owner moved in on average (years ago)
Renter moved in on average (years ago)
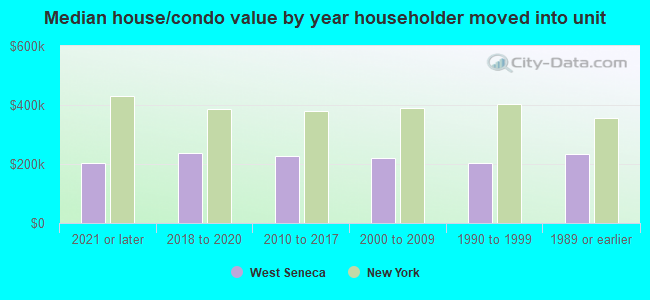
Year householder moved into unit - Moved in 1999 to March 2000 (%)
Year householder moved into unit - Moved in 1999 to March 2000 (%) - White
Year householder moved into unit - Moved in 1999 to March 2000 (%) - Black or African American
Year householder moved into unit - Moved in 1999 to March 2000 (%) - Asian
Year householder moved into unit - Moved in 1999 to March 2000 (%) - Hispanic or Latino
Year householder moved into unit - Moved in 1999 to March 2000 (%) - American Indian and Alaska Native
Year householder moved into unit - Moved in 1999 to March 2000 (%) - Multirace
Year householder moved into unit - Moved in 1999 to March 2000 (%) - Other Race
Year householder moved into unit - Moved in 1995 to 1998 (%)
Year householder moved into unit - Moved in 1995 to 1998 (%) - White
Year householder moved into unit - Moved in 1995 to 1998 (%) - Black or African American
Year householder moved into unit - Moved in 1995 to 1998 (%) - Asian
Year householder moved into unit - Moved in 1995 to 1998 (%) - Hispanic or Latino
Year householder moved into unit - Moved in 1995 to 1998 (%) - American Indian and Alaska Native
Year householder moved into unit - Moved in 1995 to 1998 (%) - Multirace
Year householder moved into unit - Moved in 1995 to 1998 (%) - Other Race
Year householder moved into unit - Moved in 1990 to 1994 (%)
Year householder moved into unit - Moved in 1990 to 1994 (%) - White
Year householder moved into unit - Moved in 1990 to 1994 (%) - Black or African American
Year householder moved into unit - Moved in 1990 to 1994 (%) - Asian
Year householder moved into unit - Moved in 1990 to 1994 (%) - Hispanic or Latino
Year householder moved into unit - Moved in 1990 to 1994 (%) - American Indian and Alaska Native
Year householder moved into unit - Moved in 1990 to 1994 (%) - Multirace
Year householder moved into unit - Moved in 1990 to 1994 (%) - Other Race
Year householder moved into unit - Moved in 1980 to 1989 (%)
Year householder moved into unit - Moved in 1980 to 1989 (%) - White
Year householder moved into unit - Moved in 1980 to 1989 (%) - Black or African American
Year householder moved into unit - Moved in 1980 to 1989 (%) - Asian
Year householder moved into unit - Moved in 1980 to 1989 (%) - Hispanic or Latino
Year householder moved into unit - Moved in 1980 to 1989 (%) - American Indian and Alaska Native
Year householder moved into unit - Moved in 1980 to 1989 (%) - Multirace
Year householder moved into unit - Moved in 1980 to 1989 (%) - Other Race
Year householder moved into unit - Moved in 1970 to 1979 (%)
Year householder moved into unit - Moved in 1970 to 1979 (%) - White
Year householder moved into unit - Moved in 1970 to 1979 (%) - Black or African American
Year householder moved into unit - Moved in 1970 to 1979 (%) - Asian
Year householder moved into unit - Moved in 1970 to 1979 (%) - Hispanic or Latino
Year householder moved into unit - Moved in 1970 to 1979 (%) - American Indian and Alaska Native
Year householder moved into unit - Moved in 1970 to 1979 (%) - Multirace
Year householder moved into unit - Moved in 1970 to 1979 (%) - Other Race
Year householder moved into unit - Moved in 1969 or earlier (%)
Year householder moved into unit - Moved in 1969 or earlier (%) - White
Year householder moved into unit - Moved in 1969 or earlier (%) - Black or African American
Year householder moved into unit - Moved in 1969 or earlier (%) - Asian
Year householder moved into unit - Moved in 1969 or earlier (%) - Hispanic or Latino
Year householder moved into unit - Moved in 1969 or earlier (%) - American Indian and Alaska Native
Year householder moved into unit - Moved in 1969 or earlier (%) - Multirace
Year householder moved into unit - Moved in 1969 or earlier (%) - Other Race
Housing units lacking complete plumbing facilities (%)
Housing units lacking complete kitchen facilities (%)
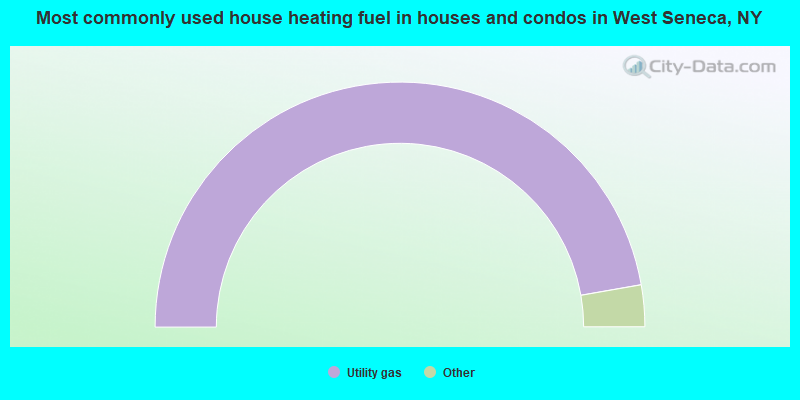
House heating fuel used in houses and condos - Utility gas (%)
House heating fuel used in houses and condos - Bottled, tank, or LP gas (%)
House heating fuel used in houses and condos - Electricity (%)
House heating fuel used in houses and condos - Fuel oil, kerosene, etc. (%)
House heating fuel used in houses and condos - Coal or coke (%)
House heating fuel used in houses and condos - Wood (%)
House heating fuel used in houses and condos - Solar energy (%)
House heating fuel used in houses and condos - Other fuel (%)
House heating fuel used in houses and condos - No fuel used (%)
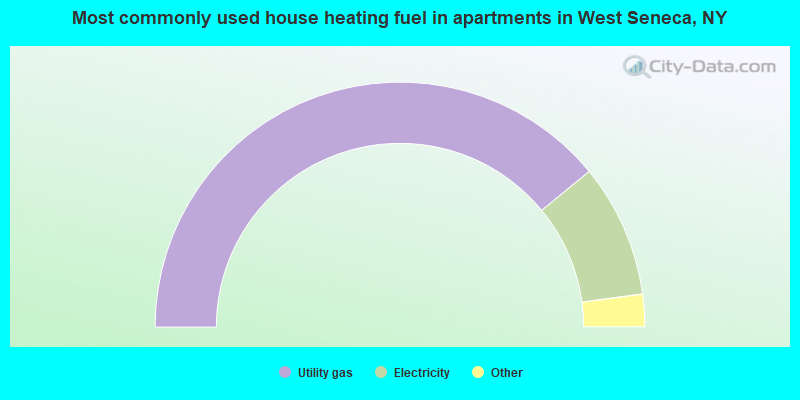
House heating fuel used in apartments - Utility gas (%)
House heating fuel used in apartments - Bottled, tank, or LP gas (%)
House heating fuel used in apartments - Electricity (%)
House heating fuel used in apartments - Fuel oil, kerosene, etc. (%)
House heating fuel used in apartments - Coal or coke (%)
House heating fuel used in apartments - Wood (%)
House heating fuel used in apartments - Solar energy (%)
House heating fuel used in apartments - Other fuel (%)
House heating fuel used in apartments - No fuel used (%)
Median year house/condo built: 1965Median year apartment built: 1972Household type by relationship:
Households: 45,343
Male householders: 9,467 (2,745 living alone ), Female householders: 10,528 (3,967 living alone )8,831 spouses (8,785 opposite-sex spouses ), 1,617 unmarried partners , (1,571 opposite-sex unmarried partners ), 11,717 children (11,077 natural , 179 adopted , 460 stepchildren ), 452 grandchildren , 495 brothers or sisters , 341 parents , 0 foster children , 400 other relatives , 984 non-relatives In group quarters: 505
Size of family households: 6,190 2-persons , 2,469 3-persons , 2,150 4-persons , 1,101 5-persons , 297 6-persons , 58 7-or-more-persons .
Size of nonfamily households: 6,711 1-person , 1,215 2-persons , 51 3-persons , 19 4-persons , 16 5-persons .
5,557 married couples with children. single-parent households (648 men , 1,541 women ).
95.3% of residents of West Seneca speak English at home. of residents speak Spanish at home (76% speak English very well , 18% speak English well , 1% speak English not well , 5% don't speak English at all ).of residents speak other Indo-European language at home (77% speak English very well , 20% speak English well , 2% speak English not well ).of residents speak Asian or Pacific Island language at home (83% speak English very well , 17% speak English not well ).of residents speak other language at home (64% speak English very well , 33% speak English well , 3% speak English not well ).
Foreign born population: 1,117 (2.5%)of them are naturalized citizens )
Median number of rooms in houses and condos:
Median number of rooms in apartments
Owner-occupied Renter-occupied
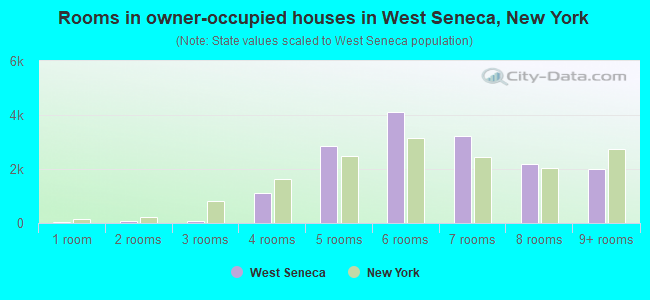
Rooms in owner-occupied houses in West Seneca, New York
20 1 room 68 2 rooms 90 3 rooms 1,110 4 rooms 2,851 5 rooms 4,108 6 rooms 3,214 7 rooms 2,175 8 rooms 1,993 9+ rooms
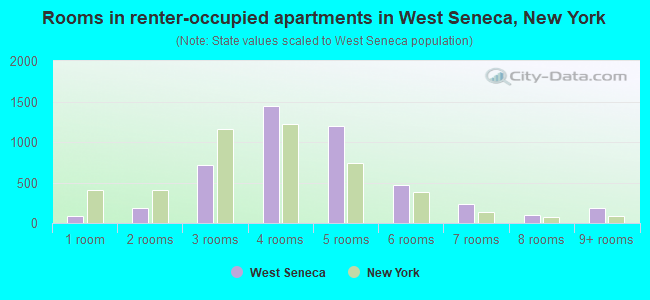
Rooms in renter-occupied apartments in West Seneca, New York
84 1 room 190 2 rooms 720 3 rooms 1,447 4 rooms 1,195 5 rooms 469 6 rooms 235 7 rooms 104 8 rooms 184 9+ rooms
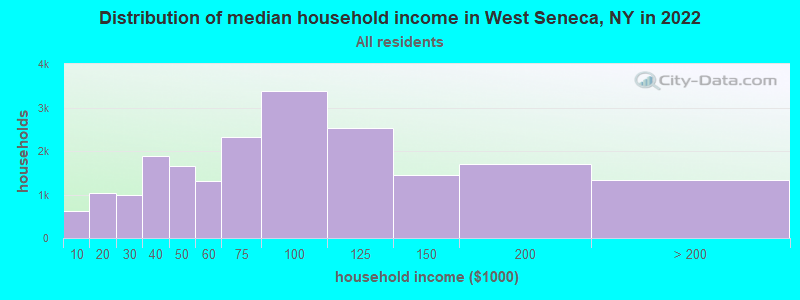
West Seneca, NY household income distribution 626 Less than $10,0001,036 $10,000 to $19,999991 $20,000 to $29,9991,876 $30,000 to $39,9991,654 $40,000 to $49,9991,302 $50,000 to $59,9992,321 $60,000 to $74,9993,387 $75,000 to $99,9992,539 $100,000 to $124,9991,452 $125,000 to $149,9991,710 $150,000 to $199,9991,332 $200,000 or more
Home value of owner - occupied houses in 2022 in West Seneca, NY 34 Less than $10,000126 $10,000 to $14,99989 $15,000 to $19,99927 $20,000 to $24,99919 $25,000 to $29,99939 $30,000 to $34,99955 $35,000 to $39,999118 $40,000 to $49,99958 $50,000 to $59,999145 $60,000 to $69,999373 $70,000 to $79,999134 $80,000 to $89,999160 $90,000 to $99,9991,024 $100,000 to $124,999694 $125,000 to $149,9991,969 $150,000 to $174,9991,686 $175,000 to $199,9993,745 $200,000 to $249,9992,014 $250,000 to $299,9992,106 $300,000 to $399,999468 $400,000 to $499,999208 $500,000 to $749,99991 $750,000 to $999,99924 $1,000,000 to $1,499,99985 $2,000,000 or moreRent paid by renters in 2022 in West Seneca, NY 53 $150 to $19980 $200 to $24993 $300 to $34934 $350 to $39947 $400 to $449107 $450 to $499143 $500 to $54974 $550 to $599140 $600 to $649108 $650 to $699184 $700 to $749370 $750 to $799644 $800 to $899650 $900 to $999783 $1,000 to $1,249631 $1,250 to $1,499146 $1,500 to $1,99914 $2,000 to $2,49912 $2,500 to $2,99942 $3,500 or more172 No cash rent
Percentage of workers working in this county: 95.3%Number of people working at home: 2,959 (12.3% of all workers )
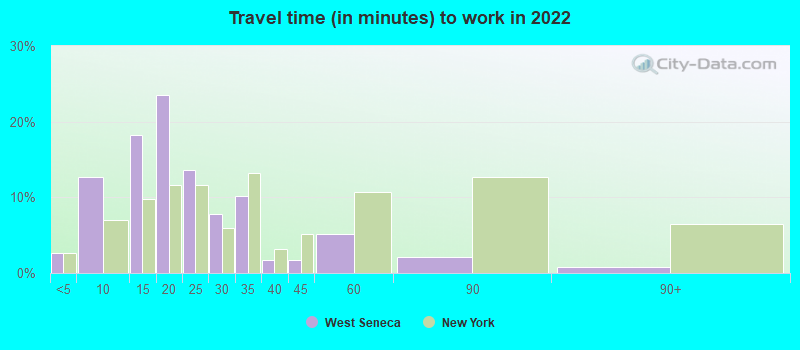
Travel time to work (commute)
Less than 5 minutes: 5865 to 9 minutes: 2,32410 to 14 minutes: 2,89515 to 19 minutes: 3,96520 to 24 minutes: 4,18825 to 29 minutes: 2,19130 to 34 minutes: 2,40235 to 39 minutes: 48440 to 44 minutes: 55745 to 59 minutes: 63160 to 89 minutes: 29590 or more minutes: 328
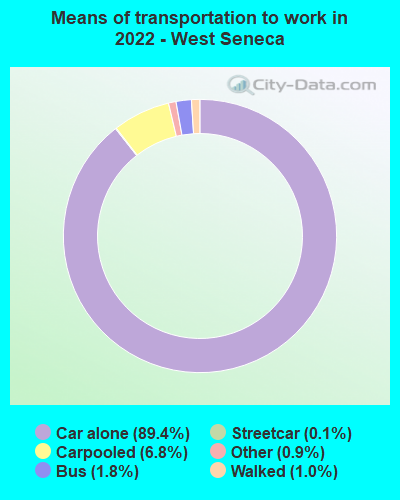
Means of transportation to work:
Drove a car alone: 13,550 (74.1%)Carpooled: 1,226 (6.7%)Bus : 311 (1.7%)Subway or elevated rail : 9 (0.0%)Taxi: 198 (1.1%)Walked: 158 (0.9%)Worked at home: 2,959 (16.2%)
Unemployment by race in 2022
Unemployment rate for White non-Hispanic residents 3.1% Males3.0% FemalesUnemployment rate for Black residents 12.6% MalesUnemployment rate for two or more race residents 4.9% Males5.8% FemalesUnemployment rate for Hispanic or Latino residents 3.8% Males3.3% Females
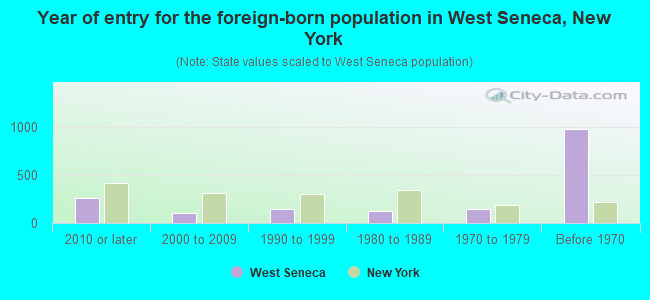
Year of entry for the foreign-born population in West Seneca, New York
263 2010 or later 108 2000 to 2009 147 1990 to 1999 125 1980 to 1989 150 1970 to 1979 979 Before 1970
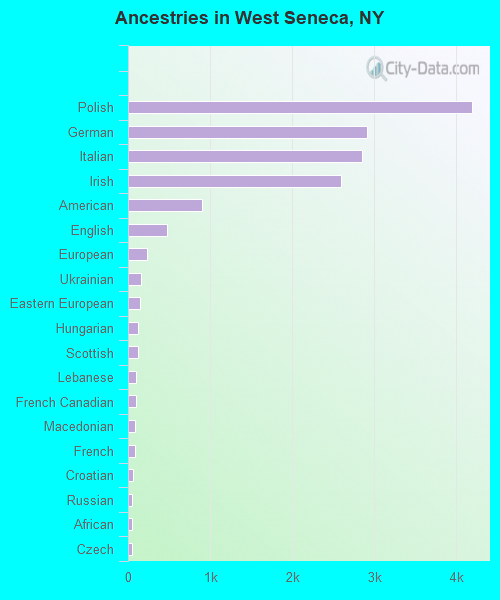
First ancestries reported:
Polish: 4,189 (23.9%)
German: 2,915 (16.6%)
Italian: 2,849 (16.3%)
Irish: 2,592 (14.8%)
American: 904 (5.2%)
English: 476 (2.7%)
European: 229 (1.3%)
Ukrainian: 153 (0.9%)
Eastern European: 147 (0.8%)
Hungarian: 127 (0.7%)
Scottish: 125 (0.7%)
Lebanese: 102 (0.6%)
French Canadian: 96 (0.5%)
Macedonian: 84 (0.5%)
French: 83 (0.5%)
Croatian: 55 (0.3%)
Russian: 52 (0.3%)
African: 48 (0.3%)
Czech: 43 (0.2%)
Palestinian: 31 (0.2%)
Arab: 29 (0.2%)
Swiss: 29 (0.2%)
British: 27 (0.2%)
Canadian: 24 (0.1%)
Scotch-Irish: 21 (0.1%)
Danish: 19 (0.1%)
Turkish: 17 (0.10%)
Welsh: 15 (0.09%)
Greek: 12 (0.07%)
Pennsylvania German: 11 (0.06%)
Slavic: 11 (0.06%)
Dutch: 10 (0.06%)
Swedish: 8 (0.05%)
Czechoslovakian: 7 (0.04%) Most common places of birth for foreign-born residents (%): Italy West Seneca:
12.9% (149)New York:
1.8% (81,374)
Canada West Seneca:
12.1% (139)New York:
1.3% (59,107)
Germany West Seneca:
6.3% (73)New York:
0.9% (38,713)
Ireland West Seneca:
4.9% (56)New York:
0.6% (26,772)
Ethiopia West Seneca:
4.1% (47)New York:
0.1% (6,029)
Other Northern Africa West Seneca:
3.3% (38)New York:
0.0% (2,170)
Philippines West Seneca:
3.2% (37)New York:
2.0% (91,070)
Hungary West Seneca:
3.1% (36)New York:
0.2% (8,808)
Czechoslovakia (includes Czech Republic and Slovakia) West Seneca:
3.0% (35)New York:
0.2% (8,766)
Poland West Seneca:
2.9% (33)New York:
1.4% (65,102)
Europe, n.e.c. West Seneca:
2.6% (30)New York:
0.1% (2,567)
Turkey West Seneca:
2.5% (29)New York:
0.5% (21,009)
United Kingdom, excluding England and Scotland West Seneca:
2.3% (26)New York:
0.8% (33,869)
Other Western Africa West Seneca:
2.3% (26)New York:
0.4% (19,133)
Dominican Republic West Seneca:
2.0% (23)New York:
11.1% (501,040)
Thailand West Seneca:
1.9% (22)New York:
0.3% (14,037)
Syria West Seneca:
1.8% (21)New York:
0.2% (7,798)
Pakistan West Seneca:
1.7% (20)New York:
1.4% (62,442)
Liberia West Seneca:
1.7% (20)New York:
0.1% (4,623)
Mexico West Seneca:
1.7% (20)New York:
4.8% (214,559)
Scotland West Seneca:
1.6% (19)New York:
0.1% (5,087)
Russia West Seneca:
1.6% (19)New York:
1.7% (75,802)
China, excluding Hong Kong and Taiwan West Seneca:
1.6% (19)New York:
9.1% (410,910)
Place of birth for U.S.-born residents:
This state: 40,617Other state: 3,295Northeast: 1,108Midwest: 698South: 912West: 563 94.4% of West Seneca residents lived in the same house 1 years ago.
Out of people who lived in different houses, 42.3% lived in this county.
Out of people who lived in different counties, 63.9% lived in New York.
West Seneca:
94.4%State average:
89.6%
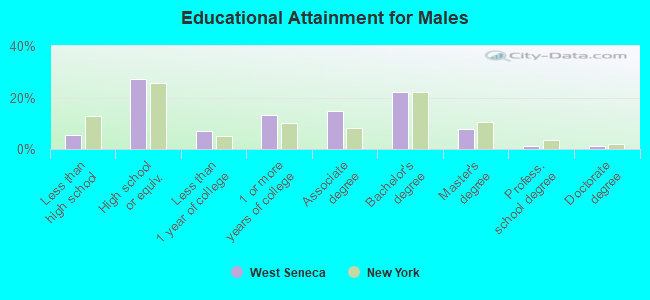
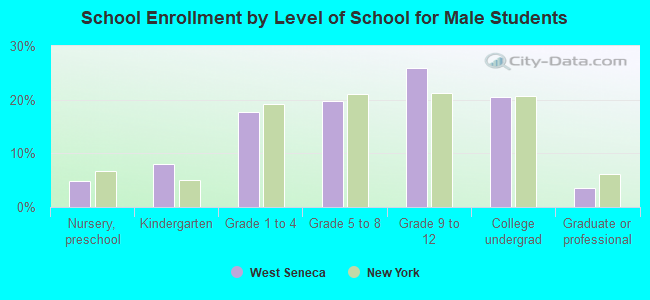
Education attainment for males 25 years and older:
No schooling: 261Nursery to 4th grade: 115th and 6th grade: 07th and 8th grade: 639th grade: 3310th grade: 4711th grade: 13112th grade, no diploma: 322High school graduate (or equivalency): 4,456Less than 1 year of college: 1,126Some college more than 1 year, no degree: 2,185Associate degree: 2,417Bachelor's degree: 3,597Master's degree: 1,289Professional school degree: 209Doctorate degree: 191
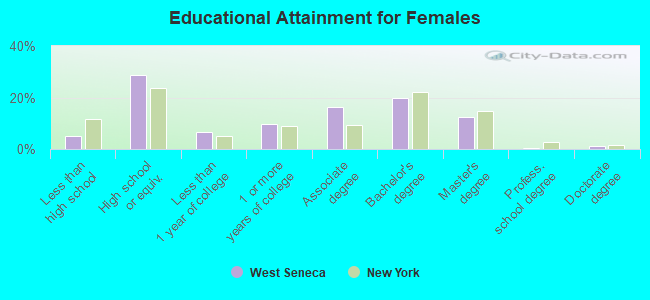
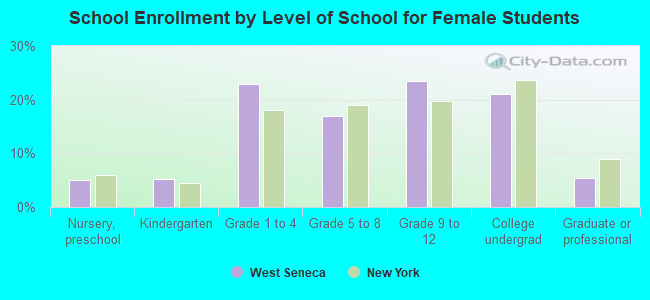
Education attainment for females 25 years and older:
No schooling: 292Nursery to 4th grade: 615th and 6th grade: 147th and 8th grade: 309th grade: 2110th grade: 20011th grade: 11412th grade, no diploma: 152High school graduate (or equivalency): 4,980Less than 1 year of college: 1,163Some college more than 1 year, no degree: 1,677Associate degree: 2,841Bachelor's degree: 3,408Master's degree: 2,143Professional school degree: 91Doctorate degree: 185
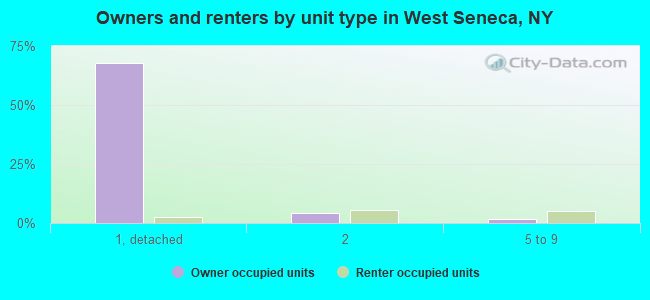
Housing units in structures:
One, detached: 14,685One, attached: 541Two: 2,3323 or 4: 6105 to 9: 1,33710 to 19: 47720 to 49: 12850 or more: 925Mobile homes: 291Median worth of mobile homes: $63,189
Housing units lacking complete plumbing facilities in 2022: 1.4%Housing units lacking complete kitchen facilities in 2022: 2.2%House/condo owner moved in on average 14 years ago
Renter moved in on average 3 years ago
Private vs. public school enrollment:
Students in private schools in grades 1 to 8 (elementary and middle school): 298 Students in private schools in grades 9 to 12 (high school): 233 Students in private undergraduate colleges: 490