Races in West Seneca, New York (NY) Detailed Stats
Data:
Races - White alone (%)
Races - White alone (% change since 2000)
Races - Black alone (%)
Races - Black alone (% change since 2000)
Races - American Indian alone (%)
Races - American Indian alone (% change since 2000)
Races - Asian alone (%)
Races - Asian alone (% change since 2000)
Races - Hispanic (%)
Races - Hispanic (% change since 2000)
Races - Native Hawaiian and Other Pacific Islander alone (%)
Races - Native Hawaiian and Other Pacific Islander alone (% change since 2000)
Races - Two or more races(%)
Races - Two or more races(% change since 2000)
Races - Other race alone (%)
Races - Other race alone (% change since 2000)
Racial diversity
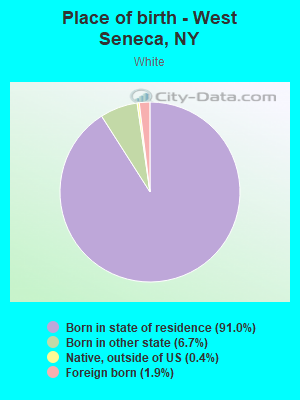
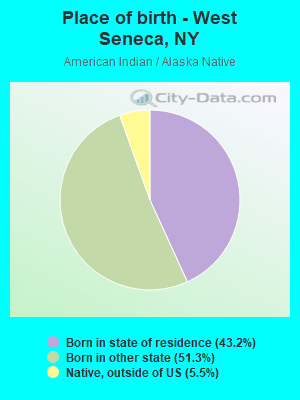
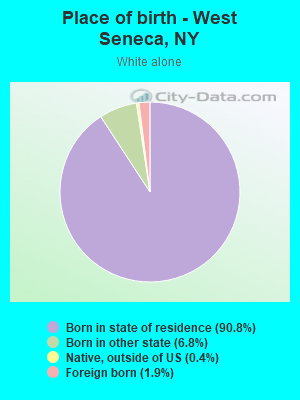
Place of birth - Born in state of residence (%)
Place of birth - Born in state of residence (%) - White
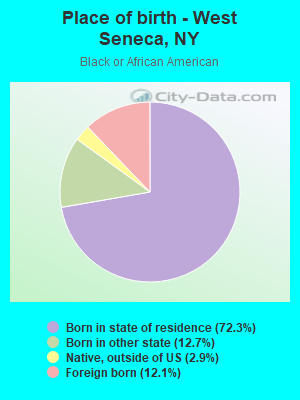
Place of birth - Born in state of residence (%) - Black or African American
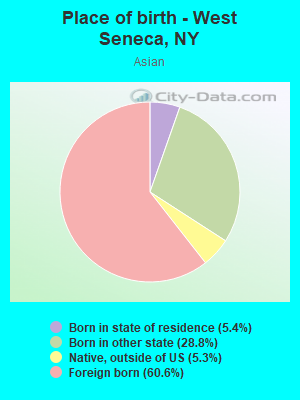
Place of birth - Born in state of residence (%) - Asian
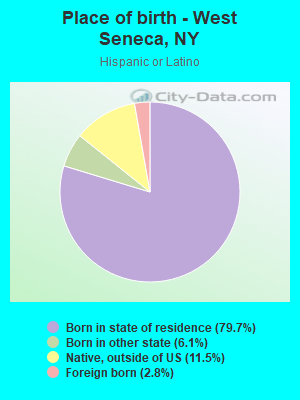
Place of birth - Born in state of residence (%) - Hispanic or Latino
Place of birth - Born in state of residence (%) - American Indian and Alaska Native
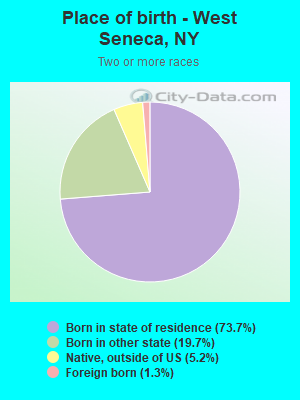
Place of birth - Born in state of residence (%) - Multirace
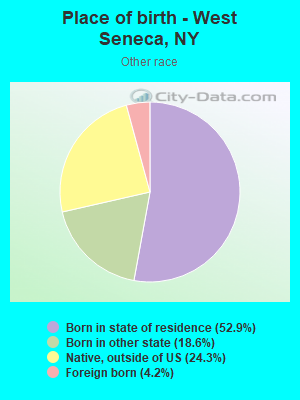
Place of birth - Born in state of residence (%) - Other Race
Place of birth - Born in other state (%)
Place of birth - Born in other state (%) - White
Place of birth - Born in other state (%) - Black or African American
Place of birth - Born in other state (%) - Asian
Place of birth - Born in other state (%) - Hispanic or Latino
Place of birth - Born in other state (%) - American Indian and Alaska Native
Place of birth - Born in other state (%) - Multirace
Place of birth - Born in other state (%) - Other Race
Place of birth - Native, outside of US (%)
Place of birth - Native, outside of US (%) - White
Place of birth - Native, outside of US (%) - Black or African American
Place of birth - Native, outside of US (%) - Asian
Place of birth - Native, outside of US (%) - Hispanic or Latino
Place of birth - Native, outside of US (%) - American Indian and Alaska Native
Place of birth - Native, outside of US (%) - Multirace
Place of birth - Native, outside of US (%) - Other Race
Place of birth - Foreign born (%)
Place of birth - Foreign born (%) - White
Place of birth - Foreign born (%) - Black or African American
Place of birth - Foreign born (%) - Asian
Place of birth - Foreign born (%) - Hispanic or Latino
Place of birth - Foreign born (%) - American Indian and Alaska Native
Place of birth - Foreign born (%) - Multirace
Place of birth - Foreign born (%) - Other Race
Residents speaking English at home (%)
Residents speaking English at home - Born in the United States (%)
Residents speaking English at home - Native, born elsewhere (%)
Residents speaking English at home - Foreign born (%)
Residents speaking Spanish at home (%)
Residents speaking Spanish at home - Born in the United States (%)
Residents speaking Spanish at home - Native, born elsewhere (%)
Residents speaking Spanish at home - Foreign born (%)
Residents speaking other language at home (%)
Residents speaking other language at home - Born in the United States (%)
Residents speaking other language at home - Native, born elsewhere (%)
Residents speaking other language at home - Foreign born (%)
Marital status - Never married (%)
Marital status - Now married (%)
Marital status - Separated (%)
Marital status - Widowed (%)
Marital status - Divorced (%)
Ancestries Reported - Arab (%)
Ancestries Reported - Czech (%)
Ancestries Reported - Danish (%)
Ancestries Reported - Dutch (%)
Ancestries Reported - English (%)
Ancestries Reported - French (%)
Ancestries Reported - French Canadian (%)
Ancestries Reported - German (%)
Ancestries Reported - Greek (%)
Ancestries Reported - Hungarian (%)
Ancestries Reported - Irish (%)
Ancestries Reported - Italian (%)
Ancestries Reported - Lithuanian (%)
Ancestries Reported - Norwegian (%)
Ancestries Reported - Polish (%)
Ancestries Reported - Portuguese (%)
Ancestries Reported - Russian (%)
Ancestries Reported - Scotch-Irish (%)
Ancestries Reported - Scottish (%)
Ancestries Reported - Slovak (%)
Ancestries Reported - Subsaharan African (%)
Ancestries Reported - Swedish (%)
Ancestries Reported - Swiss (%)
Ancestries Reported - Ukrainian (%)
Ancestries Reported - United States (%)
Ancestries Reported - Welsh (%)
Ancestries Reported - West Indian (%)
Ancestries Reported - Other (%)
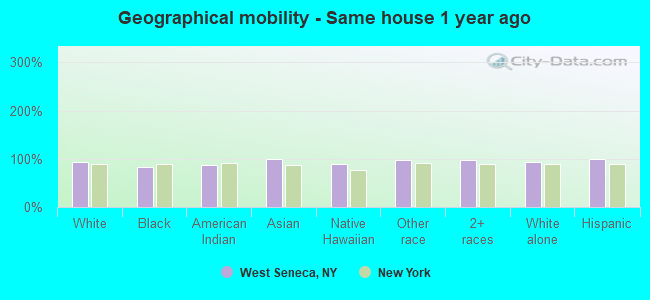
Geographical mobility - Same house 1 year ago (%)
Geographical mobility - Same house 1 year ago (%) - White
Geographical mobility - Same house 1 year ago (%) - Black or African American
Geographical mobility - Same house 1 year ago (%) - Asian
Geographical mobility - Same house 1 year ago (%) - Hispanic or Latino
Geographical mobility - Same house 1 year ago (%) - American Indian and Alaska Native
Geographical mobility - Same house 1 year ago (%) - Multirace
Geographical mobility - Same house 1 year ago (%) - Other Race
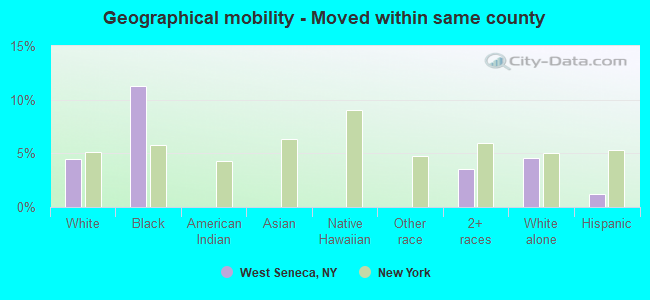
Geographical mobility - Moved within same county (%)
Geographical mobility - Moved within same county (%) - White
Geographical mobility - Moved within same county (%) - Black or African American
Geographical mobility - Moved within same county (%) - Asian
Geographical mobility - Moved within same county (%) - Hispanic or Latino
Geographical mobility - Moved within same county (%) - American Indian and Alaska Native
Geographical mobility - Moved within same county (%) - Multirace
Geographical mobility - Moved within same county (%) - Other Race
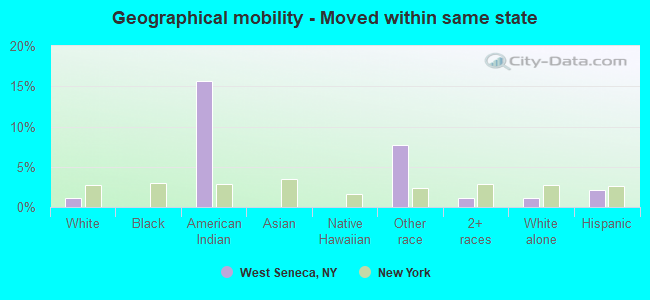
Geographical mobility - Moved from different county within same state (%)
Geographical mobility - Moved from different county within same state (%) - White
Geographical mobility - Moved from different county within same state (%) - Black or African American
Geographical mobility - Moved from different county within same state (%) - Asian
Geographical mobility - Moved from different county within same state (%) - Hispanic or Latino
Geographical mobility - Moved from different county within same state (%) - American Indian and Alaska Native
Geographical mobility - Moved from different county within same state (%) - Multirace
Geographical mobility - Moved from different county within same state (%) - Other Race
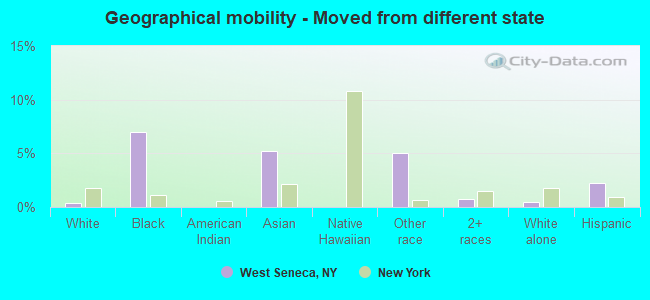
Geographical mobility - Moved from different state (%)
Geographical mobility - Moved from different state (%) - White
Geographical mobility - Moved from different state (%) - Black or African American
Geographical mobility - Moved from different state (%) - Asian
Geographical mobility - Moved from different state (%) - Hispanic or Latino
Geographical mobility - Moved from different state (%) - American Indian and Alaska Native
Geographical mobility - Moved from different state (%) - Multirace
Geographical mobility - Moved from different state (%) - Other Race
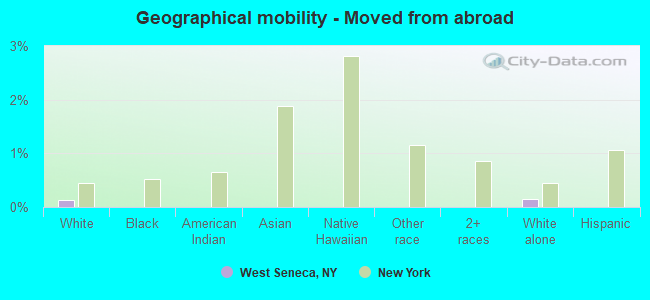
Geographical mobility - Moved from abroad (%)
Geographical mobility - Moved from abroad (%) - White
Geographical mobility - Moved from abroad (%) - Black or African American
Geographical mobility - Moved from abroad (%) - Asian
Geographical mobility - Moved from abroad (%) - Hispanic or Latino
Geographical mobility - Moved from abroad (%) - American Indian and Alaska Native
Geographical mobility - Moved from abroad (%) - Multirace
Geographical mobility - Moved from abroad (%) - Other Race
Place of birth for the foreign-born population - Ireland (%)
Place of birth for the foreign-born population - Denmark (%)
Place of birth for the foreign-born population - Norway (%)
Place of birth for the foreign-born population - Sweden (%)
Place of birth for the foreign-born population - United Kingdom (%)
Place of birth for the foreign-born population - England (%)
Place of birth for the foreign-born population - Scotland (%)
Place of birth for the foreign-born population - Other Northern Europe (%)
Place of birth for the foreign-born population - Austria (%)
Place of birth for the foreign-born population - Belgium (%)
Place of birth for the foreign-born population - France (%)
Place of birth for the foreign-born population - Germany (%)
Place of birth for the foreign-born population - Netherlands (%)
Place of birth for the foreign-born population - Switzerland (%)
Place of birth for the foreign-born population - Other Western Europe (%)
Place of birth for the foreign-born population - Greece (%)
Place of birth for the foreign-born population - Italy (%)
Place of birth for the foreign-born population - Portugal (%)
Place of birth for the foreign-born population - Spain (%)
Place of birth for the foreign-born population - Other Southern Europe (%)
Place of birth for the foreign-born population - Albania (%)
Place of birth for the foreign-born population - Belarus (%)
Place of birth for the foreign-born population - Bosnia and Herzegovina (%)
Place of birth for the foreign-born population - Bulgaria (%)
Place of birth for the foreign-born population - Croatia (%)
Place of birth for the foreign-born population - Czechoslovakia (%)
Place of birth for the foreign-born population - Hungary (%)
Place of birth for the foreign-born population - Latvia (%)
Place of birth for the foreign-born population - Lithuania (%)
Place of birth for the foreign-born population - North Macedonia (Macedonia) (%)
Place of birth for the foreign-born population - Moldova (%)
Place of birth for the foreign-born population - Poland (%)
Place of birth for the foreign-born population - Romania (%)
Place of birth for the foreign-born population - Russia (%)
Place of birth for the foreign-born population - Serbia (%)
Place of birth for the foreign-born population - Ukraine (%)
Place of birth for the foreign-born population - Other Eastern Europe (%)
Place of birth for the foreign-born population - China (%)
Place of birth for the foreign-born population - Hong Kong (%)
Place of birth for the foreign-born population - Taiwan (%)
Place of birth for the foreign-born population - Japan (%)
Place of birth for the foreign-born population - Korea (%)
Place of birth for the foreign-born population - Other Eastern Asia (%)
Place of birth for the foreign-born population - Afghanistan (%)
Place of birth for the foreign-born population - Bangladesh (%)
Place of birth for the foreign-born population - India (%)
Place of birth for the foreign-born population - Iran (%)
Place of birth for the foreign-born population - Kazakhstan (%)
Place of birth for the foreign-born population - Nepal (%)
Place of birth for the foreign-born population - Pakistan (%)
Place of birth for the foreign-born population - Sri Lanka (%)
Place of birth for the foreign-born population - Uzbekistan (%)
Place of birth for the foreign-born population - Other South Central Asia (%)
Place of birth for the foreign-born population - Burma (%)
Place of birth for the foreign-born population - Cambodia (%)
Place of birth for the foreign-born population - Indonesia (%)
Place of birth for the foreign-born population - Laos (%)
Place of birth for the foreign-born population - Malaysia (%)
Place of birth for the foreign-born population - Philippines (%)
Place of birth for the foreign-born population - Singapore (%)
Place of birth for the foreign-born population - Thailand (%)
Place of birth for the foreign-born population - Vietnam (%)
Place of birth for the foreign-born population - Other South Eastern Asia (%)
Place of birth for the foreign-born population - Armenia (%)
Place of birth for the foreign-born population - Iraq (%)
Place of birth for the foreign-born population - Israel (%)
Place of birth for the foreign-born population - Jordan (%)
Place of birth for the foreign-born population - Kuwait (%)
Place of birth for the foreign-born population - Lebanon (%)
Place of birth for the foreign-born population - Saudi Arabia (%)
Place of birth for the foreign-born population - Syria (%)
Place of birth for the foreign-born population - Turkey (%)
Place of birth for the foreign-born population - Yemen (%)
Place of birth for the foreign-born population - Other Western Asia (%)
Place of birth for the foreign-born population - Eritrea (%)
Place of birth for the foreign-born population - Ethiopia (%)
Place of birth for the foreign-born population - Kenya (%)
Place of birth for the foreign-born population - Somalia (%)
Place of birth for the foreign-born population - Uganda (%)
Place of birth for the foreign-born population - Zimbabwe (%)
Place of birth for the foreign-born population - Other Eastern Africa (%)
Place of birth for the foreign-born population - Cameroon (%)
Place of birth for the foreign-born population - Congo (%)
Place of birth for the foreign-born population - Democratic Republic of Congo (Zaire) (%)
Place of birth for the foreign-born population - Other Middle Africa (%)
Place of birth for the foreign-born population - Egypt (%)
Place of birth for the foreign-born population - Morocco (%)
Place of birth for the foreign-born population - Sudan (%)
Place of birth for the foreign-born population - Other Northern Africa (%)
Place of birth for the foreign-born population - South Africa (%)
Place of birth for the foreign-born population - Other Southern Africa (%)
Place of birth for the foreign-born population - Cabo Verde (%)
Place of birth for the foreign-born population - Ghana (%)
Place of birth for the foreign-born population - Liberia (%)
Place of birth for the foreign-born population - Nigeria (%)
Place of birth for the foreign-born population - Senegal (%)
Place of birth for the foreign-born population - Sierra Leone (%)
Place of birth for the foreign-born population - Other Western Africa (%)
Place of birth for the foreign-born population - Australia (%)
Place of birth for the foreign-born population - New Zealand (%)
Place of birth for the foreign-born population - Fiji (%)
Place of birth for the foreign-born population - Micronesia (%)
Place of birth for the foreign-born population - Bahamas (%)
Place of birth for the foreign-born population - Barbados (%)
Place of birth for the foreign-born population - Cuba (%)
Place of birth for the foreign-born population - Dominica (%)
Place of birth for the foreign-born population - Dominican Republic (%)
Place of birth for the foreign-born population - Grenada (%)
Place of birth for the foreign-born population - Haiti (%)
Place of birth for the foreign-born population - Jamaica (%)
Place of birth for the foreign-born population - St. Vincent and the Grenadines (%)
Place of birth for the foreign-born population - Trinidad and Tobago (%)
Place of birth for the foreign-born population - West Indies (%)
Place of birth for the foreign-born population - Other Caribbean (%)
Place of birth for the foreign-born population - Belize (%)
Place of birth for the foreign-born population - Costa Rica (%)
Place of birth for the foreign-born population - El Salvador (%)
Place of birth for the foreign-born population - Guatemala (%)
Place of birth for the foreign-born population - Honduras (%)
Place of birth for the foreign-born population - Mexico (%)
Place of birth for the foreign-born population - Nicaragua (%)
Place of birth for the foreign-born population - Panama (%)
Place of birth for the foreign-born population - Other Central America (%)
Place of birth for the foreign-born population - Argentina (%)
Place of birth for the foreign-born population - Bolivia (%)
Place of birth for the foreign-born population - Brazil (%)
Place of birth for the foreign-born population - Chile (%)
Place of birth for the foreign-born population - Colombia (%)
Place of birth for the foreign-born population - Ecuador (%)
Place of birth for the foreign-born population - Guyana (%)
Place of birth for the foreign-born population - Peru (%)
Place of birth for the foreign-born population - Uruguay (%)
Place of birth for the foreign-born population - Venezuela (%)
Place of birth for the foreign-born population - Other South America (%)
Place of birth for the foreign-born population - Canada (%)
Place of birth for the foreign-born population - Other Northern America (%)
Place of birth for the foreign-born population - Other (%)
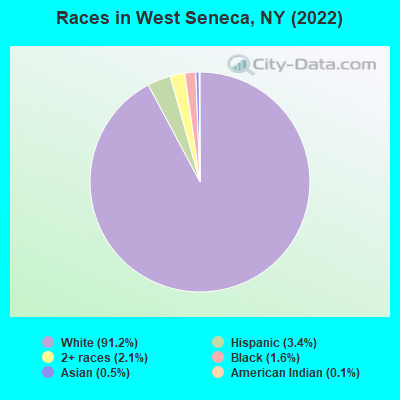
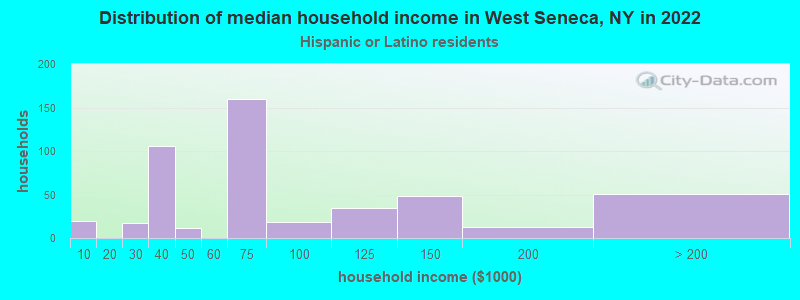
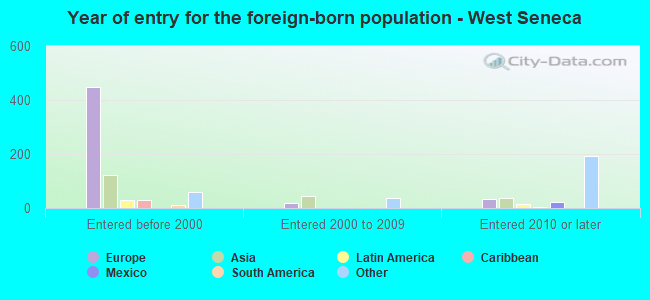
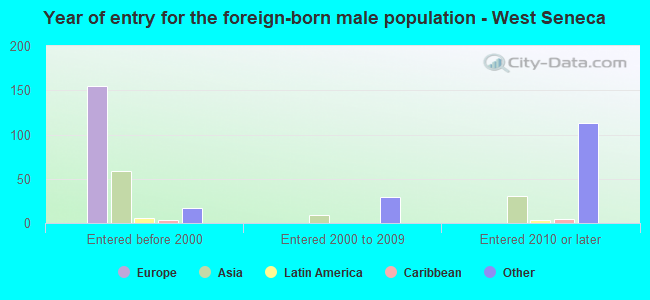
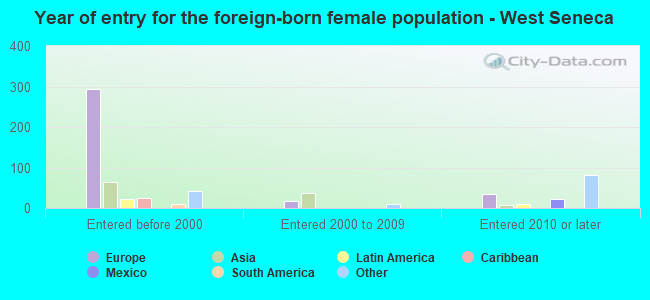
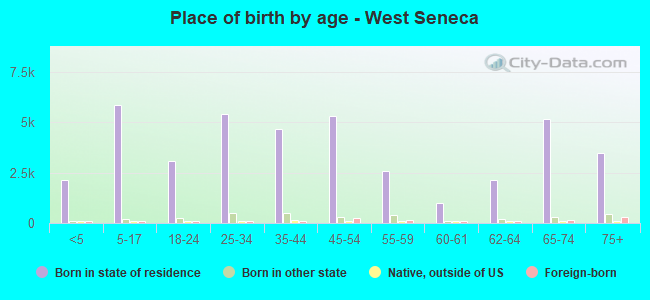
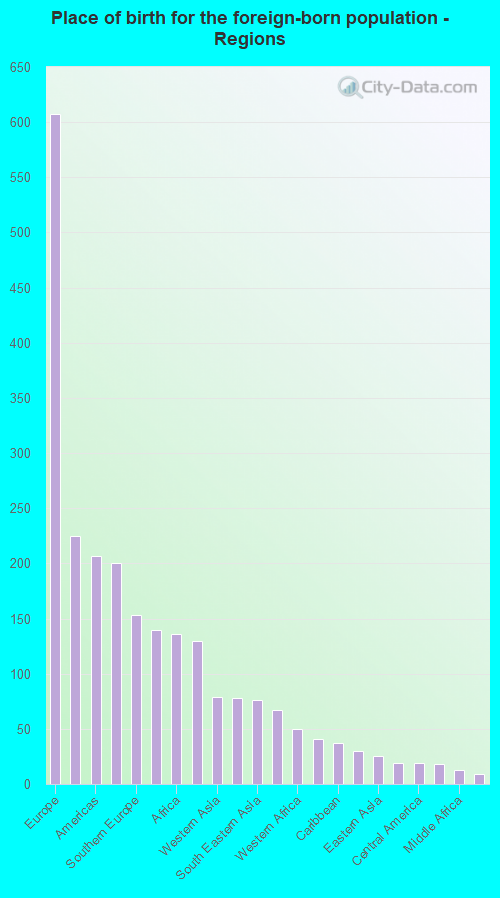
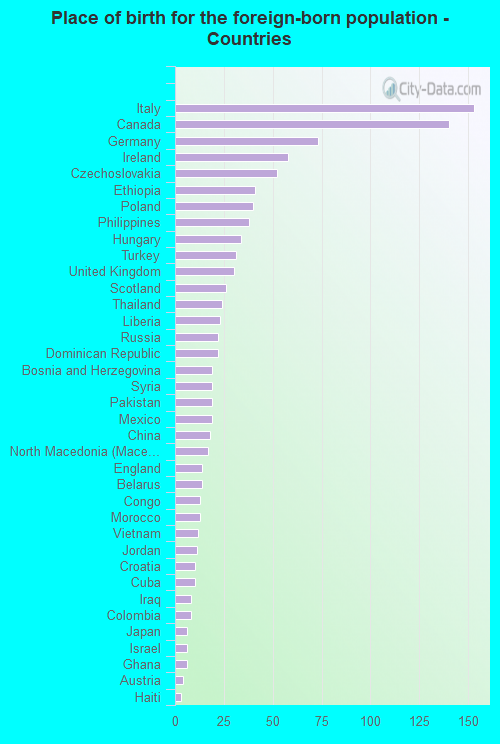
According to 2022 data, the most numerous races in West Seneca, NY are White alone (41,359 residents), Hispanic (1,539 residents), and Black alone (729 residents). 95.2% of West Seneca residents speak English at home. 2.5% of West Seneca, NY residents are foreign-born (1.4% born in Europe, 0.4% born in Asia, 0.3% born in North America, 0.3% born in Africa), which is 765.9% less than the foreign-born rate of 22.0% across the entire state of New York.
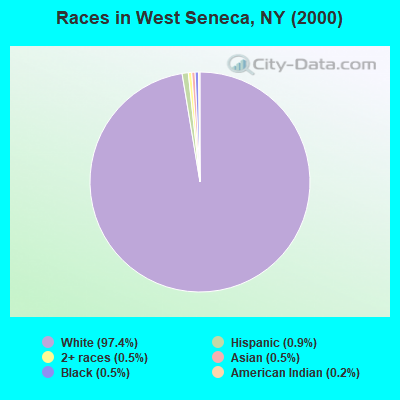
Race distribution in West Seneca
2000 2022
11,760,981 62.0% White alone 2,867,583 15.1% Hispanic 2,812,623 14.8% Black alone 1,035,926 5.5% Asian alone 366,116 1.9% Two or more races 75,499 0.4% Other race alone 52,499 0.3% American Indian alone 5,230 0.03% Native Hawaiian and Other
10,408,933 52.9% White alone 3,867,299 19.7% Hispanic 2,633,840 13.4% Black alone 1,776,286 9.0% Asian alone 732,670 3.7% Two or more races 216,110 1.1% Other race alone 35,082 0.2% American Indian alone 6,931 0.04% Native Hawaiian and Other
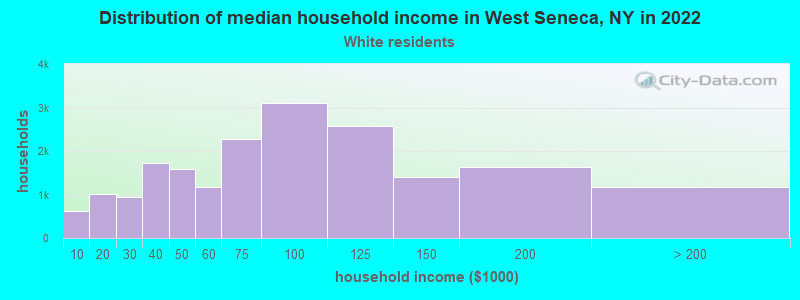
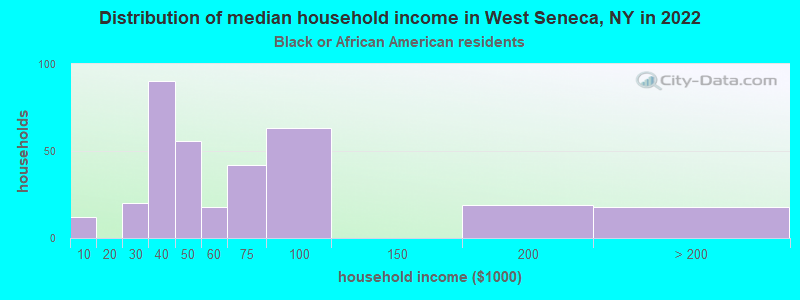
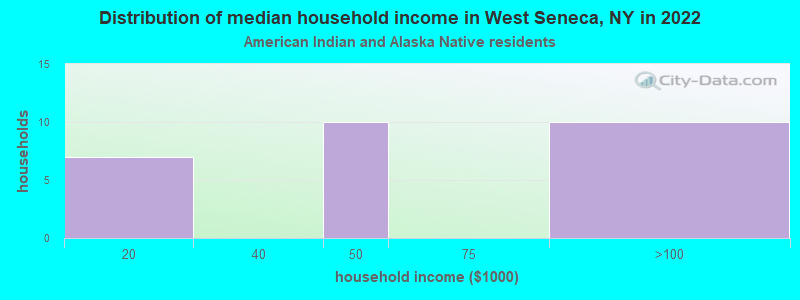
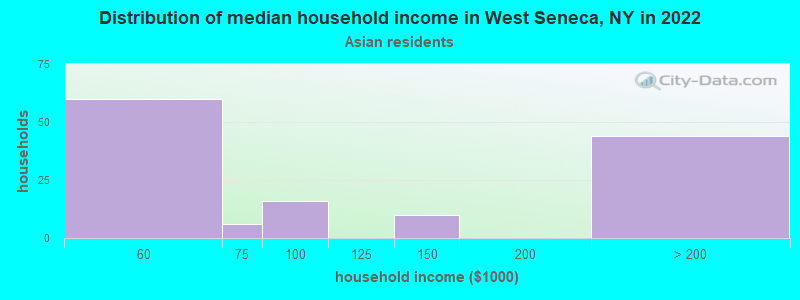
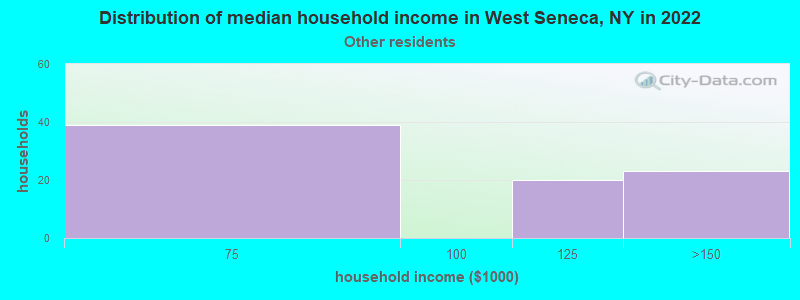
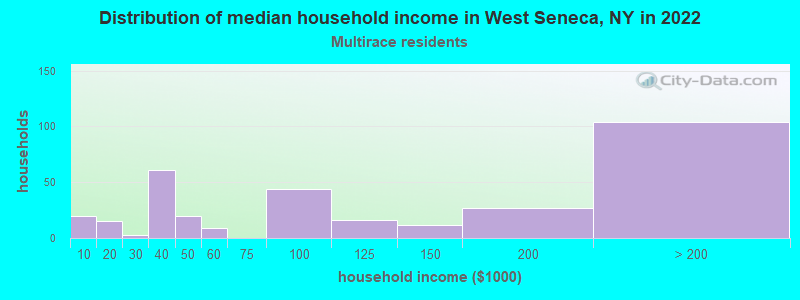
Income and house value in West Seneca Median household income in 2022 $77,298 White non-Hispanic householders$49,239 Black householders$67,006 American Indian and Alaska Native householdersover $200,000 Some other race householders$90,084 Hispanic or Latino race householdersMedian 2022 house value $228,112 White Non-Hispanic householders$293,596 Black or African American householders$269,849 American Indian or Alaska Native householders $486,449 Asian householders$187,335 Some other race householders$243,704 Two or more races householders$206,524 Hispanic or Latino householders
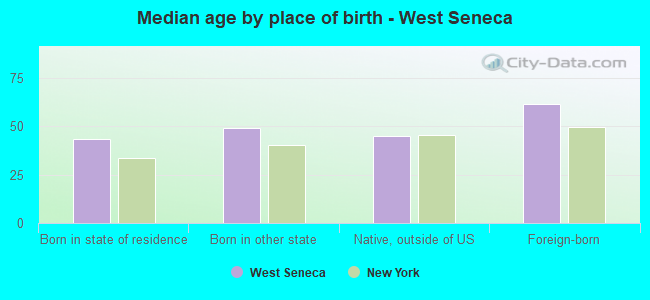
Median age by race in West Seneca
46.1 Median age for White residents44.9 47.3 27.0 Median age for Black or African American residents26.6 33.9 47.4 Median age for American Indian / Alaska Native residents-364,583,333.0 48.9 49.9 Median age for Asian residents77.1 49.7 -700,534,758.7 Median age for Native Hawaiian / Pacific Islander residents-477,502,295.2 -497,387,669.3 39.2 Median age for Other race residents33.4 38.0 25.4 Median age for Two or more races residents38.1 16.8 46.4 Median age for White alone residents44.9 48.3 30.2 Median age for Hispanic or Latino residents30.8 31.6
Owner/renter occupied households by race in West Seneca
House owners and renters - White residents 15,122 78.4% Owner occupied4,165 21.6% Renter occupiedHouse owners and renters - Black or African American residents 53 16.3% Owner occupied269 83.7% Renter occupiedHouse owners and renters - American Indian / Alaska Native residents 8 26.4% Owner occupied21 73.6% Renter occupiedHouse owners and renters - Asian residents 103 85.7% Owner occupied17 14.3% Renter occupiedHouse owners and renters - Other race residents 47 59.2% Owner occupied32 40.8% Renter occupiedHouse owners and renters - Two or more races residents 253 78.9% Owner occupied68 21.1% Renter occupiedHouse owners and renters - White alone residents 14,954 78.5% Owner occupied4,101 21.5% Renter occupiedHouse owners and renters - Hispanic or Latino residents 227 55.2% Owner occupied184 44.8% Renter occupied
Language usage in West Seneca
English speakers - Total 95.2% of residents of West Seneca speak English at home.
1.7% of residents speak Spanish at home 555 77.8% Speak English very well158 22.2% Speak English less than very well3.0% of residents speak other language at home 992 76.3% Speak English very well308 23.7% Speak English less than very well
English speakers - Born in the United States 98.4% of residents of West Seneca speak English at home.
1.3% of residents speak Spanish at home 42 100.0% Speak English very well0.4% of residents speak other language at home 12 100.0% Speak English very well
English speakers - Native, born elsewhere 39.6% of residents of West Seneca speak English at home.
44.2% of residents speak Spanish at home 108 67.1% Speak English very well53 32.9% Speak English less than very well15.7% of residents speak other language at home 38 66.7% Speak English very well19 33.3% Speak English less than very well
English speakers - Foreign-born 32.0% of residents of West Seneca speak English at home.
3.0% of residents speak Spanish at home 28 82.4% Speak English very well6 17.6% Speak English less than very well58.0% of residents speak other language at home 408 62.8% Speak English very well242 37.2% Speak English less than very well
White (Caucasian) - Speak only English Native:
98.1% (38,471)Foreign-born:
39.4% (314)
White (Caucasian) - Speak another language Native:
2.0% (785)Foreign-born:
55.1% (438)
Black or African American - Speak only English Native:
85.7% (542)Foreign-born:
15.5% (17)
Black or African American - Speak another language Native:
15.2% (96)Foreign-born:
89.7% (97)
Asian - Speak only English Native:
88.4% (69)Foreign-born:
15.9% (21)
Asian - Speak another language Native:
9.8% (8)Foreign-born:
81.1% (108)
Other race - Speak another language Native:
34.3% (125)Foreign-born:
91.7% (14)
Two or more races - Speak only English Native:
79.3% (1,001)Foreign-born:
38.6% (7)
Two or more races - Speak another language Native:
20.4% (258)Foreign-born:
62.9% (11)
White alone - Speak only English Native:
97.8% (37,888)Foreign-born:
40.8% (327)
White alone - Speak another language Native:
2.2% (866)Foreign-born:
54.2% (435)
Hispanic or Latino - Speak only English Native:
89.4% (1,340)Foreign-born:
8.8% (4)
Hispanic or Latino - Speak another language Native:
18.1% (270)Foreign-born:
93.7% (42)
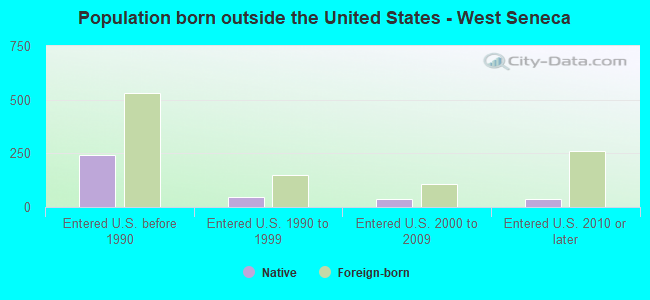
Foreign-born residents in West Seneca 1,152 residents are foreign born (1.4% Europe , 0.4% Asia , 0.3% North America , 0.3% Africa ).
This city:
2.5%New York:
22.6%
Marital status for residents in West Seneca Marital status - White (Caucasian) population 15 years and over
Males 36.9% Never married49.4% Now married1.1% Separated4.2% Widowed8.4% DivorcedFemales 31.8% Never married44.4% Now married1.0% Separated12.4% Widowed10.3% DivorcedWomen who gave birth in the past 12 months Now married:
74.7% (360)Unmarried:
25.3% (122)
Women who did not give birth in the past 12 months Now married:
37.3% (3,040)Unmarried:
62.7% (5,116)
Marital status - Black or African American population 15 years and over
Males 51.8% Never married33.8% Now married0.0% Separated14.4% Widowed0.0% DivorcedFemales 46.5% Never married30.0% Now married0.0% Separated0.0% Widowed23.5% DivorcedWomen who gave birth in the past 12 months Now married:
100.0% (64)Unmarried:
0.0% (0)
Women who did not give birth in the past 12 months Now married:
8.7% (11)Unmarried:
91.3% (118)
Marital status - American Indian / Alaska Native population 15 years and over
Males 50.0% Never married50.0% Now married0.0% Separated0.0% Widowed0.0% DivorcedFemales 57.1% Never married17.9% Now married0.0% Separated0.0% Widowed25.0% DivorcedWomen who gave birth in the past 12 months Now married:
0.0% (0)Unmarried:
100.0% (7)
Women who did not give birth in the past 12 months Now married:
0.0% (0)Unmarried:
100.0% (16)
Marital status - Asian population 15 years and over
Males 15.0% Never married85.0% Now married0.0% Separated0.0% Widowed0.0% DivorcedFemales 4.8% Never married84.8% Now married0.0% Separated10.4% Widowed0.0% DivorcedWomen who did not give birth in the past 12 months Now married:
76.2% (67)Unmarried:
23.8% (21)
Marital status - Other race population 15 years and over
Males 36.3% Never married39.3% Now married24.4% Separated0.0% Widowed0.0% DivorcedFemales 23.7% Never married63.3% Now married11.2% Separated1.8% Widowed0.0% DivorcedWomen who did not give birth in the past 12 months Now married:
73.2% (120)Unmarried:
26.8% (44)
Marital status - Two or more races population 15 years and over
Males 39.2% Never married57.0% Now married0.0% Separated0.0% Widowed3.8% DivorcedFemales 65.6% Never married22.0% Now married0.0% Separated0.0% Widowed12.4% DivorcedWomen who gave birth in the past 12 months Now married:
100.0% (10)Unmarried:
0.0% (0)
Women who did not give birth in the past 12 months Now married:
10.3% (40)Unmarried:
89.7% (347)
Marital status - White alone, not Hispanic / Latino population 15 years and over
Males 36.7% Never married49.6% Now married0.9% Separated4.2% Widowed8.5% DivorcedFemales 31.8% Never married44.4% Now married1.0% Separated12.6% Widowed10.2% DivorcedWomen who gave birth in the past 12 months Now married:
74.7% (360)Unmarried:
25.3% (122)
Women who did not give birth in the past 12 months Now married:
36.8% (2,935)Unmarried:
63.2% (5,036)
Marital status - Hispanic or Latino population 15 years and over
Males 47.5% Never married38.8% Now married13.7% Separated0.0% Widowed0.0% DivorcedFemales 41.8% Never married43.0% Now married3.4% Separated0.5% Widowed11.3% DivorcedWomen who did not give birth in the past 12 months Now married:
49.3% (244)Unmarried:
50.7% (251)
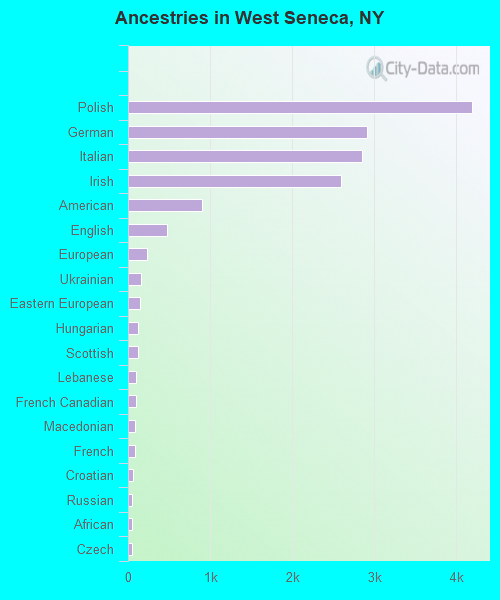
Ancestries in West Seneca
4,189 23.9% Polish2,915 16.6% German2,849 16.3% Italian2,592 14.8% Irish904 5.2% American476 2.7% English229 1.3% European153 0.9% Ukrainian147 0.8% Eastern European127 0.7% Hungarian125 0.7% Scottish102 0.6% Lebanese96 0.5% French Canadian84 0.5% Macedonian83 0.5% French55 0.3% Croatian52 0.3% Russian48 0.3% African43 0.2% Czech31 0.2% Palestinian29 0.2% Arab29 0.2% Swiss27 0.2% British24 0.1% Canadian21 0.1% Scotch-Irish19 0.1% Danish17 0.10% Turkish15 0.09% Welsh12 0.07% Greek11 0.06% Pennsylvania German11 0.06% Slavic10 0.06% Dutch8 0.05% Swedish7 0.04% Czechoslovakian
Geographical mobility in West Seneca Same house 1 year ago 38,842 94.0% White (Caucasian)701 84.0% Black or African American48 86.2% American Indian / Alaska Native207 99.2% Asian3 89.7% Native Hawaiian / Pacific Islander364 96.7% Other race1,335 96.9% Two or more races38,412 93.9% White alone, not Hispanic / Latino1,518 98.7% Hispanic or LatinoMoved within same county 1,852 4.5% White / Caucasian94 11.2% Black or African American49 3.6% Two or more races1,866 4.6% White alone, not Hispanic / Latino18 1.2% Hispanic or LatinoMoved within same state 464 1.1% White / Caucasian9 15.6% American Indian / Alaska Native29 7.7% Other race15 1.1% Two or more races454 1.1% White alone, not Hispanic / Latino32 2.1% Hispanic or LatinoMoved from different state 170 0.4% White / Caucasian58 7.0% Black or African American11 5.2% Asian19 5.0% Other race11 0.8% Two or more races175 0.4% White alone, not Hispanic / Latino34 2.2% Hispanic or LatinoMoved from abroad 53 0.1% White61 0.1% White alone, not Hispanic / Latino
Children Nativity (place of birth) in West Seneca
Children under 6 years - Living with two parents Both parents native 1,802 100.0% NativeBoth parents foreign-born 20 100.0% NativeOne native, one foreign-born parent 168 100.0% NativeChildren under 6 years - Living with one parent Native parent 711 100.0% NativeChildren 6 to 17 years - Living with two parents Both parents native 3,301 100.0% NativeBoth parents foreign-born 29 100.0% NativeOne native, one foreign-born parent 210 100.0% NativeChildren 6 to 17 years - Living with one parent Native parent 1,650 100.0% NativeForeign-born parent 70 57.4% Native52 42.6% Foreign-born
Grandparents responsible for own grandchildren in West Seneca
Grandparents (30 to 59 years) White / Caucasian 65 50.2% Responsible for grandchildren65 49.8% Not responsible for grandchildrenTwo or more races 12 100.0% Responsible for grandchildrenWhite alone, not Hispanic / Latino 64 48.7% Responsible for grandchildren67 51.3% Not responsible for grandchildrenGrandparents (60 years and over) White / Caucasian 27 19.4% Responsible for grandchildren113 80.6% Not responsible for grandchildrenTwo or more races 11 100.0% Not responsible for grandchildrenWhite alone, not Hispanic / Latino 28 20.1% Responsible for grandchildren111 79.9% Not responsible for grandchildren