Housing density: 13,707 houses/condos per square mile
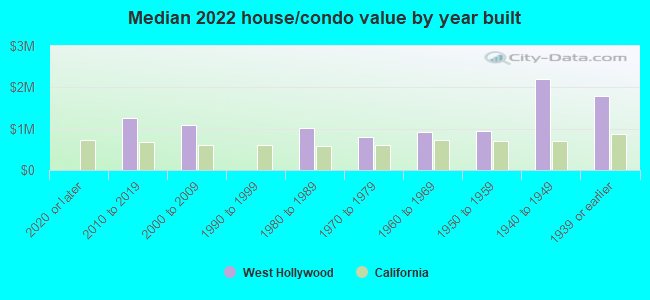
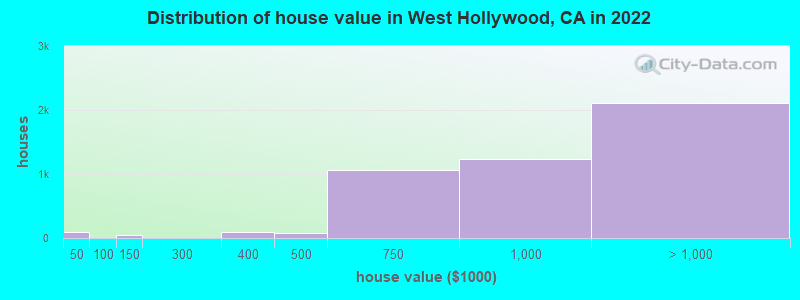
Median price asked for vacant for-sale houses and condos in 2022: $1,919,926.
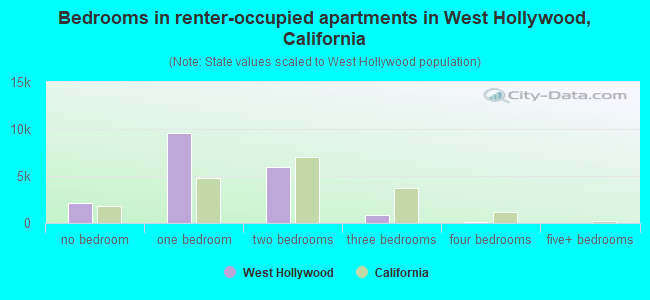
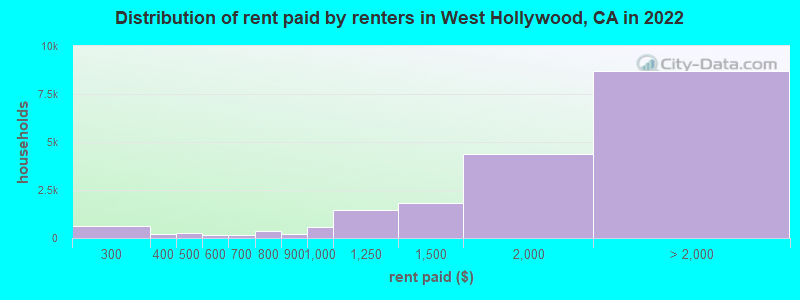
Median contract rent in 2022: $1,904 (lower quartile is $1,323, upper quartile is over $2,000)
Median rent asked for vacant for-rent units in 2022: $2,402
Median gross rent in West Hollywood, CA in 2022: $1,969
Housing units in West Hollywood with a mortgage: 3,184 (261 second mortgage, 0 home equity loan, 258 both second mortgage and home equity loan) Houses without a mortgage: 0
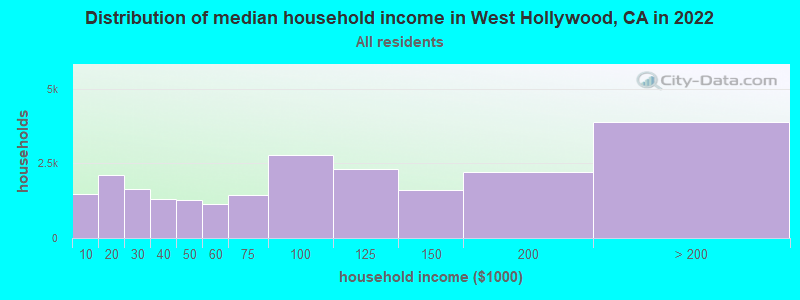
Median household income for houses/condos with a mortgage: $152,761
Median household income for apartments without a mortgage: $77,911
Median monthly housing costs: $2,076
Compare current foreclosures in West Hollywood, CA:
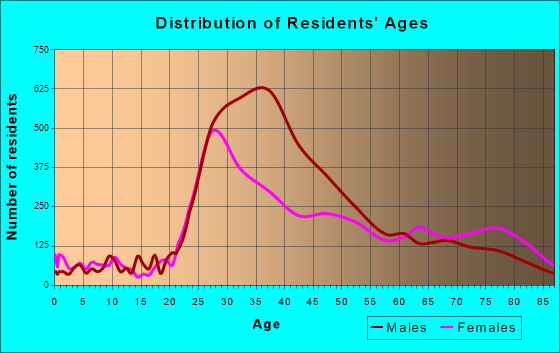
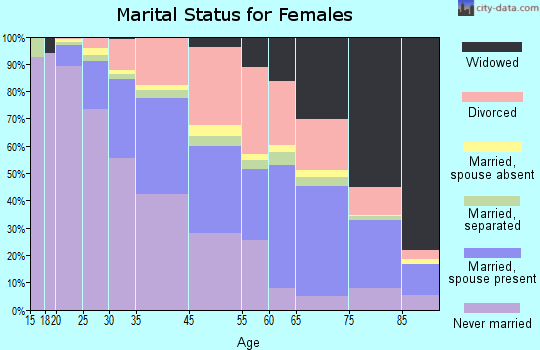
888 married couples with children.
398 single-parent households (52 men, 346 women).
73.7% of residents of West Hollywood speak English at home.
9.1% of residents speak Spanish at home (79% speak English very well, 17% speak English well, 2% speak English not well, 1% don't speak English at all).
12.3% of residents speak other Indo-European language at home (50% speak English very well, 23% speak English well, 21% speak English not well, 6% don't speak English at all).
3.3% of residents speak Asian or Pacific Island language at home (71% speak English very well, 15% speak English well, 10% speak English not well, 4% don't speak English at all).
2.1% of residents speak other language at home (80% speak English very well, 17% speak English well, 3% speak English not well).
Foreign born population: 8,163 (23.6%)
(66.4% of them are naturalized citizens)
Percentage of workers working in this county: 98.1% Number of people working at home: 6,992 (29.4% of all workers)
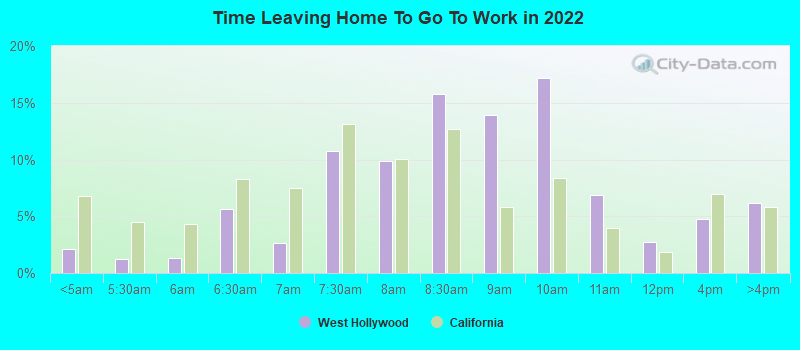
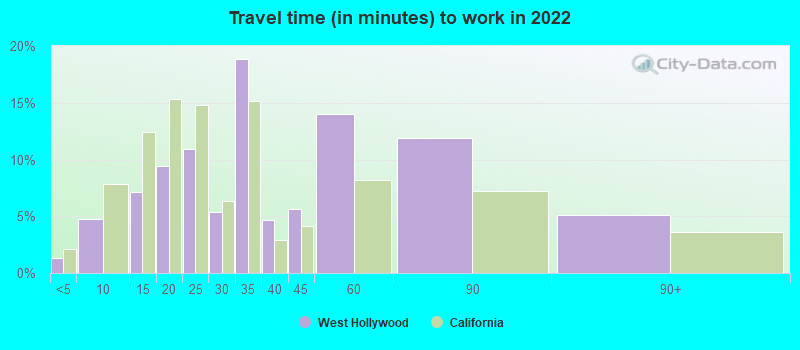
Travel time to work (commute)
Less than 5 minutes: 389
5 to 9 minutes: 1,195
10 to 14 minutes: 2,020
15 to 19 minutes: 2,396
20 to 24 minutes: 2,305
25 to 29 minutes: 1,295
30 to 34 minutes: 3,715
35 to 39 minutes: 931
40 to 44 minutes: 707
45 to 59 minutes: 1,692
60 to 89 minutes: 903
90 or more minutes: 176
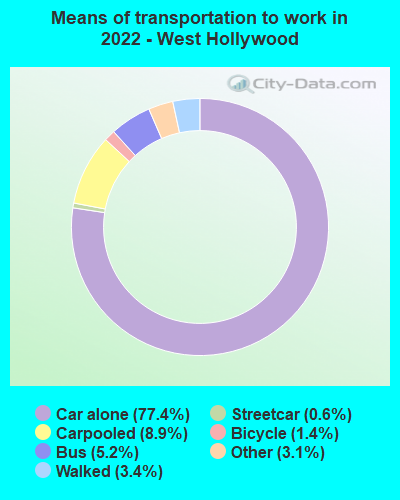
Means of transportation to work:
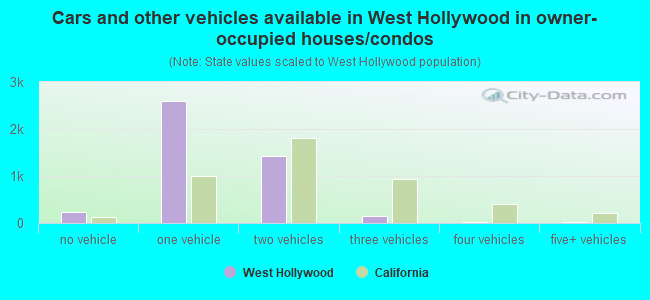
Drove a car alone: 22,055 (62.2%)
Carpooled: 2,796 (7.9%)
Bus: 1,335 (3.8%)
Subway or elevated rail: 132 (0.4%)
Long-distance train or commuter rail: 8 (0.0%)
Light rail, streetcar or trolley: 11 (0.0%)
Taxi: 953 (2.7%)
Bicycle: 403 (1.1%)
Walked: 1,049 (3.0%)
Worked at home: 6,992 (19.7%)
Unemployment by race in 2022
Unemployment rate for White non-Hispanic residents
7.0%Males
6.7%Females
Unemployment rate for Black residents
5.8%Males
13.1%Females
Unemployment rate for American Indian and Alaska Native residents
25.2%Females
Unemployment rate for Asian residents
3.7%Males
5.0%Females
Unemployment rate for other race residents
4.8%Males
3.4%Females
Unemployment rate for two or more race residents
6.0%Males
Unemployment rate for Hispanic or Latino residents
8.0%Males
7.3%Females
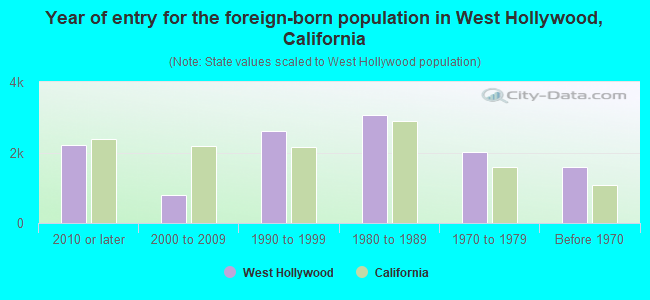
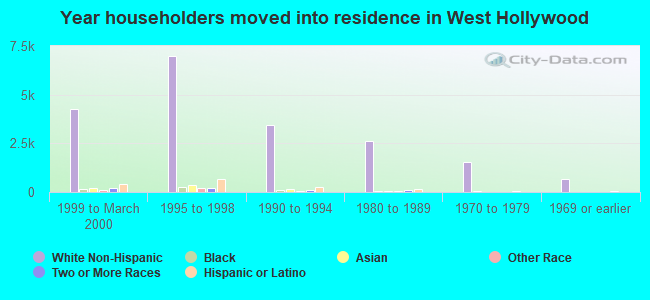
Year of entry for the foreign-born population in West Hollywood, California
2,2032010 or later
8072000 to 2009
2,6161990 to 1999
3,0781980 to 1989
2,0151970 to 1979
1,600Before 1970
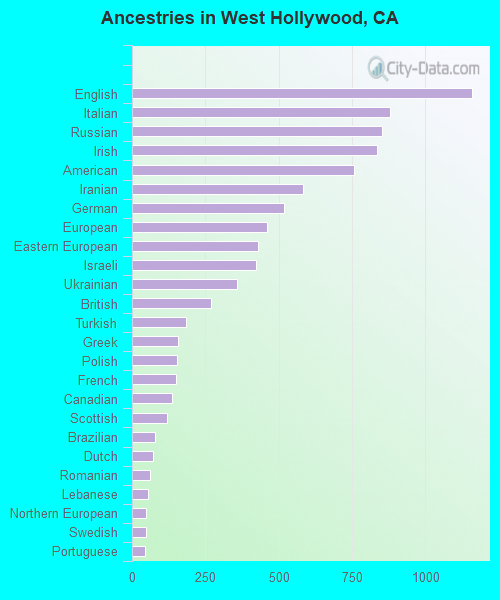
First ancestries reported:
English: 1,160 (7.6%)
Italian: 881 (5.8%)
Russian: 854 (5.6%)
Irish: 837 (5.5%)
American: 759 (5.0%)
Iranian: 585 (3.8%)
German: 518 (3.4%)
European: 461 (3.0%)
Eastern European: 430 (2.8%)
Israeli: 424 (2.8%)
Ukrainian: 358 (2.3%)
British: 271 (1.8%)
Turkish: 183 (1.2%)
Greek: 157 (1.0%)
Polish: 152 (1.0%)
French: 150 (1.0%)
Canadian: 136 (0.9%)
Scottish: 119 (0.8%)
Brazilian: 79 (0.5%)
Dutch: 73 (0.5%)
Romanian: 62 (0.4%)
Lebanese: 55 (0.4%)
Northern European: 48 (0.3%)
Swedish: 48 (0.3%)
Portuguese: 44 (0.3%)
Scotch-Irish: 40 (0.3%)
Slovak: 37 (0.2%)
French Canadian: 36 (0.2%)
Hungarian: 36 (0.2%)
Austrian: 34 (0.2%)
Armenian: 33 (0.2%)
Macedonian: 20 (0.1%)
Danish: 19 (0.1%)
Nigerian: 19 (0.1%)
Lithuanian: 18 (0.1%)
Norwegian: 18 (0.1%)
Jamaican: 16 (0.1%)
Czech: 16 (0.1%)
Ugandan: 15 (0.10%)
Egyptian: 14 (0.09%)
African: 14 (0.09%)
Finnish: 12 (0.08%)
Bulgarian: 10 (0.07%)
Australian: 9 (0.06%)
Swiss: 7 (0.05%)
Serbian: 7 (0.05%)
Liberian: 5 (0.03%)
Most common places of birth for foreign-born residents (%):
Russia
West Hollywood:
11.7% (953)
California:
0.7% (71,932)
Ukraine
West Hollywood:
10.4% (852)
California:
0.6% (60,761)
Iran
West Hollywood:
5.7% (468)
California:
2.0% (206,004)
Guatemala
West Hollywood:
5.6% (457)
California:
2.8% (290,436)
Canada
West Hollywood:
5.5% (452)
California:
1.2% (127,477)
Israel
West Hollywood:
5.1% (413)
California:
0.3% (33,029)
Mexico
West Hollywood:
4.0% (330)
California:
37.2% (3,881,193)
England
West Hollywood:
3.8% (312)
California:
0.6% (57,953)
Australia
West Hollywood:
3.6% (290)
California:
0.2% (23,338)
Philippines
West Hollywood:
3.2% (265)
California:
7.8% (818,297)
Spain
West Hollywood:
3.0% (246)
California:
0.2% (16,586)
Germany
West Hollywood:
2.4% (193)
California:
0.7% (73,304)
Other Eastern Europe
West Hollywood:
2.0% (166)
California:
0.2% (17,699)
China, excluding Hong Kong and Taiwan
West Hollywood:
2.0% (160)
California:
6.6% (684,672)
Turkey
West Hollywood:
1.8% (148)
California:
0.2% (20,474)
United Kingdom, excluding England and Scotland
West Hollywood:
1.8% (144)
California:
0.6% (60,582)
Korea
West Hollywood:
1.7% (142)
California:
3.0% (315,248)
Uzbekistan
West Hollywood:
1.7% (139)
California:
0.1% (5,897)
France
West Hollywood:
1.6% (134)
California:
0.4% (40,224)
Colombia
West Hollywood:
1.6% (129)
California:
0.5% (55,249)
Place of birth for U.S.-born residents:
This state: 10,640
Other state: 15,181
Northeast: 4,919
Midwest: 4,015
South: 4,552
West: 1,752
82.2% of West Hollywood residents lived in the same house 1 years ago. Out of people who lived in different houses, 36.7% lived in this county. Out of people who lived in different counties, 30.9% lived in California.
West Hollywood:
82.2%
State average:
88.9%
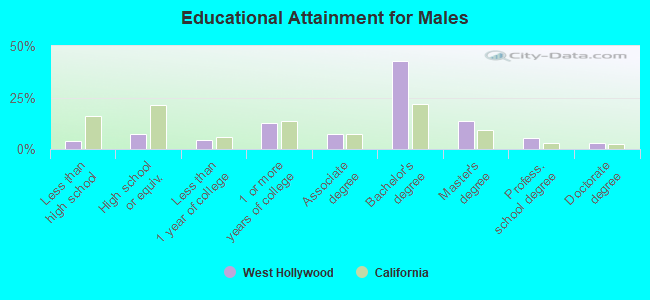
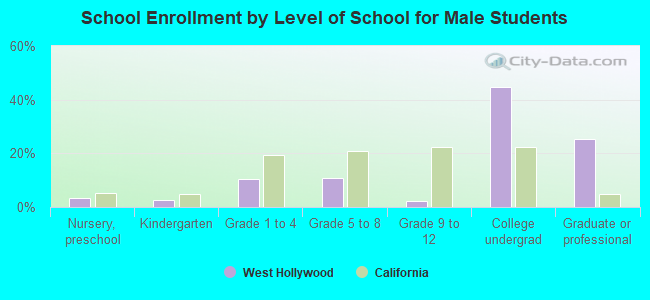
Education attainment for males 25 years and older:
No schooling: 188
Nursery to 4th grade: 2
5th and 6th grade: 200
7th and 8th grade: 17
9th grade: 0
10th grade: 47
11th grade: 30
12th grade, no diploma: 237
High school graduate (or equivalency): 1,395
Less than 1 year of college: 786
Some college more than 1 year, no degree: 2,357
Associate degree: 1,356
Bachelor's degree: 7,989
Master's degree: 2,504
Professional school degree: 1,020
Doctorate degree: 499
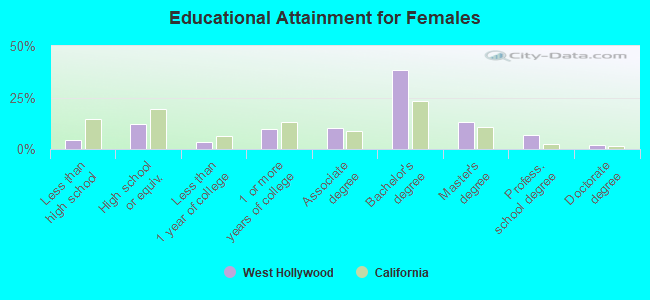
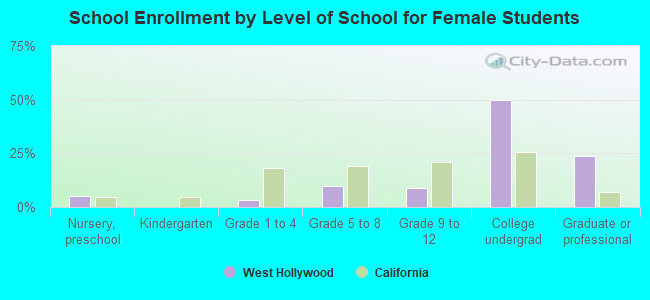
Education attainment for females 25 years and older:
No schooling: 140
Nursery to 4th grade: 167
5th and 6th grade: 16
7th and 8th grade: 0
9th grade: 12
10th grade: 0
11th grade: 16
12th grade, no diploma: 226
High school graduate (or equivalency): 1,637
Less than 1 year of college: 448
Some college more than 1 year, no degree: 1,290
Associate degree: 1,387
Bachelor's degree: 5,111
Master's degree: 1,768
Professional school degree: 881
Doctorate degree: 270
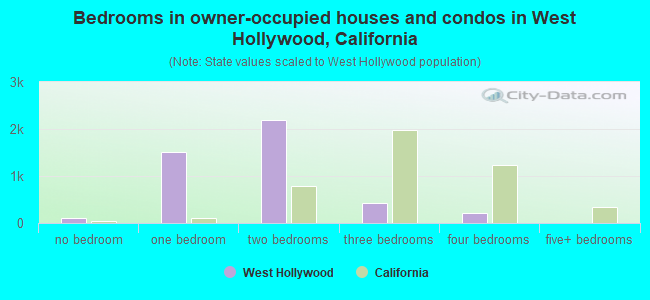
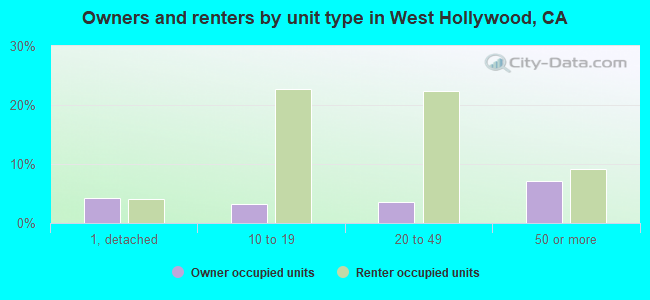
Housing units in structures:
One, detached: 2,382
One, attached: 600
Two: 999
3 or 4: 1,089
5 to 9: 4,722
10 to 19: 5,428
20 to 49: 5,199
50 or more: 5,323
Mobile homes: 29
Housing units lacking complete plumbing facilities in 2022: 0.5%
Housing units lacking complete kitchen facilities in 2022: 1.2%