West Covina, CA (California) Houses and Residents
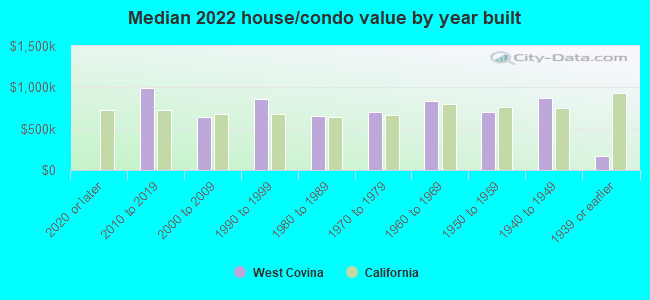
| West Covina: | $721,800 |
| California: | $715,900 |
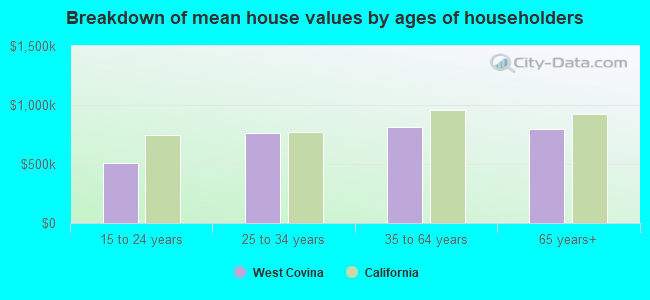
Mean price in 2022:
Detached houses: $831,424
Here: $831,424 State: $988,808 Townhouses or other attached units: $555,680
Here: $555,680 State: $838,546 In 3-to-4-unit structures: $438,077
Here: $438,077 State: $824,253 In 5-or-more-unit structures: $763,220
Here: $763,220 State: $730,996 Mobile homes: $98,566
Here: $98,566 State: $184,506
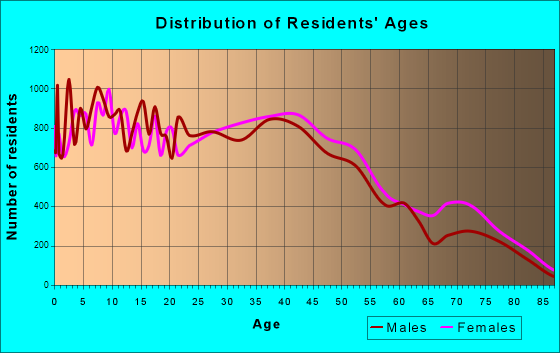
Total population: 108,455 (Urban population: 104,893, Rural population: 0)
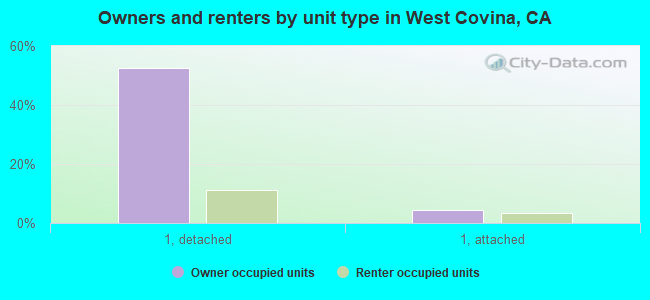
Houses: 35,198 (34,104 occupied: 19,555 owner occupied, 14,549 renter occupied)
| % of renters here: | 43% |
| State: | 44% |
Housing density: 2,186 houses/condos per square mile
Median price asked for vacant for-sale houses and condos in 2022: $885,259.
Median contract rent in 2022: $1,882 (lower quartile is $1,538, upper quartile is over $2,000)
Median rent asked for vacant for-rent units in 2022: $1,990
Median gross rent in West Covina, CA in 2022: over $2,000
Housing units in West Covina with a mortgage: 13,580 (977 second mortgage, 0 home equity loan, 606 both second mortgage and home equity loan)
Houses without a mortgage: 554
Median household income for houses/condos with a mortgage: $112,446
Median household income for apartments without a mortgage: $78,924
Median monthly housing costs: $2,028
Compare current foreclosures in West Covina, CA:
| Photo | Address | Area | Beds / Baths | Price | Details |
|---|---|---|---|---|---|

|
#1
E Norma Ave
West Covina, CA 91791
|
1,134 sq. feet
|
2 baths 3 beds |
$599,000
|
show details |

|
#2
E Holton St
West Covina, CA 91791
|
- sq. feet
|
2 baths 3 beds |
$450,000
|
show details |

|
#3
Maine St
West Covina, CA 91792
|
710 sq. feet
|
1 baths 1 beds |
show details | |

|
#4
S Dancove Dr
West Covina, CA 91791
|
1,956 sq. feet
|
3 baths 3 beds |
show details | |

|
#5
N Myrtlewood Ave
West Covina, CA 91791
|
1,854 sq. feet
|
3 baths 3 beds |
show details | |

|
#6
Main St.
West Covina, CA 91790
|
- sq. feet
|
- baths - beds |
$575,000
|
show details |

|
#7
N Morada Ave
West Covina, CA 91790
|
1,144 sq. feet
|
1 baths 3 beds |
show details | |

|
#8
S Sunset Ave
West Covina, CA 91790
|
1,204 sq. feet
|
3 baths 6 beds |
show details | |

|
#9
E Hilltonia Dr
West Covina, CA 91792
|
1,712 sq. feet
|
3 baths 4 beds |
show details | |

|
#10
E Rowland Ave
West Covina, CA 91790
|
1,696 sq. feet
|
2 baths 3 beds |
show details |
| Photo | Address | Area | Beds / Baths | Price | Details |
|---|---|---|---|---|---|

|
#11
S Morganfield Ave
West Covina, CA 91792
|
1,302 sq. feet
|
2 baths 4 beds |
show details | |

|
#12
E Marlena St
West Covina, CA 91792
|
1,579 sq. feet
|
2 baths 4 beds |
show details | |

|
#13
E Holt Ave
West Covina, CA 91791
|
1,886 sq. feet
|
2 baths 3 beds |
show details | |

|
#14
N Myrtlewood Ave
West Covina, CA 91791
|
1,854 sq. feet
|
3 baths 3 beds |
show details | |

|
#15
W Farlington St
West Covina, CA 91790
|
1,290 sq. feet
|
2 baths 3 beds |
show details | |

|
#16
N Caroline St
West Covina, CA 91791
|
2,111 sq. feet
|
2 baths 3 beds |
show details | |

|
#17
Calle Parral
West Covina, CA 91792
|
1,234 sq. feet
|
2 baths 2 beds |
show details | |

|
#18
S Hollenbeck St
West Covina, CA 91791
|
2,008 sq. feet
|
2 baths 4 beds |
show details | |

|
#19
E Aroma Dr
West Covina, CA 91791
|
1,040 sq. feet
|
2 baths 2 beds |
show details | |

|
#20
Atoll
West Covina, CA 91790
|
1,380 sq. feet
|
3 baths 3 beds |
show details |
| Photo | Address | Area | Beds / Baths | Price | Details |
|---|---|---|---|---|---|

|
#21
S Bromley Ave
West Covina, CA 91790
|
1,088 sq. feet
|
2 baths 3 beds |
show details | |

|
#22
S Valinda Ave
West Covina, CA 91790
|
1,898 sq. feet
|
3 baths 4 beds |
show details | |

|
#23
E Herring Ave
West Covina, CA 91790
|
1,273 sq. feet
|
2 baths 2 beds |
show details | |

|
#24
S Sharonlee Dr
West Covina, CA 91790
|
917 sq. feet
|
1 baths 2 beds |
show details | |

|
#25
S Broadmoor Ave
West Covina, CA 91790
|
1,451 sq. feet
|
2 baths 3 beds |
show details | |

|
#26
S Evanwood Ave
West Covina, CA 91790
|
1,490 sq. feet
|
2 baths 3 beds |
show details | |

|
#27
N Eileen Ave
West Covina, CA 91791
|
1,602 sq. feet
|
2 baths 3 beds |
show details | |

|
#28
N Bromley Ave
West Covina, CA 91790
|
2,264 sq. feet
|
3 baths 4 beds |
show details | |

|
#29
N Morada Ave
West Covina, CA 91790
|
1,144 sq. feet
|
1 baths 3 beds |
show details | |

|
#30
E Aroma Dr
West Covina, CA 91791
|
968 sq. feet
|
1 baths 2 beds |
show details |
| Photo | Address | Area | Beds / Baths | Price | Details |
|---|---|---|---|---|---|

|
#31
Gemini St
West Covina, CA 91792
|
1,504 sq. feet
|
2 baths 4 beds |
show details | |

|
#32
W Corak St
West Covina, CA 91790
|
1,080 sq. feet
|
2 baths 3 beds |
show details | |

|
#33
S Conlon Ave
West Covina, CA 91790
|
1,190 sq. feet
|
2 baths 4 beds |
show details | |

|
#34
E Alaska St
West Covina, CA 91791
|
1,514 sq. feet
|
2 baths 3 beds |
show details | |

|
#35
Seattle St
West Covina, CA 91790
|
1,195 sq. feet
|
3 baths 2 beds |
show details | |

|
#36
N Broadmoor Ave
West Covina, CA 91790
|
1,643 sq. feet
|
2 baths 3 beds |
show details | |

|
#37
S Fircroft St
West Covina, CA 91791
|
1,120 sq. feet
|
1 baths 3 beds |
show details | |

|
#38
W Durness St
West Covina, CA 91790
|
1,589 sq. feet
|
3 baths 4 beds |
show details | |

|
#39
Las Rosas Dr
West Covina, CA 91791
|
3,284 sq. feet
|
4 baths 4 beds |
show details | |

|
#40
N Toland Ave
West Covina, CA 91790
|
1,284 sq. feet
|
2 baths 3 beds |
show details |
| Photo | Address | Area | Beds / Baths | Price | Details |
|---|---|---|---|---|---|

|
#41
S Glenshaw Dr
West Covina, CA 91790
|
1,120 sq. feet
|
1 baths 3 beds |
show details | |

|
#42
S Serenade Ave
West Covina, CA 91790
|
1,832 sq. feet
|
3 baths 3 beds |
show details | |

|
#43
E Elgenia Ave
West Covina, CA 91790
|
1,199 sq. feet
|
2 baths 3 beds |
show details | |

|
#44
W Rowland Ave
West Covina, CA 91790
|
1,506 sq. feet
|
2 baths 3 beds |
show details | |

|
#45
Wrede Way
West Covina, CA 91791
|
6,722 sq. feet
|
8 baths 6 beds |
show details | |

|
#46
N Osborn Ave
West Covina, CA 91790
|
1,397 sq. feet
|
2 baths 3 beds |
show details | |

|
#47
W Puente Ave
West Covina, CA 91790
|
2,484 sq. feet
|
3 baths 5 beds |
show details | |

|
#48
S Bubbling Well Rd
West Covina, CA 91790
|
1,594 sq. feet
|
2 baths 3 beds |
show details | |

|
#49
Seneca Dr
West Covina, CA 91791
|
1,404 sq. feet
|
3 baths 4 beds |
show details | |

|
Check over 1 million property listings on Foreclosure.com!
|
browse all offers | |||


 | CA Cities(Pop 65,000+) by Median Household Income, 2019 (8 replies) |
| Tiny Houses - LA Style (25 replies) |
| The Los Angeles Homeless Containment Thread (9133 replies) |
| Newsom announces deal to Cap Rising Rent Prices (158 replies) |
| Real Estate Mobbing (25 replies) |
| Los Angeles will never solve its affordable housing problem. Why don't we instead educate? (81 replies) |
Median year apartment built: 1976
Household type by relationship:
Households: 105,032- Male householders: 16,271 (1,783 living alone), Female householders: 17,833 (5,124 living alone)
16,274 spouses (16,131 opposite-sex spouses), 2,662 unmarried partners, (2,354 opposite-sex unmarried partners), 33,807 children (32,729 natural, 189 adopted, 889 stepchildren), 2,489 grandchildren, 2,423 brothers or sisters, 4,320 parents, 0 foster children, 4,880 other relatives, 3,216 non-relatives
- In group quarters: 857
Size of family households: 7,046 2-persons, 5,653 3-persons, 7,026 4-persons, 4,146 5-persons, 949 6-persons, 626 7-or-more-persons.
Size of nonfamily households: 6,907 1-person, 1,394 2-persons, 357 3-persons.
12,234 married couples with children.
7,951 single-parent households (666 men, 7,285 women).
39.5% of residents of West Covina speak English at home.
33.5% of residents speak Spanish at home (75% speak English very well, 14% speak English well, 9% speak English not well, 2% don't speak English at all).
1.1% of residents speak other Indo-European language at home (64% speak English very well, 24% speak English well, 12% speak English not well).
24.9% of residents speak Asian or Pacific Island language at home (43% speak English very well, 33% speak English well, 17% speak English not well, 7% don't speak English at all).
0.9% of residents speak other language at home (75% speak English very well, 22% speak English well, 3% speak English not well).
Foreign born population: 36,729 (35.0%)
(65.6% of them are naturalized citizens)
| Here: | 5.8 |
| State: | 6.0 |
| Here: | 4.1 |
| State: | 3.9 |
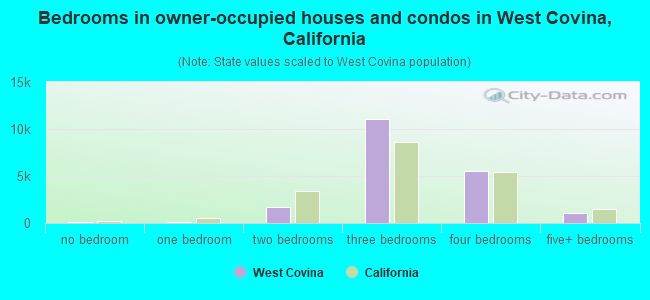
- Bedrooms in owner-occupied houses and condos in West Covina, California
- 66no bedroom
- 771 bedroom
- 1,7422 bedrooms
- 11,1033 bedrooms
- 5,5304 bedrooms
- 1,0375+ bedrooms
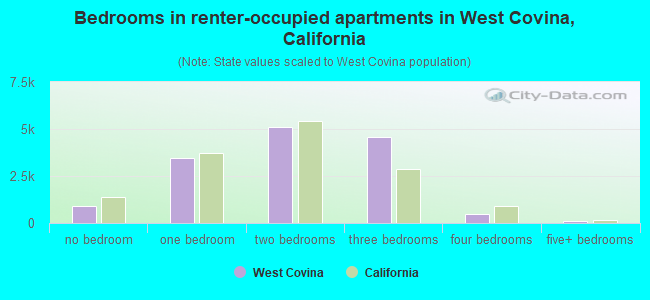
- Bedrooms in renter-occupied apartments in West Covina, California
- 911no bedroom
- 3,4331 bedroom
- 5,1032 bedrooms
- 4,5483 bedrooms
- 4614 bedrooms
- 935+ bedrooms
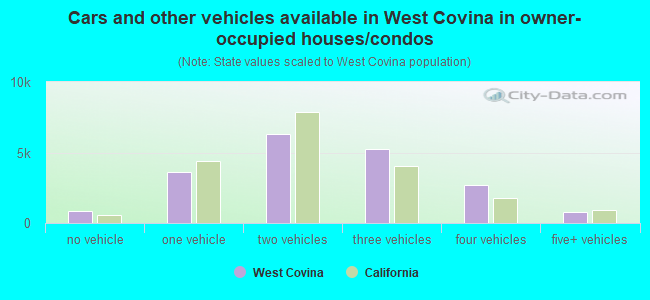
- Cars and other vehicles available in West Covina in owner-occupied houses/condos
- 834no vehicle
- 3,6401 vehicle
- 6,3342 vehicles
- 5,2333 vehicles
- 2,7164 vehicles
- 7985+ vehicles
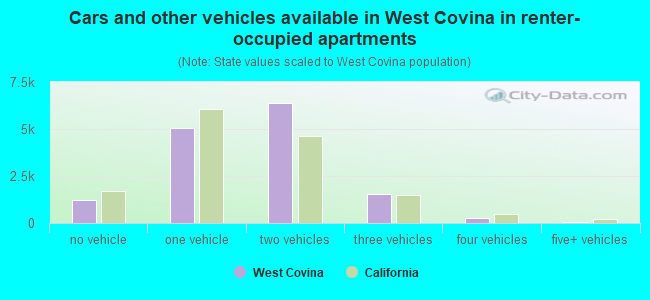
- Cars and other vehicles available in West Covina in renter-occupied apartments
- 1,227no vehicle
- 5,0401 vehicle
- 6,4062 vehicles
- 1,5173 vehicles
- 2914 vehicles
- 685+ vehicles
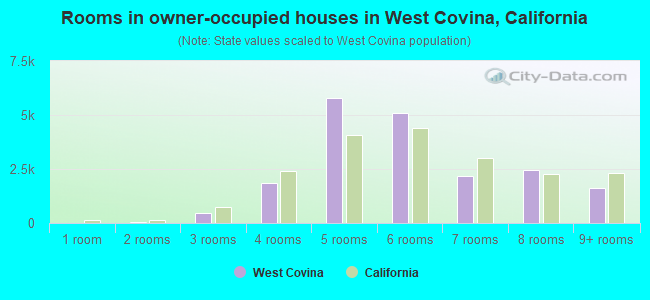
- Rooms in owner-occupied houses in West Covina, California
- 01 room
- 662 rooms
- 4693 rooms
- 1,8754 rooms
- 5,7995 rooms
- 5,0866 rooms
- 2,1787 rooms
- 2,4638 rooms
- 1,6199+ rooms
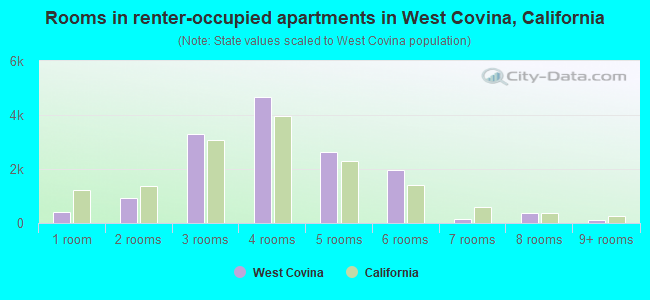
- Rooms in renter-occupied apartments in West Covina, California
- 3961 room
- 9292 rooms
- 3,3113 rooms
- 4,6834 rooms
- 2,6485 rooms
- 1,9716 rooms
- 1337 rooms
- 3858 rooms
- 939+ rooms
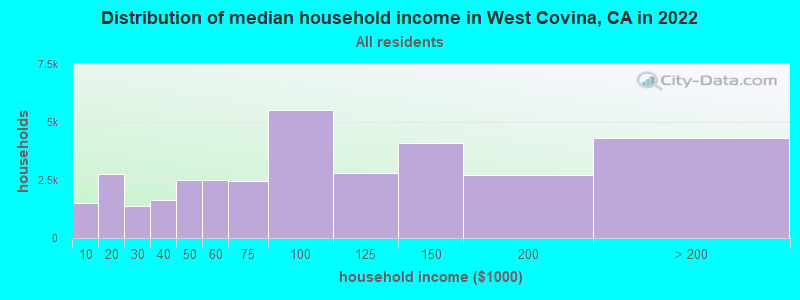
West Covina, CA household income distribution

- 1,492Less than $10,000
- 2,745$10,000 to $19,999
- 1,376$20,000 to $29,999
- 1,632$30,000 to $39,999
- 2,487$40,000 to $49,999
- 2,483$50,000 to $59,999
- 2,439$60,000 to $74,999
- 5,517$75,000 to $99,999
- 2,789$100,000 to $124,999
- 4,108$125,000 to $149,999
- 2,707$150,000 to $199,999
- 4,329$200,000 or more
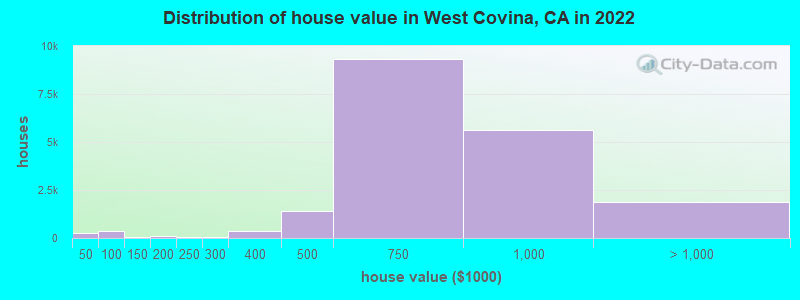
Home value of owner - occupied houses in 2022 in West Covina, CA
-
- 165Less than $10,000
- 18$20,000 to $24,999
- 5$25,000 to $29,999
- 19$30,000 to $34,999
- 29$40,000 to $49,999
- 84$50,000 to $59,999
- 98$60,000 to $69,999
- 70$70,000 to $79,999
- 50$80,000 to $89,999
- 10$90,000 to $99,999
- 49$100,000 to $124,999
- 11$125,000 to $149,999
- 68$150,000 to $174,999
- 20$175,000 to $199,999
- 50$200,000 to $249,999
- 35$250,000 to $299,999
- 365$300,000 to $399,999
- 1,391$400,000 to $499,999
- 9,328$500,000 to $749,999
- 5,604$750,000 to $999,999
- 1,034$1,000,000 to $1,499,999
- 449$1,500,000 to $1,999,999
- 394$2,000,000 or more
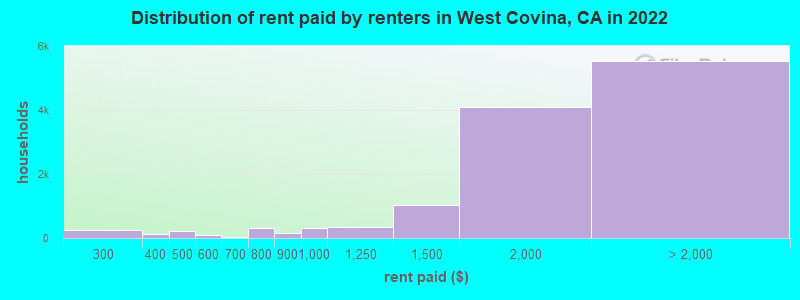
Rent paid by renters in 2022 in West Covina, CA
-
- 40Less than $100
- 26$150 to $199
- 153$200 to $249
- 101$250 to $299
- 115$350 to $399
- 103$400 to $449
- 120$450 to $499
- 65$500 to $549
- 15$550 to $599
- 33$600 to $649
- 288$700 to $749
- 28$750 to $799
- 153$800 to $899
- 324$900 to $999
- 342$1,000 to $1,249
- 1,032$1,250 to $1,499
- 4,098$1,500 to $1,999
- 3,428$2,000 to $2,499
- 1,330$2,500 to $2,999
- 176$3,000 to $3,499
- 96$3,500 or more
- 506No cash rent
Percentage of workers working in this county: 91.6%
Number of people working at home: 6,079 (11.8% of all workers)
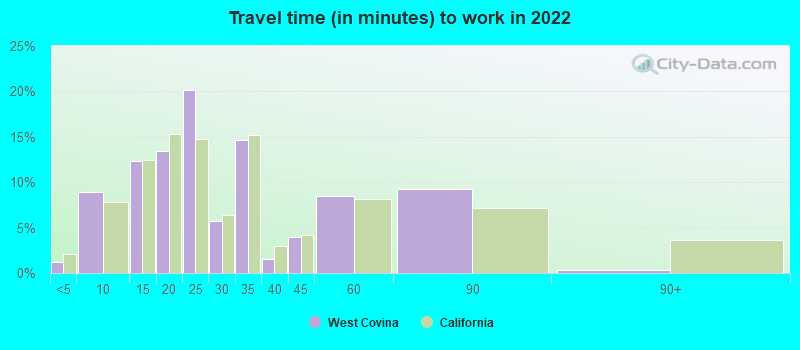
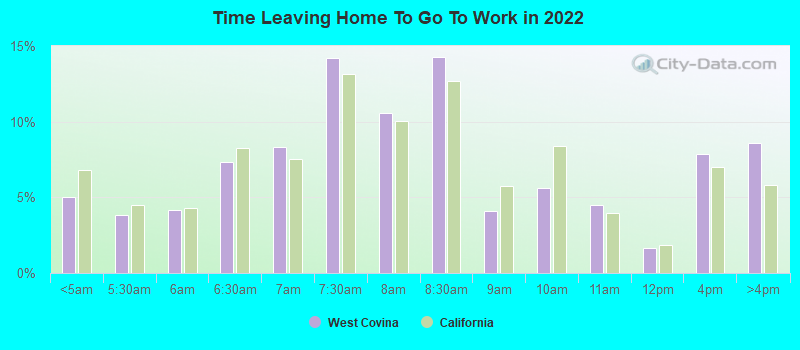
Travel time to work (commute)
- Less than 5 minutes: 647
- 5 to 9 minutes: 2,477
- 10 to 14 minutes: 4,393
- 15 to 19 minutes: 4,877
- 20 to 24 minutes: 5,441
- 25 to 29 minutes: 1,792
- 30 to 34 minutes: 7,645
- 35 to 39 minutes: 1,190
- 40 to 44 minutes: 2,135
- 45 to 59 minutes: 5,832
- 60 to 89 minutes: 3,581
- 90 or more minutes: 1,434
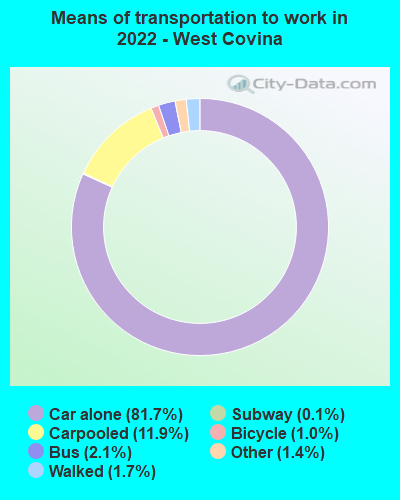
Means of transportation to work:
- Drove a car alone: 19,942 (65.5%)
- Carpooled: 3,211 (10.5%)
- Bus: 461 (1.5%)
- Subway or elevated rail: 5 (0.0%)
- Long-distance train or commuter rail: 15 (0.0%)
- Ferryboat: 14 (0.0%)
- Taxi: 387 (1.3%)
- Bicycle: 261 (0.9%)
- Walked: 437 (1.4%)
- Worked at home: 6,079 (20.0%)
- Unemployment by race in 2022
- Unemployment rate for White non-Hispanic residents
- 5.7%Males
- 17.2%Females
- Unemployment rate for Black residents
- 1.8%Males
- 7.2%Females
- Unemployment rate for American Indian and Alaska Native residents
- 2.5%Males
- Unemployment rate for Asian residents
- 3.2%Males
- 2.7%Females
- Unemployment rate for other race residents
- 8.5%Males
- 13.9%Females
- Unemployment rate for two or more race residents
- 3.8%Males
- 8.8%Females
- Unemployment rate for Hispanic or Latino residents
- 4.5%Males
- 10.0%Females
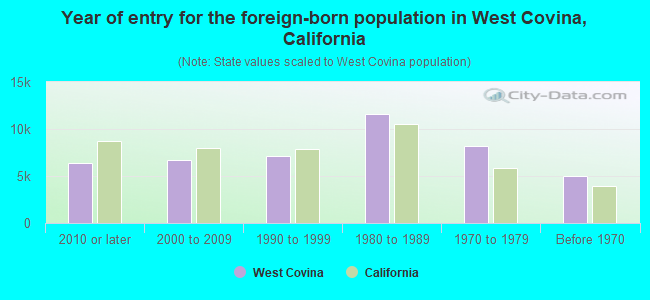
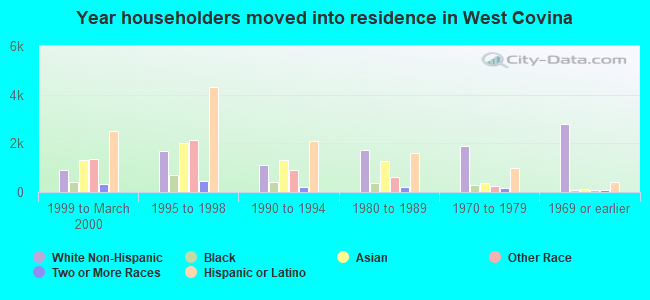
- Year of entry for the foreign-born population in West Covina, California
- 6,3612010 or later
- 6,6642000 to 2009
- 7,0801990 to 1999
- 11,5861980 to 1989
- 8,2371970 to 1979
- 4,958Before 1970
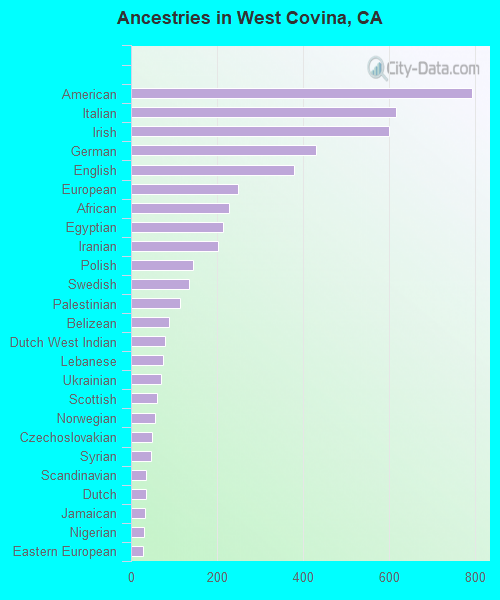
First ancestries reported:
- American: 794 (1.1%)
- Italian: 617 (0.9%)
- Irish: 601 (0.8%)
- German: 430 (0.6%)
- English: 379 (0.5%)
- European: 250 (0.4%)
- African: 229 (0.3%)
- Egyptian: 215 (0.3%)
- Iranian: 203 (0.3%)
- Polish: 145 (0.2%)
- Swedish: 136 (0.2%)
- Palestinian: 114 (0.2%)
- Belizean: 89 (0.1%)
- Dutch West Indian: 80 (0.1%)
- Lebanese: 74 (0.1%)
- Ukrainian: 71 (0.1%)
- Scottish: 61 (0.09%)
- Norwegian: 55 (0.08%)
- Czechoslovakian: 48 (0.07%)
- Syrian: 47 (0.07%)
- Scandinavian: 35 (0.05%)
- Dutch: 35 (0.05%)
- Jamaican: 33 (0.05%)
- Nigerian: 30 (0.04%)
- Eastern European: 29 (0.04%)
- Greek: 29 (0.04%)
- Portuguese: 27 (0.04%)
- British: 26 (0.04%)
- Danish: 25 (0.04%)
- Arab: 23 (0.03%)
- Armenian: 22 (0.03%)
- Russian: 22 (0.03%)
- Croatian: 20 (0.03%)
- Iraqi: 20 (0.03%)
- Moroccan: 19 (0.03%)
- Romanian: 19 (0.03%)
- Scotch-Irish: 19 (0.03%)
- Jordanian: 13 (0.02%)
- Slovak: 13 (0.02%)
- French: 13 (0.02%)
- Austrian: 12 (0.02%)
- French Canadian: 11 (0.02%)
- Canadian: 10 (0.01%)
- Czech: 10 (0.01%)
- Welsh: 10 (0.01%)
- Slovene: 9 (0.01%)
- Serbian: 8 (0.01%)
- Estonian: 6 (0.01%)
- Finnish: 4 (0.01%)
- Ethiopian: 4 (0.01%)
Most common places of birth for foreign-born residents (%):
| West Covina: | 25.4% (9,560) |
| California: | 37.2% (3,881,193) |
| West Covina: | 15.5% (5,838) |
| California: | 7.8% (818,297) |
| West Covina: | 14.7% (5,535) |
| California: | 6.6% (684,672) |
| West Covina: | 9.1% (3,408) |
| California: | 4.9% (512,335) |
| West Covina: | 5.5% (2,058) |
| California: | 1.7% (176,274) |
| West Covina: | 3.1% (1,164) |
| California: | 4.2% (440,287) |
| West Covina: | 2.4% (891) |
| California: | 1.0% (105,215) |
| West Covina: | 2.3% (882) |
| California: | 0.6% (58,161) |
| West Covina: | 1.9% (711) |
| California: | 2.8% (290,436) |
| West Covina: | 1.8% (688) |
| California: | 0.7% (74,025) |
| West Covina: | 1.8% (659) |
| California: | 5.2% (539,184) |
Place of birth for U.S.-born residents:
- This state: 59,336
- Other state: 7,447
- Northeast: 1,280
- Midwest: 1,617
- South: 2,126
- West: 2,424
91.7% of West Covina residents lived in the same house 1 years ago.
Out of people who lived in different houses, 44.0% lived in this county.
Out of people who lived in different counties, 78.8% lived in California.
| West Covina: | 91.7% |
| State average: | 88.9% |
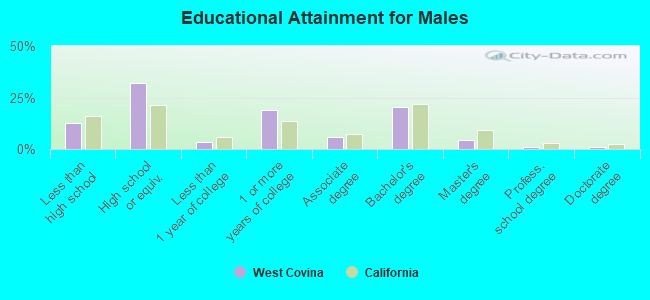
Education attainment for males 25 years and older:
- No schooling: 1,019
- Nursery to 4th grade: 410
- 5th and 6th grade: 313
- 7th and 8th grade: 178
- 9th grade: 328
- 10th grade: 514
- 11th grade: 228
- 12th grade, no diploma: 1,344
- High school graduate (or equivalency): 10,848
- Less than 1 year of college: 1,190
- Some college more than 1 year, no degree: 6,435
- Associate degree: 2,008
- Bachelor's degree: 6,929
- Master's degree: 1,485
- Professional school degree: 338
- Doctorate degree: 316
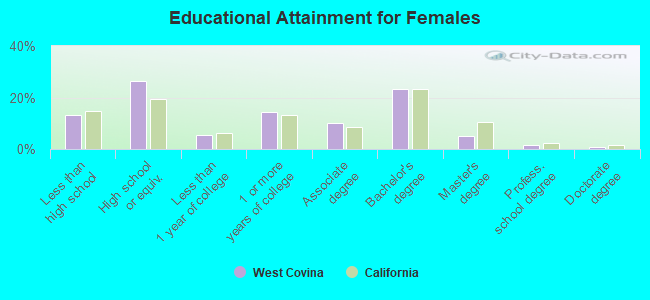
Education attainment for females 25 years and older:
- No schooling: 912
- Nursery to 4th grade: 437
- 5th and 6th grade: 142
- 7th and 8th grade: 275
- 9th grade: 632
- 10th grade: 572
- 11th grade: 870
- 12th grade, no diploma: 1,317
- High school graduate (or equivalency): 10,348
- Less than 1 year of college: 2,141
- Some college more than 1 year, no degree: 5,574
- Associate degree: 4,010
- Bachelor's degree: 9,155
- Master's degree: 1,918
- Professional school degree: 624
- Doctorate degree: 259
Housing units in structures:
- One, detached: 21,873
- One, attached: 2,604
- Two: 665
- 3 or 4: 1,674
- 5 to 9: 1,664
- 10 to 19: 909
- 20 to 49: 1,396
- 50 or more: 4,265
- Mobile homes: 148
Median worth of mobile homes: $164,500
Housing units lacking complete kitchen facilities in 2022: 2.2%
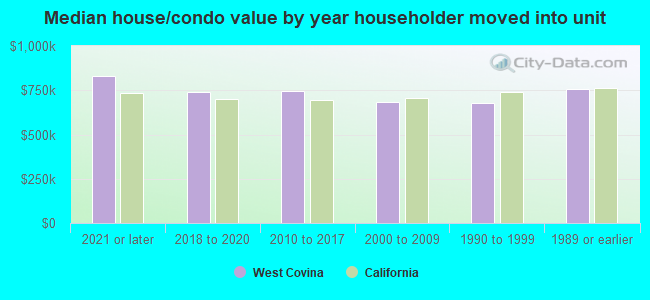
House/condo owner moved in on average 18 years ago
Renter moved in on average 3 years ago
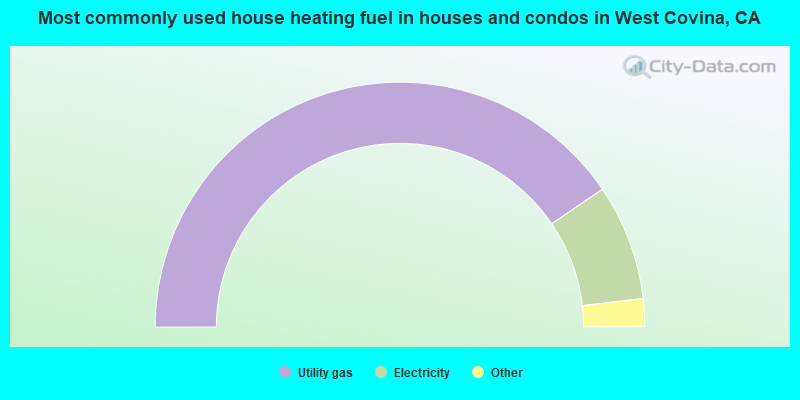
- 81.0%Utility gas
- 15.3%Electricity
- 1.4%Solar energy
- 1.1%Bottled, tank, or LP gas
- 0.9%No fuel used
- 0.2%Other fuel
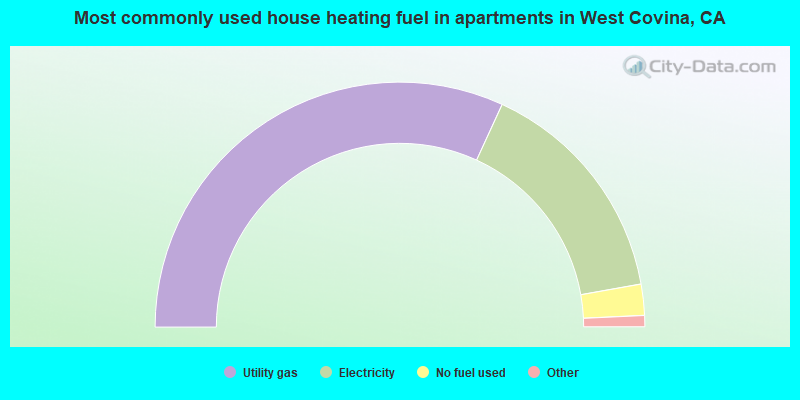
- 63.7%Utility gas
- 30.7%Electricity
- 4.1%No fuel used
- 0.8%Bottled, tank, or LP gas
- 0.3%Wood
- 0.3%Solar energy
- 0.1%Fuel oil, kerosene, etc.
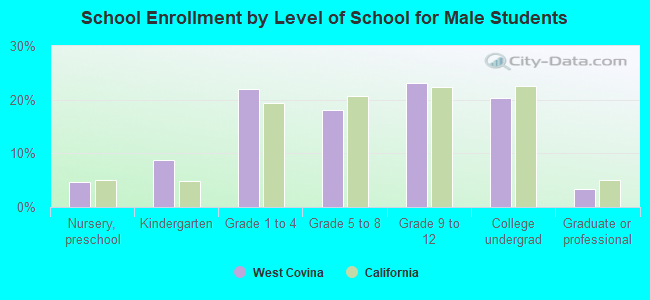
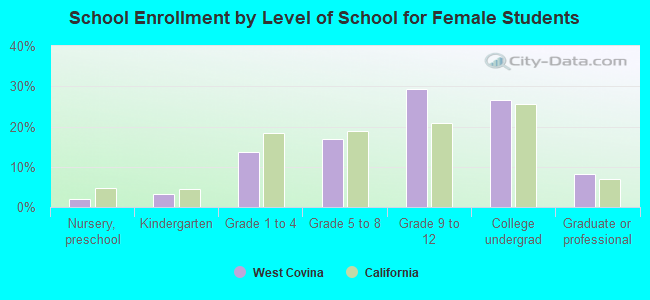
Private vs. public school enrollment:
| Here: | 7.6% |
| California: | 10.5% |
| Here: | 3.4% |
| California: | 8.5% |
| Here: | 13.6% |
| California: | 15.9% |