Work and Jobs in West Covina, California (CA) Detailed Stats
Occupations, Industries, Unemployment, Workers, Commute
Settings
X


Recent posts about work in West Covina, California on our local forum with over 2,400,000 registered users:
 | CA Cities(Pop 65,000+) by Median Household Income, 2019 (8 replies) |
| Fresno Struggles With $15 Min Wage (290 replies) |
| Commuting to Pasadena- Better from East or West? (12 replies) |
| The Los Angeles Homeless Containment Thread (9136 replies) |
| Newsom announces deal to Cap Rising Rent Prices (158 replies) |
| Best/Top Medical Facilities to work? (3 replies) |
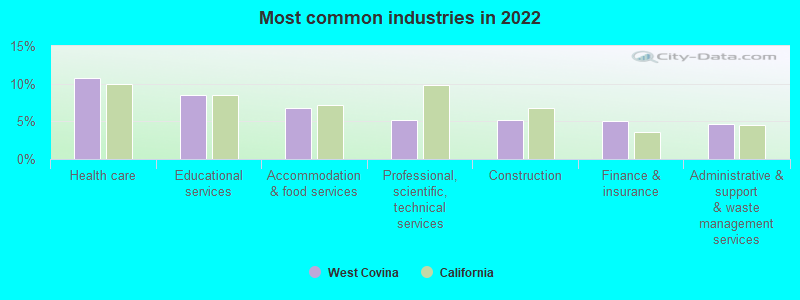
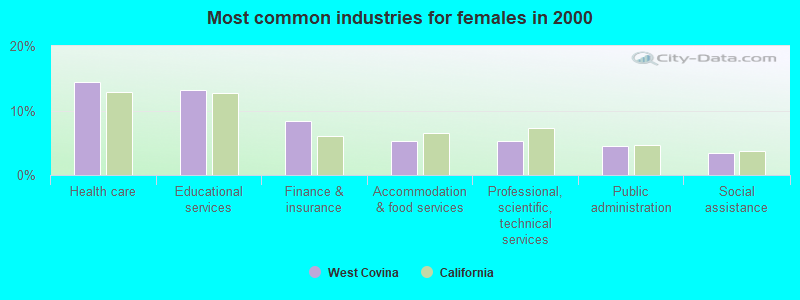
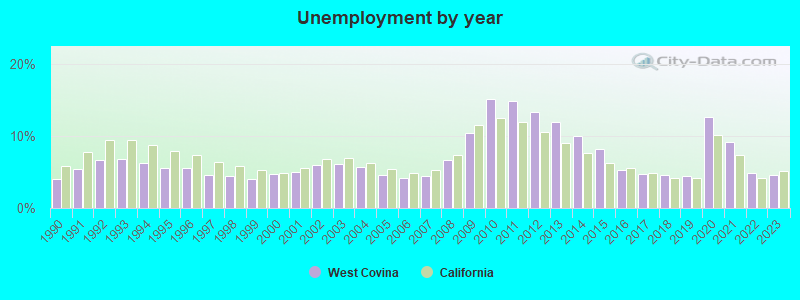
The unemployment rate in 2023 in West Covina, CA was 4.6%, which was 10.9% less than the unemployment rate of 5.1% across the entire state of California. Compared to the unemployment rate of 11.9% in 2013, this represents a decrease of 158.7%. According to 2022 data, the most common industries in West Covina are: Health care (10.7% of civilian employees), Educational services (8.5% of civilian employees), Accommodation & food services (6.7% of civilian employees). 91.6% of workers work in Los Angeles County and 9.2% of all workers work at home. 67.2% of workers are employees of private companies, which is about the same as the rate of 66.5% across the entire state of California.
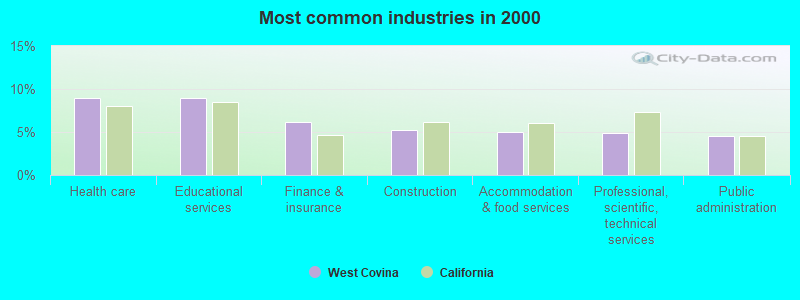
Whole page based on the data from 2000 / 2022 when the population of West Covina, California was 105,080 / 105,032
Whole page based on the data from 2000 / 2022 when the population of West Covina, California was 105,080 / 105,032
Most common industries

Most common industries | Most common industries | |||||
|---|---|---|---|---|---|---|
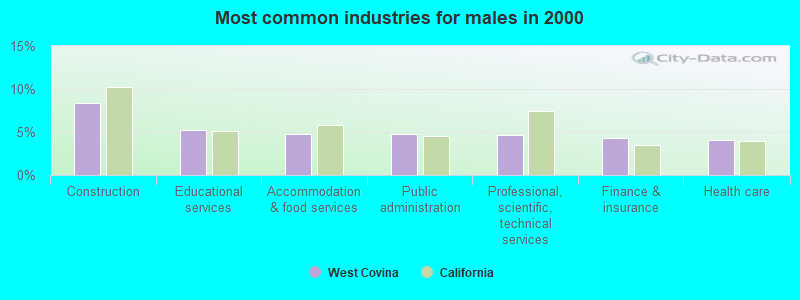
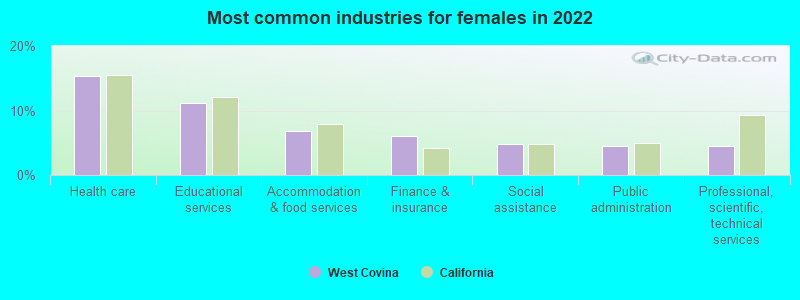
Industry | All | Males | Females | All | Males | Females |
| Health care | 10.7% (5,820) | 6.2% (1,674) | 15.3% (4,146) | 9.0% (4,026) | 4.1% (983) | 14.5% (3,043) |
| Educational services | 8.5% (4,601) | 5.9% (1,593) | 11.1% (3,008) | 8.9% (4,022) | 5.3% (1,258) | 13.1% (2,764) |
| Accommodation and food services | 6.7% (3,653) | 6.6% (1,796) | 6.9% (1,857) | 5.0% (2,256) | 4.8% (1,144) | 5.3% (1,112) |
| Professional, scientific, and technical services | 5.2% (2,830) | 6.0% (1,622) | 4.5% (1,208) | 4.9% (2,205) | 4.6% (1,110) | 5.2% (1,095) |
| Construction | 5.1% (2,786) | 9.2% (2,500) | 1.1% (286) | 5.2% (2,346) | 8.3% (1,993) | 1.7% (353) |
| Finance and insurance | 5.0% (2,707) | 4.0% (1,077) | 6.0% (1,630) | 6.2% (2,794) | 4.3% (1,039) | 8.3% (1,755) |
| Administrative and support and waste management services | 4.7% (2,532) | 5.1% (1,388) | 4.2% (1,144) | 3.2% (1,431) | 3.5% (841) | 2.8% (590) |
| Public administration | 4.4% (2,397) | 4.3% (1,170) | 4.5% (1,227) | 4.6% (2,060) | 4.7% (1,128) | 4.4% (932) |
| Social assistance | 2.9% (1,548) | 0.9% (251) | 4.8% (1,297) | 1.9% (837) | 0.4% (105) | 3.5% (732) |
| Arts, entertainment, and recreation | 2.4% (1,280) | 2.6% (698) | 2.2% (582) | 1.5% (655) | 1.7% (400) | 1.2% (255) |
| Personal and laundry services | 2.2% (1,168) | 0.8% (218) | 3.5% (950) | 1.5% (682) | 1.2% (297) | 1.8% (385) |
| Real estate and rental and leasing | 2.1% (1,158) | 2.1% (576) | 2.2% (582) | 2.3% (1,020) | 2.1% (493) | 2.5% (527) |
| Food and beverage stores | 2.1% (1,115) | 2.6% (706) | 1.5% (409) | 2.3% (1,016) | 2.5% (588) | 2.0% (428) |
| Other transportation, and support activities, and couriers | 2.0% (1,097) | 3.2% (855) | 0.9% (242) | 1.9% (874) | 3.0% (717) | 0.7% (157) |
| Miscellaneous manufacturing | 1.9% (1,023) | 2.0% (533) | 1.8% (490) | 1.9% (860) | 1.8% (428) | 2.1% (432) |
| Department and other general merchandise stores | 1.5% (838) | 0.6% (155) | 2.5% (683) | 2.0% (918) | 1.3% (321) | 2.8% (597) |
| Transportation equipment | 1.5% (809) | 2.3% (613) | 0.7% (196) | 1.4% (639) | 2.2% (534) | 0.5% (105) |
| Motor vehicle and parts dealers | 1.5% (794) | 2.1% (575) | 0.8% (219) | 1.0% (453) | 1.5% (371) | 0.4% (82) |
| Repair and maintenance | 1.3% (718) | 2.5% (675) | 0.2% (43) | 1.8% (791) | 3.1% (731) | 0.3% (60) |
| Truck transportation | 1.3% (704) | 2.2% (599) | 0.4% (105) | 1.7% (775) | 2.9% (690) | 0.4% (85) |
| Utilities | 1.3% (694) | 1.5% (409) | 1.1% (285) | 1.2% (523) | 1.6% (378) | 0.7% (145) |
| Groceries and related products merchant wholesalers | 1.3% (683) | 1.8% (476) | 0.8% (207) | 1.3% (580) | 1.9% (455) | 0.6% (125) |
| Clothing and accessories, including shoe, stores | 1.2% (661) | 0.5% (131) | 2.0% (530) | 0.9% (426) | 0.5% (110) | 1.5% (316) |
| Religious, grantmaking, civic, professional, and similar organizations | 1.1% (604) | 1.0% (263) | 1.3% (341) | 1.3% (587) | 1.3% (312) | 1.3% (275) |
| Agriculture, forestry, fishing and hunting | 1.1% (572) | 1.2% (331) | 0.9% (241) | 0.1% (31) | 0.1% (31) | 0.0% (0) |
| Broadcasting and telecommunications | 1.0% (566) | 1.2% (317) | 0.9% (249) | 1.6% (713) | 1.8% (439) | 1.3% (274) |
| Chemicals | 1.0% (555) | 1.2% (335) | 0.8% (220) | 0.5% (227) | 0.7% (170) | 0.3% (57) |
| Food | 1.0% (544) | 1.5% (402) | 0.5% (142) | 1.2% (523) | 1.2% (299) | 1.1% (224) |
| Metal and metal products | 1.0% (542) | 1.6% (424) | 0.4% (118) | 1.8% (821) | 2.7% (658) | 0.8% (163) |
| Radio, TV, and computer stores | 0.9% (490) | 1.4% (387) | 0.4% (103) | 0.9% (390) | 1.2% (293) | 0.5% (97) |
| Used merchandise, gift, novelty, and souvenir, and other miscellaneous stores | 0.8% (446) | 0.4% (106) | 1.3% (340) | 0.5% (215) | 0.4% (90) | 0.6% (125) |
| Private households | 0.8% (440) | 0.3% (72) | 1.4% (368) | 0.5% (209) | 0.0% (11) | 0.9% (198) |
| Publishing, and motion picture and sound recording industries | 0.8% (437) | 0.3% (92) | 1.3% (345) | 1.1% (505) | 1.3% (311) | 0.9% (194) |
| U. S. Postal service | 0.8% (415) | 1.1% (304) | 0.4% (111) | 1.0% (447) | 1.3% (313) | 0.6% (134) |
| Computer and electronic products | 0.7% (380) | 0.7% (178) | 0.7% (202) | 1.6% (709) | 2.0% (477) | 1.1% (232) |
| Apparel | 0.6% (344) | 0.3% (70) | 1.0% (274) | 1.4% (617) | 0.7% (178) | 2.1% (439) |
| Building material and garden equipment and supplies dealers | 0.6% (316) | 0.8% (210) | 0.4% (106) | 0.8% (338) | 0.7% (178) | 0.8% (160) |
| Electronic shopping and mail-order houses | 0.6% (308) | 0.5% (123) | 0.7% (185) | 0.2% (101) | 0.3% (67) | 0.2% (34) |
| Health and personal care, except drug, stores | 0.5% (294) | 0.3% (81) | 0.8% (213) | 0.2% (105) | 0.2% (55) | 0.2% (50) |
| Motor vehicles, parts and supplies merchant wholesalers | 0.5% (270) | 0.6% (156) | 0.4% (114) | 0.3% (141) | 0.3% (69) | 0.3% (72) |
| Miscellaneous durable goods merchant wholesalers | 0.4% (239) | 0.1% (23) | 0.8% (216) | 0.5% (208) | 0.2% (45) | 0.8% (163) |
| Apparel, fabrics, and notions merchant wholesalers | 0.4% (239) | 0.4% (97) | 0.5% (142) | 0.4% (158) | 0.2% (55) | 0.5% (103) |
| Machinery | 0.4% (237) | 0.7% (186) | 0.2% (51) | 0.7% (306) | 0.9% (218) | 0.4% (88) |
| Professional and commercial equipment and supplies merchant wholesalers | 0.4% (236) | 0.6% (167) | 0.3% (69) | 0.7% (308) | 0.7% (166) | 0.7% (142) |
| Other direct selling establishments | 0.4% (231) | 0.2% (44) | 0.7% (187) | 0.5% (227) | 0.6% (153) | 0.4% (74) |
| Pharmacies and drug stores | 0.4% (230) | 0.5% (149) | 0.3% (81) | 0.4% (186) | 0.3% (66) | 0.6% (120) |
| Warehousing and storage | 0.4% (228) | 0.8% (207) | 0.1% (21) | 0.3% (121) | 0.5% (114) | 0.0% (7) |
| Drugs, sundries, and chemical and allied products merchant wholesalers | 0.4% (221) | 0.6% (175) | 0.2% (46) | 0.1% (56) | 0.1% (31) | 0.1% (25) |
| Electrical and electronic goods merchant wholesalers | 0.4% (204) | 0.7% (191) | 0.0% (13) | 0.5% (239) | 0.7% (179) | 0.3% (60) |
| Miscellaneous nondurable goods merchant wholesalers | 0.4% (202) | 0.4% (116) | 0.3% (86) | 0.8% (372) | 0.9% (225) | 0.7% (147) |
| Furniture and home furnishing merchant wholesalers | 0.4% (200) | 0.2% (54) | 0.5% (146) | 0.2% (73) | 0.3% (67) | 0.0% (6) |
| Printing and related support activities | 0.3% (185) | 0.6% (150) | 0.1% (35) | 1.0% (462) | 1.5% (352) | 0.5% (110) |
| Machinery, equipment, and supplies merchant wholesalers | 0.3% (173) | 0.5% (125) | 0.2% (48) | 0.6% (254) | 0.9% (204) | 0.2% (50) |
| Textile mills and textile products | 0.3% (164) | 0.2% (67) | 0.4% (97) | 0.5% (205) | 0.4% (89) | 0.6% (116) |
| Electrical equipment, appliances, and components | 0.3% (161) | 0.3% (78) | 0.3% (83) | 0.5% (236) | 0.7% (157) | 0.4% (79) |
| Paper | 0.2% (130) | 0.5% (130) | 0.0% (0) | 0.3% (123) | 0.4% (104) | 0.1% (19) |
| Sporting goods, camera, and hobby and toy stores | 0.2% (130) | 0.1% (22) | 0.4% (108) | 0.2% (85) | 0.2% (53) | 0.2% (32) |
| Air transportation | 0.2% (127) | 0.4% (112) | 0.1% (15) | 0.3% (135) | 0.3% (71) | 0.3% (64) |
| Beverage and tobacco products | 0.2% (126) | 0.5% (126) | 0.0% (0) | 0.1% (46) | 0.2% (38) | 0.0% (8) |
| Plastics and rubber products | 0.2% (123) | 0.3% (77) | 0.2% (46) | 0.7% (314) | 0.9% (223) | 0.4% (91) |
| Petroleum and coal products | 0.2% (118) | 0.4% (105) | 0.0% (13) | 0.1% (35) | 0.1% (29) | 0.0% (6) |
| Furniture and home furnishings, and household appliance stores | 0.2% (113) | 0.2% (61) | 0.2% (52) | 0.6% (267) | 0.6% (150) | 0.6% (117) |
| Furniture and related product manufacturing | 0.2% (112) | 0.4% (112) | 0.0% (0) | 0.6% (285) | 0.9% (206) | 0.4% (79) |
| Alcoholic beverages merchant wholesalers | 0.2% (108) | 0.1% (28) | 0.3% (80) | 0.1% (33) | 0.1% (26) | 0.0% (7) |
| Nonmetallic mineral products | 0.2% (88) | 0.1% (20) | 0.3% (68) | 0.3% (127) | 0.4% (86) | 0.2% (41) |
| Rail transportation | 0.1% (78) | 0.2% (58) | 0.1% (20) | 0.1% (61) | 0.3% (61) | 0.0% (0) |
| Management of companies and enterprises | 0.1% (71) | 0.1% (18) | 0.2% (53) | 0.0% (16) | 0.0% (0) | 0.1% (16) |
| Sewing, needlework, and piece goods stores | 0.1% (57) | 0.0% (13) | 0.2% (44) | 0.0% (0) | 0.0% (0) | 0.0% (0) |
| Fuel dealers | 0.1% (56) | 0.1% (35) | 0.1% (21) | 0.0% (0) | 0.0% (0) | 0.0% (0) |
| Mining, quarrying, and oil and gas extraction | 0.1% (52) | 0.2% (42) | 0.0% (10) | 0.1% (31) | 0.1% (25) | 0.0% (6) |
| Hardware, plumbing and heating equipment, and supplies merchant wholesalers | 0.1% (52) | 0.0% (0) | 0.2% (52) | 0.2% (97) | 0.3% (63) | 0.2% (34) |
| Paper and paper products merchant wholesalers | 0.1% (51) | 0.1% (36) | 0.1% (15) | 0.2% (81) | 0.2% (58) | 0.1% (23) |
| Recyclable material merchant wholesalers | 0.1% (47) | 0.1% (28) | 0.1% (19) | 0.1% (31) | 0.1% (20) | 0.1% (11) |
| Jewelry, luggage, and leather goods stores | 0.1% (31) | 0.0% (0) | 0.1% (31) | 0.2% (103) | 0.2% (37) | 0.3% (66) |
| Book stores and news dealers | 0.0% (25) | 0.0% (0) | 0.1% (25) | 0.2% (72) | 0.1% (23) | 0.2% (49) |
| Office supplies and stationery stores | 0.0% (22) | 0.1% (22) | 0.0% (0) | 0.2% (102) | 0.3% (80) | 0.1% (22) |
| Gasoline stations | 0.0% (15) | 0.1% (15) | 0.0% (0) | 0.1% (58) | 0.2% (58) | 0.0% (0) |
| Data processing, libraries, and other information services | 0.0% (14) | 0.1% (14) | 0.0% (0) | 0.6% (283) | 0.6% (142) | 0.7% (141) |
| Metals and minerals, except petroleum, merchant wholesalers | 0.0% (13) | 0.0% (13) | 0.0% (0) | 0.1% (33) | 0.1% (33) | 0.0% (0) |
| Wood products | 0.0% (0) | 0.0% (0) | 0.0% (0) | 0.1% (43) | 0.1% (35) | 0.0% (8) |
| Retail florists | 0.0% (0) | 0.0% (0) | 0.0% (0) | 0.2% (69) | 0.2% (45) | 0.1% (24) |
| Music stores | 0.0% (0) | 0.0% (0) | 0.0% (0) | 0.2% (73) | 0.2% (39) | 0.2% (34) |
Unemployment in West Covina
- Unemployment by race in 2022
- Unemployment rate for White non-Hispanic residents
- 5.7%Males
- 17.2%Females
- Unemployment rate for Black residents
- 1.8%Males
- 7.2%Females
- Unemployment rate for American Indian and Alaska Native residents
- 2.5%Males
- Unemployment rate for Asian residents
- 3.2%Males
- 2.7%Females
- Unemployment rate for other race residents
- 8.5%Males
- 13.9%Females
- Unemployment rate for two or more race residents
- 3.8%Males
- 8.8%Females
- Unemployment rate for Hispanic or Latino residents
- 4.5%Males
- 10.0%Females
- Unemployment by race in 2000
- Unemployment rate for White non-Hispanic residents
- 7.5%Males
- 4.8%Females
- Unemployment rate for Black residents
- 15.6%Males
- 4.6%Females
- Unemployment rate for American Indian and Alaska Native residents
- 13.9%Males
- 10.6%Females
- Unemployment rate for Asian residents
- 8.2%Males
- 3.7%Females
- Unemployment rate for other race residents
- 6.2%Males
- 10.0%Females
- Unemployment rate for two or more race residents
- 7.1%Males
- 7.1%Females
- Unemployment rate for Hispanic or Latino residents
- 6.2%Males
- 9.1%Females
Unemployment in 2023:
| West Covina: | 4.6% |
| California: | 5.1% |
Unemployment in 2022:
| West Covina: | 4.8% |
| California: | 4.2% |
Unemployment in 2021:
| West Covina: | 9.2% |
| California: | 7.3% |
Unemployment in 2020:
| West Covina: | 12.6% |
| California: | 10.1% |
Unemployment in 2019:
| West Covina: | 4.4% |
| California: | 4.1% |
Unemployment in 2018:
| West Covina: | 4.6% |
| California: | 4.2% |
Unemployment in 2017:
| West Covina: | 4.7% |
| California: | 4.8% |
Unemployment in 2016:
| West Covina: | 5.3% |
| California: | 5.5% |
Unemployment in 2015:
| West Covina: | 8.2% |
| California: | 6.3% |
Unemployment in 2014:
| West Covina: | 10.0% |
| California: | 7.6% |
Unemployment in 2013:
| West Covina: | 11.9% |
| California: | 9.0% |
Unemployment in 2012:
| West Covina: | 13.3% |
| California: | 10.5% |
Unemployment in 2011:
| West Covina: | 14.8% |
| California: | 11.9% |
Unemployment in 2010:
| West Covina: | 15.2% |
| California: | 12.5% |
Unemployment in 2009:
| West Covina: | 10.4% |
| California: | 11.5% |
Unemployment in 2008:
| West Covina: | 6.6% |
| California: | 7.3% |
Unemployment in 2007:
| West Covina: | 4.5% |
| California: | 5.3% |
Unemployment in 2006:
| West Covina: | 4.2% |
| California: | 4.9% |
Unemployment in 2005:
| West Covina: | 4.6% |
| California: | 5.4% |
Unemployment in 2004:
| West Covina: | 5.7% |
| California: | 6.2% |
Unemployment in 2003:
| West Covina: | 6.1% |
| California: | 6.9% |
Unemployment in 2002:
| West Covina: | 6.0% |
| California: | 6.8% |
Unemployment in 2001:
| West Covina: | 5.0% |
| California: | 5.5% |
Unemployment in 2000:
| West Covina: | 4.7% |
| California: | 4.9% |
Unemployment in 1999:
| West Covina: | 4.0% |
| California: | 5.3% |
Unemployment in 1998:
| West Covina: | 4.4% |
| California: | 5.9% |
Unemployment in 1997:
| West Covina: | 4.6% |
| California: | 6.4% |
Unemployment in 1996:
| West Covina: | 5.5% |
| California: | 7.3% |
Unemployment in 1995:
| West Covina: | 5.5% |
| California: | 7.9% |
Unemployment in 1994:
| West Covina: | 6.3% |
| California: | 8.7% |
Unemployment in 1993:
| West Covina: | 6.8% |
| California: | 9.5% |
Unemployment in 1992:
| West Covina: | 6.7% |
| California: | 9.4% |
Unemployment in 1991:
| West Covina: | 5.4% |
| California: | 7.8% |
Unemployment in 1990:
| West Covina: | 4.0% |
| California: | 5.8% |
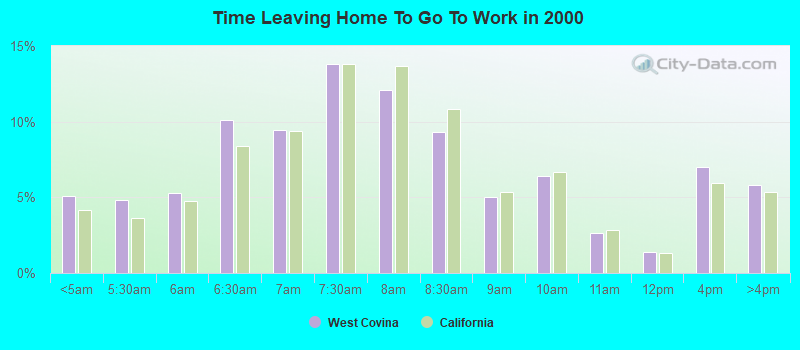
Time leaving home to go to work
12:00 a.m. to 4:59 a.m.:
| West Covina: | 5.0% (2,083) |
| California: | 6.8% (1,050,902) |
5:00 a.m. to 5:29 a.m.:
| West Covina: | 3.8% (1,586) |
| California: | 4.5% (692,772) |
5:30 a.m. to 5:59 a.m.:
| West Covina: | 4.2% (1,735) |
| California: | 4.3% (665,475) |
6:00 a.m. to 6:29 a.m.:
| West Covina: | 7.4% (3,047) |
| California: | 8.3% (1,273,588) |
6:30 a.m. to 6:59 a.m.:
| West Covina: | 8.3% (3,443) |
| California: | 7.5% (1,156,338) |
7:00 a.m. to 7:29 a.m.:
| West Covina: | 14.2% (5,876) |
| California: | 13.2% (2,027,702) |
7:30 a.m. to 7:59 a.m.:
| West Covina: | 10.6% (4,379) |
| California: | 10.1% (1,550,402) |
8:00 a.m. to 8:29 a.m.:
| West Covina: | 14.3% (5,916) |
| California: | 12.7% (1,953,986) |
8:30 a.m. to 8:59 a.m.:
| West Covina: | 4.1% (1,701) |
| California: | 5.8% (890,950) |
9:00 a.m. to 9:59 a.m.:
| West Covina: | 5.6% (2,335) |
| California: | 8.4% (1,288,499) |
10:00 a.m. to 10:59 a.m.:
| West Covina: | 4.5% (1,851) |
| California: | 4.0% (613,193) |
11:00 a.m. to 11:59 a.m.:
| West Covina: | 1.6% (679) |
| California: | 1.8% (280,975) |
12:00 p.m. to 3:59 p.m.:
| West Covina: | 7.8% (3,253) |
| California: | 7.0% (1,075,505) |
4:00 p.m. to 11:59 p.m.:
| West Covina: | 8.6% (3,560) |
| California: | 5.8% (891,240) |
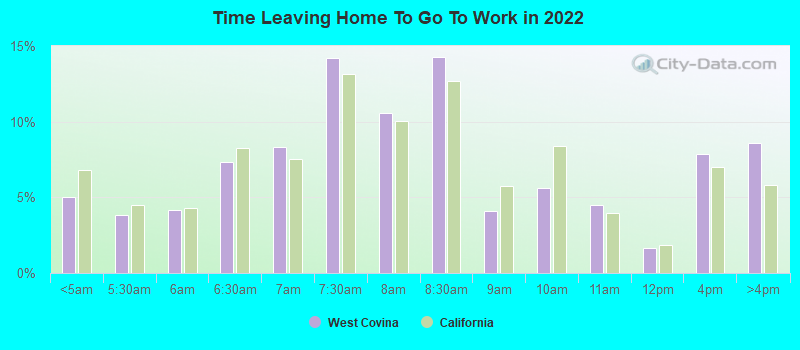
<5am:
| West Covina: | 5.1% (2,225) |
| California: | 4.2% (606,086) |
5:30am:
| West Covina: | 4.8% (2,119) |
| California: | 3.6% (523,209) |
6am:
| West Covina: | 5.3% (2,320) |
| California: | 4.8% (692,256) |
6:30am:
| West Covina: | 10.1% (4,454) |
| California: | 8.4% (1,216,867) |
7am:
| West Covina: | 9.5% (4,164) |
| California: | 9.4% (1,362,830) |
7:30am:
| West Covina: | 13.8% (6,072) |
| California: | 13.8% (2,006,950) |
8am:
| West Covina: | 12.1% (5,317) |
| California: | 13.7% (1,986,831) |
8:30am:
| West Covina: | 9.3% (4,086) |
| California: | 10.9% (1,577,815) |
9am:
| West Covina: | 5.0% (2,200) |
| California: | 5.4% (778,152) |
10am:
| West Covina: | 6.4% (2,826) |
| California: | 6.7% (972,355) |
11am:
| West Covina: | 2.6% (1,160) |
| California: | 2.9% (414,479) |
12pm:
| West Covina: | 1.4% (624) |
| California: | 1.3% (189,005) |
4pm:
| West Covina: | 7.0% (3,066) |
| California: | 6.0% (865,284) |
>4pm:
| West Covina: | 5.8% (2,561) |
| California: | 5.3% (776,167) |
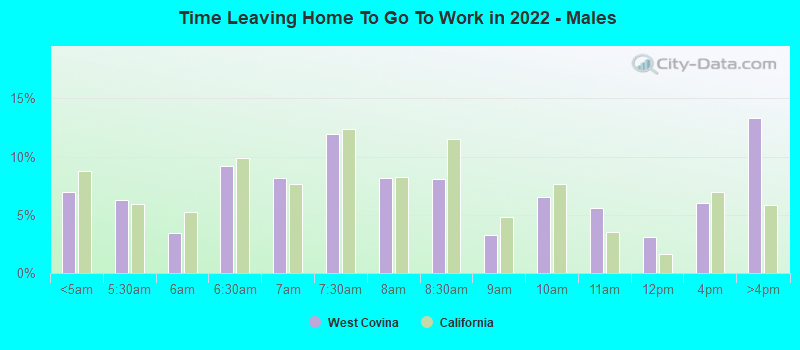
12:00 a.m. to 4:59 a.m. - Males:
| West Covina: | 6.9% (1,451) |
| California: | 8.7% (747,612) |
5:00 a.m. to 5:29 a.m. - Males:
| West Covina: | 6.3% (1,314) |
| California: | 6.0% (509,420) |
5:30 a.m. to 5:59 a.m. - Males:
| West Covina: | 3.4% (718) |
| California: | 5.2% (448,269) |
6:00 a.m. to 6:29 a.m. - Males:
| West Covina: | 9.2% (1,927) |
| California: | 9.8% (842,941) |
6:30 a.m. to 6:59 a.m. - Males:
| West Covina: | 8.2% (1,705) |
| California: | 7.7% (657,557) |
7:00 a.m. to 7:29 a.m. - Males:
| West Covina: | 11.9% (2,495) |
| California: | 12.4% (1,058,532) |
7:30 a.m. to 7:59 a.m. - Males:
| West Covina: | 8.2% (1,712) |
| California: | 8.2% (702,727) |
8:00 a.m. to 8:29 a.m. - Males:
| West Covina: | 8.1% (1,693) |
| California: | 11.5% (984,538) |
8:30 a.m. to 8:59 a.m. - Males:
| West Covina: | 3.3% (680) |
| California: | 4.8% (414,815) |
9:00 a.m. to 9:59 a.m. - Males:
| West Covina: | 6.5% (1,363) |
| California: | 7.7% (655,038) |
10:00 a.m. to 10:59 a.m. - Males:
| West Covina: | 5.6% (1,165) |
| California: | 3.5% (301,425) |
11:00 a.m. to 11:59 a.m. - Males:
| West Covina: | 3.1% (650) |
| California: | 1.7% (141,620) |
12:00 p.m. to 3:59 p.m. - Males:
| West Covina: | 6.0% (1,253) |
| California: | 7.0% (594,847) |
4:00 p.m. to 11:59 p.m. - Males:
| West Covina: | 13.3% (2,775) |
| California: | 5.8% (499,471) |
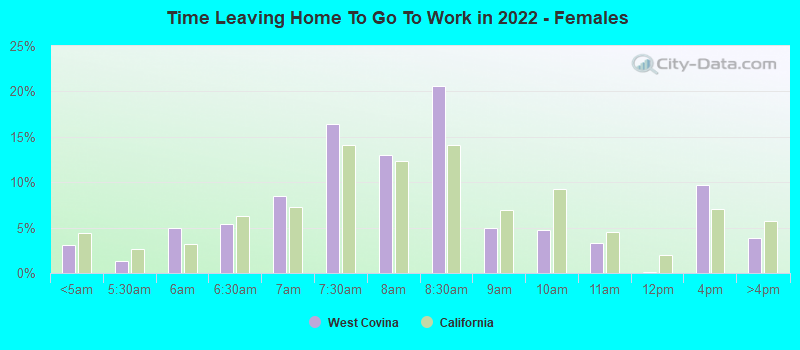
12:00 a.m. to 4:59 a.m. - Females:
| West Covina: | 3.1% (632) |
| California: | 4.4% (303,290) |
5:00 a.m. to 5:29 a.m. - Females:
| West Covina: | 1.3% (272) |
| California: | 2.7% (183,352) |
5:30 a.m. to 5:59 a.m. - Females:
| West Covina: | 5.0% (1,017) |
| California: | 3.2% (217,206) |
6:00 a.m. to 6:29 a.m. - Females:
| West Covina: | 5.5% (1,120) |
| California: | 6.3% (430,647) |
6:30 a.m. to 6:59 a.m. - Females:
| West Covina: | 8.5% (1,738) |
| California: | 7.3% (498,781) |
7:00 a.m. to 7:29 a.m. - Females:
| West Covina: | 16.5% (3,381) |
| California: | 14.1% (969,170) |
7:30 a.m. to 7:59 a.m. - Females:
| West Covina: | 13.0% (2,667) |
| California: | 12.4% (847,675) |
8:00 a.m. to 8:29 a.m. - Females:
| West Covina: | 20.6% (4,223) |
| California: | 14.1% (969,448) |
8:30 a.m. to 8:59 a.m. - Females:
| West Covina: | 5.0% (1,021) |
| California: | 6.9% (476,135) |
9:00 a.m. to 9:59 a.m. - Females:
| West Covina: | 4.7% (972) |
| California: | 9.2% (633,461) |
10:00 a.m. to 10:59 a.m. - Females:
| West Covina: | 3.3% (686) |
| California: | 4.5% (311,768) |
11:00 a.m. to 11:59 a.m. - Females:
| West Covina: | 0.1% (29) |
| California: | 2.0% (139,355) |
12:00 p.m. to 3:59 p.m. - Females:
| West Covina: | 9.7% (2,000) |
| California: | 7.0% (480,658) |
4:00 p.m. to 11:59 p.m. - Females:
| West Covina: | 3.8% (785) |
| California: | 5.7% (391,769) |
Travel time to work
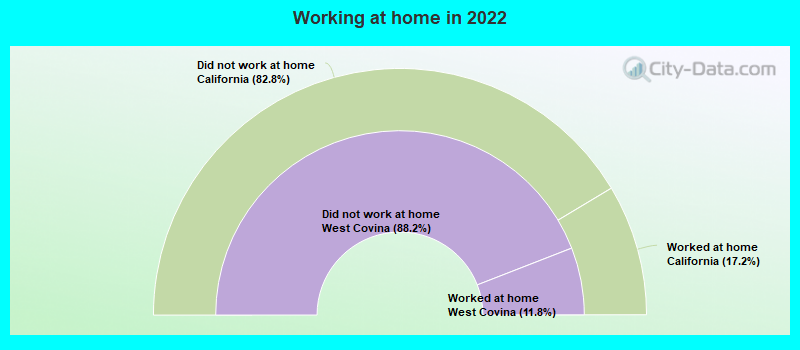
Percentage of workers working in this county: 91.6%
Number of people working at home: 4,720 (9.2% of all workers)
Daytime population change due to commuting: -19,812 (-18.9%)
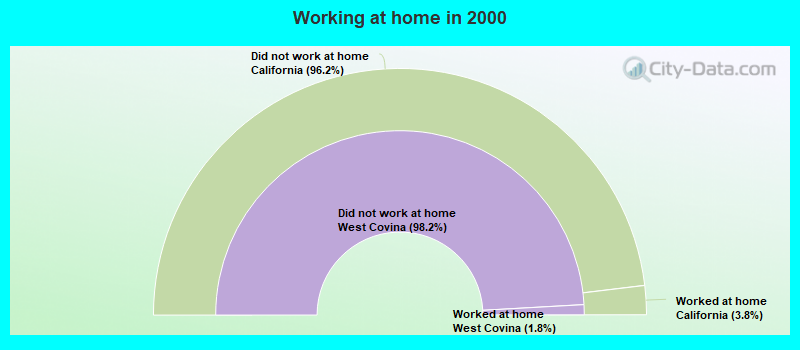
Workers who live and work in this city: 5,215 (11.9%)
Number of people working at home: 4,720 (9.2% of all workers)
Daytime population change due to commuting: -19,812 (-18.9%)
Workers who live and work in this city: 5,215 (11.9%)
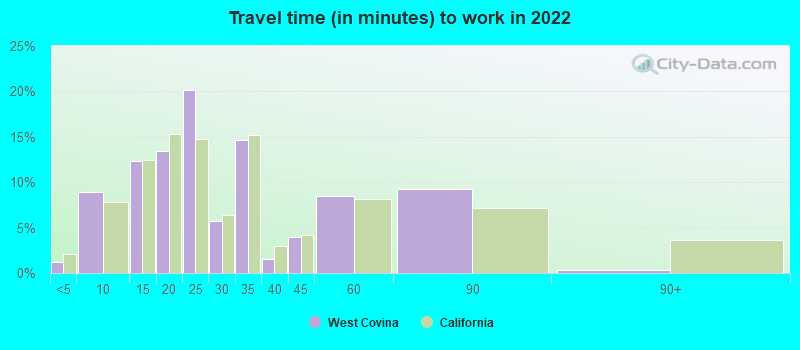
Less than 5 minutes:
| West Covina: | 1.2% (319) |
| California: | 2.1% (323,064) |
5 to 9 minutes:
| West Covina: | 8.9% (2,418) |
| California: | 7.8% (1,208,682) |
10 to 14 minutes:
| West Covina: | 12.3% (3,338) |
| California: | 12.4% (1,917,610) |
15 to 19 minutes:
| West Covina: | 13.4% (3,644) |
| California: | 15.3% (2,367,483) |
20 to 24 minutes:
| West Covina: | 20.2% (5,477) |
| California: | 14.8% (2,279,693) |
25 to 29 minutes:
| West Covina: | 5.8% (1,564) |
| California: | 6.4% (981,997) |
30 to 34 minutes:
| West Covina: | 14.7% (3,975) |
| California: | 15.2% (2,339,223) |
35 to 39 minutes:
| West Covina: | 1.5% (403) |
| California: | 2.9% (453,226) |
40 to 44 minutes:
| West Covina: | 4.0% (1,088) |
| California: | 4.1% (637,781) |
45 to 59 minutes:
| West Covina: | 8.5% (2,302) |
| California: | 8.2% (1,259,482) |
60 to 89 minutes:
| West Covina: | 9.2% (2,502) |
| California: | 7.2% (1,111,698) |
90 or more minutes:
| West Covina: | 0.3% (87) |
| California: | 3.6% (552,805) |
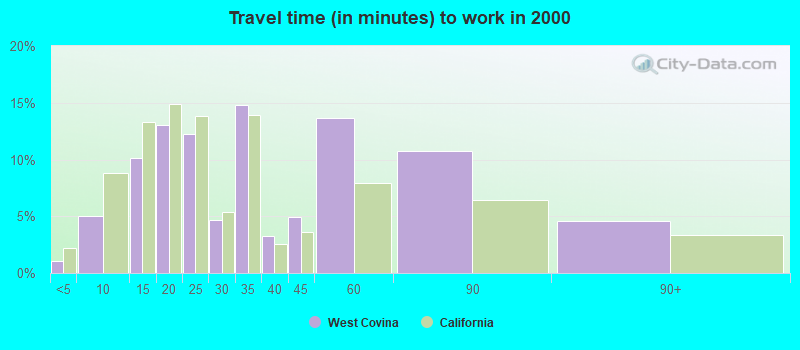
Less than 5 minutes:
| West Covina: | 1.0% (458) |
| California: | 2.2% (324,703) |
5 to 9 minutes:
| West Covina: | 5.0% (2,191) |
| California: | 8.8% (1,280,443) |
10 to 14 minutes:
| West Covina: | 10.1% (4,455) |
| California: | 13.3% (1,930,263) |
15 to 19 minutes:
| West Covina: | 13.1% (5,741) |
| California: | 14.9% (2,157,970) |
20 to 24 minutes:
| West Covina: | 12.3% (5,403) |
| California: | 13.8% (2,004,060) |
25 to 29 minutes:
| West Covina: | 4.7% (2,060) |
| California: | 5.4% (782,241) |
30 to 34 minutes:
| West Covina: | 14.8% (6,526) |
| California: | 13.9% (2,025,657) |
35 to 39 minutes:
| West Covina: | 3.3% (1,445) |
| California: | 2.5% (366,487) |
40 to 44 minutes:
| West Covina: | 4.9% (2,170) |
| California: | 3.6% (528,043) |
45 to 59 minutes:
| West Covina: | 13.7% (6,013) |
| California: | 7.9% (1,151,598) |
60 to 89 minutes:
| West Covina: | 10.7% (4,713) |
| California: | 6.4% (933,123) |
90 or more minutes:
| West Covina: | 4.6% (2,019) |
| California: | 3.3% (483,698) |
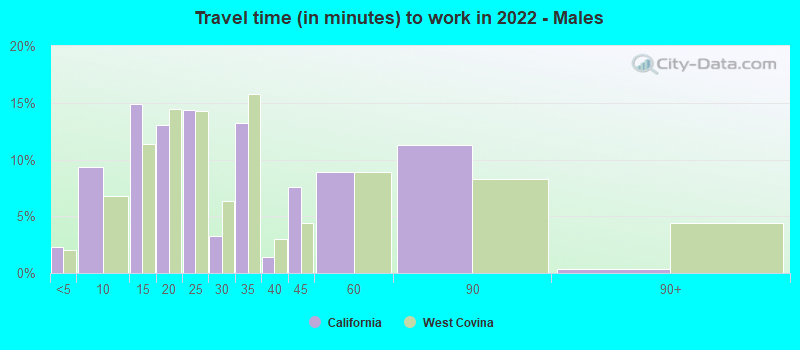
Less than 5 minutes - Males:
| West Covina: | 2.3% (274) |
| California: | 2.0% (173,603) |
5 to 9 minutes - Males:
| West Covina: | 9.4% (1,113) |
| California: | 6.8% (580,822) |
10 to 14 minutes - Males:
| West Covina: | 14.9% (1,767) |
| California: | 11.4% (974,497) |
15 to 19 minutes - Males:
| West Covina: | 13.1% (1,554) |
| California: | 14.5% (1,239,386) |
20 to 24 minutes - Males:
| West Covina: | 14.4% (1,707) |
| California: | 14.3% (1,223,429) |
25 to 29 minutes - Males:
| West Covina: | 3.2% (383) |
| California: | 6.4% (545,844) |
30 to 34 minutes - Males:
| West Covina: | 13.2% (1,574) |
| California: | 15.8% (1,352,210) |
35 to 39 minutes - Males:
| West Covina: | 1.4% (170) |
| California: | 3.0% (253,732) |
40 to 44 minutes - Males:
| West Covina: | 7.6% (899) |
| California: | 4.4% (376,144) |
45 to 59 minutes - Males:
| West Covina: | 8.9% (1,059) |
| California: | 8.9% (762,659) |
60 to 89 minutes - Males:
| West Covina: | 11.3% (1,346) |
| California: | 8.3% (711,394) |
90 or more minutes - Males:
| West Covina: | 0.4% (45) |
| California: | 4.4% (378,954) |
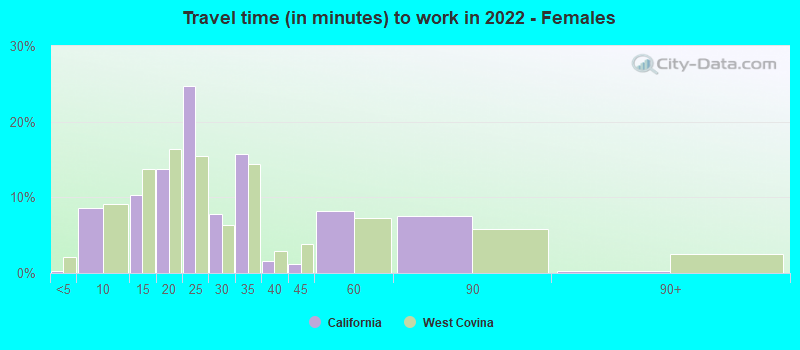
Less than 5 minutes - Females:
| West Covina: | 0.3% (45) |
| California: | 2.2% (149,461) |
5 to 9 minutes - Females:
| West Covina: | 8.6% (1,305) |
| California: | 9.2% (627,860) |
10 to 14 minutes - Females:
| West Covina: | 10.3% (1,571) |
| California: | 13.7% (943,113) |
15 to 19 minutes - Females:
| West Covina: | 13.7% (2,090) |
| California: | 16.4% (1,128,097) |
20 to 24 minutes - Females:
| West Covina: | 24.8% (3,770) |
| California: | 15.4% (1,056,264) |
25 to 29 minutes - Females:
| West Covina: | 7.8% (1,181) |
| California: | 6.4% (436,153) |
30 to 34 minutes - Females:
| West Covina: | 15.8% (2,401) |
| California: | 14.4% (987,013) |
35 to 39 minutes - Females:
| West Covina: | 1.5% (233) |
| California: | 2.9% (199,494) |
40 to 44 minutes - Females:
| West Covina: | 1.2% (189) |
| California: | 3.8% (261,637) |
45 to 59 minutes - Females:
| West Covina: | 8.2% (1,243) |
| California: | 7.2% (496,823) |
60 to 89 minutes - Females:
| West Covina: | 7.6% (1,156) |
| California: | 5.8% (400,304) |
90 or more minutes - Females:
| West Covina: | 0.3% (42) |
| California: | 2.5% (173,851) |
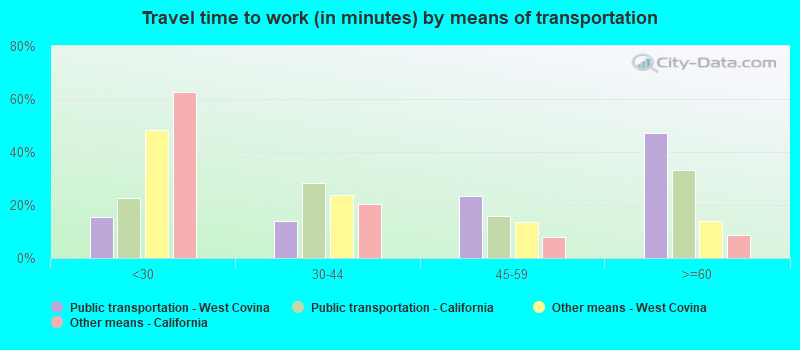
Means of transportation to work
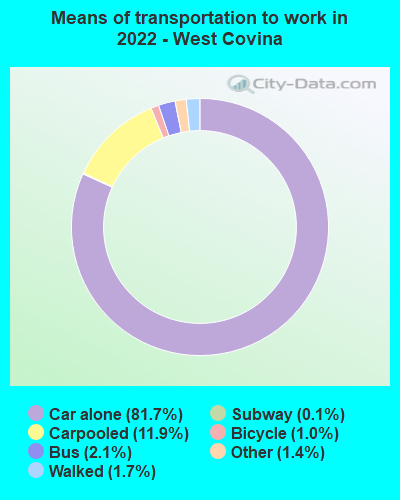

Drove car alone:
| West Covina: | 81.7% (21,033) |
| California: | 79.1% (5,345,368) |
Carpooled:
| West Covina: | 11.9% (3,062) |
| California: | 11.9% (878,699) |
Bus:
| West Covina: | 2.1% (535) |
| California: | 2.2% (170,574) |
Subway or elevated rail:
| West Covina: | 0.0% (7) |
| California: | 0.6% (40,665) |
Long-distance train or commuter rail:
| West Covina: | 0.1% (27) |
| California: | 0.2% (16,750) |
Ferryboat:
| West Covina: | 0.1% (17) |
| California: | 0.1% (3,989) |
Bicycle:
| West Covina: | 1.0% (264) |
| California: | 0.9% (39,197) |
Walked:
| West Covina: | 1.7% (427) |
| California: | 2.9% (218,374) |
Other means:
| West Covina: | 1.4% (373) |
| California: | 2.1% (137,489) |
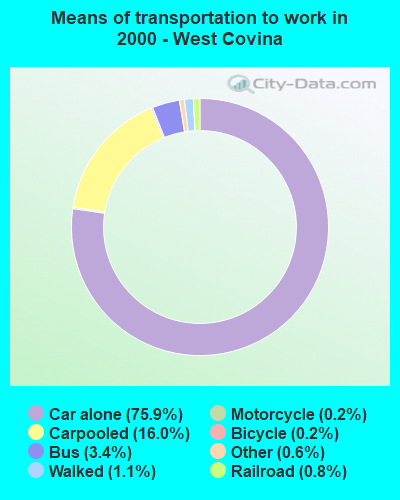

Drove car alone:
| West Covina: | 75.9% (33,364) |
| California: | 71.8% (10,432,462) |
Carpooled:
| West Covina: | 16.0% (7,037) |
| California: | 14.5% (2,113,313) |
Bus or trolley bus:
| West Covina: | 3.4% (1,480) |
| California: | 3.8% (549,425) |
Streetcar or trolley car:
| West Covina: | 0.1% (32) |
| California: | 0.1% (21,158) |
Subway or elevated:
| West Covina: | 0.1% (35) |
| California: | 0.7% (107,711) |
Railroad:
| West Covina: | 0.8% (333) |
| California: | 0.3% (41,022) |
Taxicab:
| West Covina: | 0.0% (18) |
| California: | 0.1% (9,890) |
Motorcycle:
| West Covina: | 0.2% (90) |
| California: | 0.2% (36,262) |
Bicycle:
| West Covina: | 0.2% (90) |
| California: | 0.8% (120,567) |
Walked:
| West Covina: | 1.1% (470) |
| California: | 2.9% (414,581) |
Other means:
| West Covina: | 0.6% (245) |
| California: | 0.8% (115,064) |
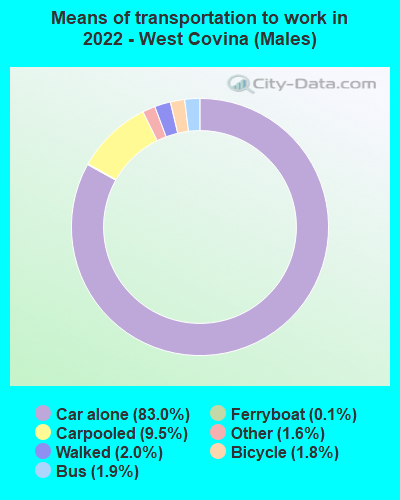

Drove car alone - Males:
| West Covina: | 83.0% (9,595) |
| California: | 80.0% (5,345,368) |
Carpooled - Males:
| West Covina: | 9.5% (1,096) |
| California: | 11.1% (878,699) |
Bus - Males:
| West Covina: | 1.9% (222) |
| California: | 2.0% (170,574) |
Subway or elevated rail - Males:
| West Covina: | 0.1% (7) |
| California: | 0.5% (40,665) |
Ferryboat - Males:
| West Covina: | 0.1% (17) |
| California: | 0.1% (3,989) |
Bicycle - Males:
| West Covina: | 1.8% (208) |
| California: | 1.1% (39,197) |
Walked - Males:
| West Covina: | 2.0% (230) |
| California: | 2.7% (218,374) |
Other means - Males:
| West Covina: | 1.6% (186) |
| California: | 2.1% (137,489) |
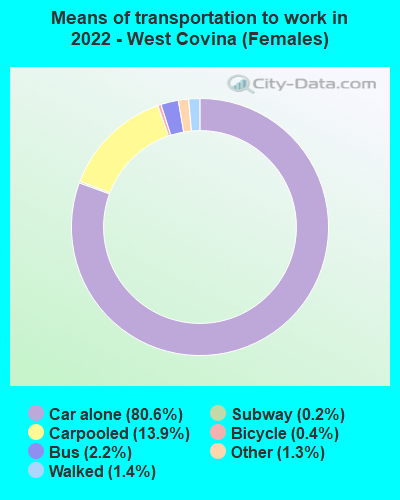

Drove car alone - Females:
| West Covina: | 80.6% (11,453) |
| California: | 77.9% (5,345,368) |
Carpooled - Females:
| West Covina: | 13.9% (1,971) |
| California: | 12.8% (878,699) |
Bus - Females:
| West Covina: | 2.2% (314) |
| California: | 2.5% (170,574) |
Long-distance train or commuter rail - Females:
| West Covina: | 0.2% (27) |
| California: | 0.2% (16,750) |
Bicycle - Females:
| West Covina: | 0.4% (55) |
| California: | 0.6% (39,197) |
Walked - Females:
| West Covina: | 1.4% (197) |
| California: | 3.2% (218,374) |
Other means - Females:
| West Covina: | 1.3% (187) |
| California: | 2.0% (137,489) |
Private vehicle occupancy
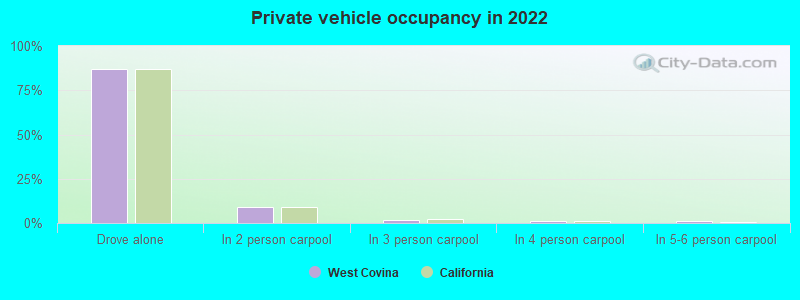
Drove alone:
| West Covina: | 87.1% (36,796) |
| California: | 86.9% (12,187,486) |
In 2 person carpool:
| West Covina: | 8.8% (3,713) |
| California: | 9.2% (1,295,561) |
In 3 person carpool:
| West Covina: | 1.7% (697) |
| California: | 2.2% (309,969) |
In 4 person carpool:
| West Covina: | 1.0% (410) |
| California: | 0.9% (126,987) |
In 5-6 person carpool:
| West Covina: | 1.0% (422) |
| California: | 0.5% (70,825) |
In 7+ person carpool:
| West Covina: | 0.5% (224) |
| California: | 0.2% (28,258) |
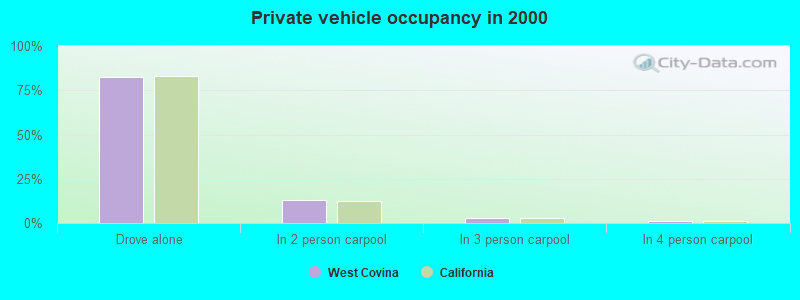
Drove alone:
| West Covina: | 82.6% (33,364) |
| California: | 83.2% (10,432,462) |
In 2 person carpool:
| West Covina: | 12.9% (5,228) |
| California: | 12.5% (1,564,905) |
In 3 person carpool:
| West Covina: | 2.7% (1,089) |
| California: | 2.6% (330,732) |
In 4 person carpool:
| West Covina: | 1.0% (411) |
| California: | 1.0% (119,364) |
In 5-6 person carpool:
| West Covina: | 0.4% (172) |
| California: | 0.5% (57,036) |
In 7+ person carpool:
| West Covina: | 0.3% (137) |
| California: | 0.3% (41,276) |
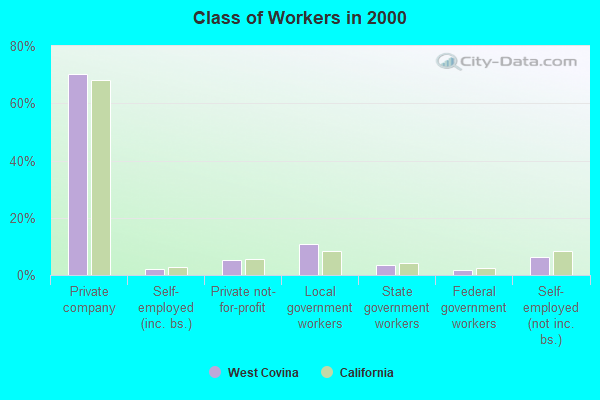
Class of workers
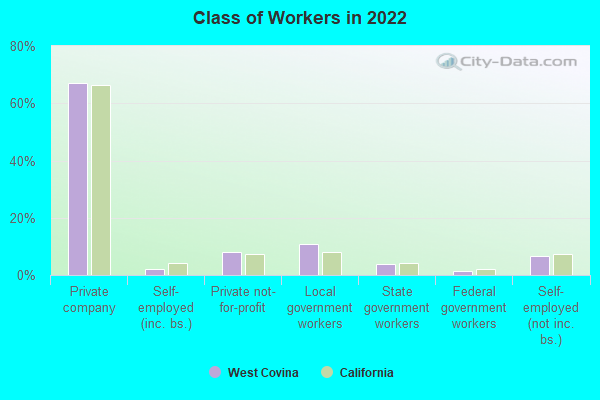
Employee of private company:
| West Covina: | 67.2% (32,471) |
| California: | 66.5% (12,596,030) |
Self-employed in own incorporated business:
| West Covina: | 2.0% (968) |
| California: | 4.1% (784,709) |
Private not-for-profit wage and salary workers:
| West Covina: | 8.1% (3,935) |
| California: | 7.5% (1,417,407) |
Local government workers:
| West Covina: | 10.7% (5,152) |
| California: | 8.2% (1,547,056) |
State government workers:
| West Covina: | 3.7% (1,796) |
| California: | 4.1% (780,915) |
Federal government workers:
| West Covina: | 1.3% (640) |
| California: | 2.0% (369,858) |
Self-employed workers in own not incorporated business:
| West Covina: | 6.7% (3,213) |
| California: | 7.4% (1,410,735) |
Unpaid family workers:
| West Covina: | 0.2% (119) |
| California: | 0.2% (36,267) |
Employee of private company:
| West Covina: | 70.1% (31,503) |
| California: | 68.0% (10,009,465) |
Self-employed in own incorporated business:
| West Covina: | 2.0% (920) |
| California: | 2.7% (402,392) |
Private not-for-profit wage and salary workers:
| West Covina: | 5.4% (2,433) |
| California: | 5.7% (845,536) |
Local government workers:
| West Covina: | 10.7% (4,828) |
| California: | 8.3% (1,218,764) |
State government workers:
| West Covina: | 3.4% (1,545) |
| California: | 4.0% (594,953) |
Federal government workers:
| West Covina: | 1.9% (850) |
| California: | 2.3% (344,354) |
Self-employed workers in own not incorporated business:
| West Covina: | 6.1% (2,754) |
| California: | 8.5% (1,249,530) |
Unpaid family workers:
| West Covina: | 0.3% (136) |
| California: | 0.4% (53,934) |
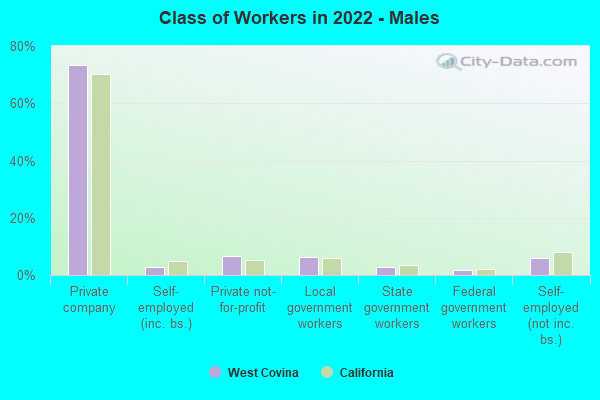
Employee of private company - Males:
| West Covina: | 73.5% (17,656) |
| California: | 70.3% (7,191,252) |
Self-employed in own incorporated business - Males:
| West Covina: | 2.7% (658) |
| California: | 4.9% (504,764) |
Private not-for-profit wage and salary workers - Males:
| West Covina: | 6.6% (1,595) |
| California: | 5.2% (529,122) |
Local government workers - Males:
| West Covina: | 6.3% (1,512) |
| California: | 6.0% (610,331) |
State government workers - Males:
| West Covina: | 2.9% (699) |
| California: | 3.4% (343,636) |
Federal government workers - Males:
| West Covina: | 1.6% (380) |
| California: | 2.1% (209,874) |
Self-employed workers in own not incorporated business - Males:
| West Covina: | 5.9% (1,415) |
| California: | 8.1% (824,359) |
Unpaid family workers - Males:
| West Covina: | 0.5% (119) |
| California: | 0.2% (17,922) |
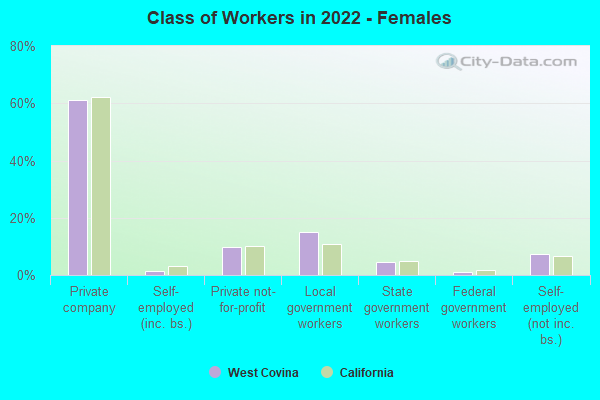
Employee of private company - Females:
| West Covina: | 61.1% (14,815) |
| California: | 62.0% (5,404,778) |
Self-employed in own incorporated business - Females:
| West Covina: | 1.3% (310) |
| California: | 3.2% (279,945) |
Private not-for-profit wage and salary workers - Females:
| West Covina: | 9.6% (2,340) |
| California: | 10.2% (888,285) |
Local government workers - Females:
| West Covina: | 15.0% (3,640) |
| California: | 10.8% (936,725) |
State government workers - Females:
| West Covina: | 4.5% (1,097) |
| California: | 5.0% (437,279) |
Federal government workers - Females:
| West Covina: | 1.1% (260) |
| California: | 1.8% (159,984) |
Self-employed workers in own not incorporated business - Females:
| West Covina: | 7.4% (1,798) |
| California: | 6.7% (586,376) |