West Contra Costa, CA (California) Houses and Residents
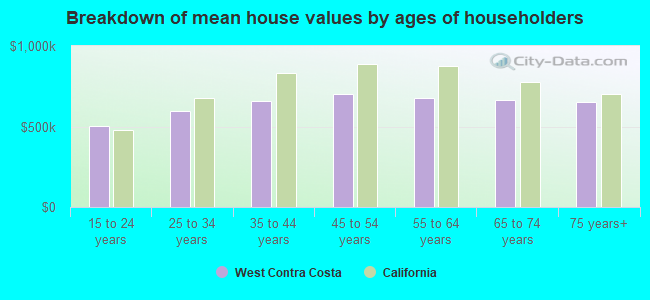
| West Contra Costa: | $662,825 |
| California: | $715,900 |
Total population: 250,207 (Urban population: 233,885, Rural population: 2,123 (all nonfarm))
Houses: 86,004 (83,291 occupied: 50,448 owner occupied, 32,843 renter occupied)
| % of renters here: | 39% |
| State: | 44% |
Housing density: 1,263 houses/condos per square mile
Median price asked for vacant for-sale houses and condos in 2022 in this county: $378,161.
Median contract rent in 2022: $1,715 (lower quartile is $1,300, upper quartile is over $2,000)
Median rent asked for vacant for-rent units in 2022: $1,839
Median gross rent in West Contra Costa, CA in 2022: $1,943
Housing units in West Contra Costa with a mortgage: 34,015 (4,664 second mortgage, 3,361 home equity loan, 155 both second mortgage and home equity loan)
Houses without a mortgage: 11,194
Compare current foreclosures near West Contra Costa, CA:
| Photo | Address | Area | Beds / Baths | Price | Details |
|---|---|---|---|---|---|

|
#1
Thorndale Dr Apt 435
San Rafael, CA 94903
|
1,096 sq. feet
|
2 baths 2 beds |
$149,900
|
show details |

|
#2
Macarthur Blvd
Oakland, CA 94605
|
1,313 sq. feet
|
3 baths 3 beds |
$599,000
|
show details |

|
#3
Seminary Ave
Oakland, CA 94605
|
1,552 sq. feet
|
1 baths 3 beds |
$556,400
|
show details |

|
#4
Catalina Dr
Hercules, CA 94547
|
2,518 sq. feet
|
3 baths 5 beds |
$868,400
|
show details |

|
#5
Hastings Ave
Vallejo, CA 94589
|
1,104 sq. feet
|
2 baths 3 beds |
$529,000
|
show details |

|
#6
2nd St
Richmond, CA 94801
|
887 sq. feet
|
1 baths 3 beds |
$349,900
|
show details |

|
#7
Limestone Dr
Vallejo, CA 94589
|
1,677 sq. feet
|
2 baths 4 beds |
$609,000
|
show details |

|
#8
Christie Ave
Emeryville, CA 94608
|
634 sq. feet
|
1 baths 1 beds |
$350,000
|
show details |

|
#9
Kelsey St
Richmond, CA 94801
|
1,080 sq. feet
|
3 baths 4 beds |
show details | |

|
#10
El Portal Dr Apt D
San Pablo, CA 94806
|
1,058 sq. feet
|
2 baths 2 beds |
show details |
| Photo | Address | Area | Beds / Baths | Price | Details |
|---|---|---|---|---|---|

|
#11
21st St
San Pablo, CA 94806
|
1,665 sq. feet
|
2 baths 3 beds |
show details | |

|
#12
Mohr Ln Apt C
Concord, CA 94518
|
870 sq. feet
|
1 baths 2 beds |
show details | |

|
#13
Quesada Ave
San Francisco, CA 94124
|
2,220 sq. feet
|
4 baths 10 beds |
show details | |

|
#14
Macarthur Blvd
Oakland, CA 94605
|
1,904 sq. feet
|
1 baths 4 beds |
show details | |

|
#15
Bryant St San Francisco, Ca 94105 Aka 38 Bryant St #809
San Francisco, CA 94105
|
722 sq. feet
|
1 baths 1 beds |
show details | |

|
#16
California Ave
San Pablo, CA 94806
|
805 sq. feet
|
1 baths 2 beds |
show details | |

|
#17
Sequoia Valley Rd
Mill Valley, CA 94941
|
2,177 sq. feet
|
2 baths 3 beds |
show details | |

|
#18
Outlook Ave
Oakland, CA 94605
|
1,305 sq. feet
|
3 baths 4 beds |
show details | |

|
#19
Leslie Ave
Martinez, CA 94553
|
1,006 sq. feet
|
1 baths 2 beds |
show details | |

|
#20
Leslie Ave
Martinez, CA 94553
|
1,006 sq. feet
|
1 baths 2 beds |
show details |
| Photo | Address | Area | Beds / Baths | Price | Details |
|---|---|---|---|---|---|

|
#21
Olima St
Sausalito, CA 94965
|
- sq. feet
|
2 baths 4 beds |
show details | |

|
#22
Rain Cloud Dr
El Sobrante, CA 94803
|
2,235 sq. feet
|
3 baths 4 beds |
show details | |

|
#23
Lacey Ave
Oakland, CA 94605
|
- sq. feet
|
1 baths 3 beds |
show details | |

|
#24
Vistamont Ave
Berkeley, CA 94708
|
1,381 sq. feet
|
1 baths 3 beds |
show details | |

|
#25
83rd Ave
Oakland, CA 94621
|
1,304 sq. feet
|
1 baths 3 beds |
show details | |

|
#26
California Ave
Mill Valley, CA 94941
|
2,678 sq. feet
|
3 baths 3 beds |
show details | |

|
#27
82nd Ave
Oakland, CA 94621
|
926 sq. feet
|
1 baths 2 beds |
show details | |

|
#28
Duperu Dr
Crockett, CA 94525
|
2,476 sq. feet
|
3 baths 4 beds |
show details | |

|
#29
72nd Ave
Oakland, CA 94621
|
1,170 sq. feet
|
2 baths 3 beds |
show details | |

|
#30
Eureka Ave
El Cerrito, CA 94530
|
1,700 sq. feet
|
2 baths 3 beds |
show details |
| Photo | Address | Area | Beds / Baths | Price | Details |
|---|---|---|---|---|---|

|
#31
Sunny Cove Dr
Novato, CA 94949
|
2,568 sq. feet
|
2 baths 4 beds |
show details | |

|
#32
El Dorado Ave
Berkeley, CA 94707
|
2,370 sq. feet
|
2 baths 4 beds |
show details | |

|
#33
Los Angeles St
Emeryville, CA 94608
|
803 sq. feet
|
1 baths 2 beds |
show details | |

|
#34
Davis St
Oakland, CA 94601
|
1,408 sq. feet
|
2 baths 3 beds |
show details | |

|
#35
Solano Way
Concord, CA 94520
|
1,470 sq. feet
|
2 baths 3 beds |
show details | |

|
#36
Carberry Ave
Oakland, CA 94609
|
2,832 sq. feet
|
3 baths 4 beds |
show details | |

|
#37
Greenwich St Apt 3
San Francisco, CA 94109
|
998 sq. feet
|
1 baths 1 beds |
show details | |

|
#38
S 37th St
Richmond, CA 94804
|
1,352 sq. feet
|
1 baths 2 beds |
show details | |

|
#39
83rd Ave
Oakland, CA 94605
|
1,325 sq. feet
|
1 baths 3 beds |
show details | |

|
#40
Crucero Ave
San Pablo, CA 94806
|
1,264 sq. feet
|
2 baths 3 beds |
show details |
| Photo | Address | Area | Beds / Baths | Price | Details |
|---|---|---|---|---|---|

|
#41
Paul Ct
Benicia, CA 94510
|
2,099 sq. feet
|
3 baths 4 beds |
show details | |

|
#42
Daniels Ave
Vallejo, CA 94590
|
1,782 sq. feet
|
2 baths 4 beds |
show details | |

|
#43
86th Ave
Oakland, CA 94621
|
835 sq. feet
|
1 baths 2 beds |
show details | |

|
#44
Merion Ter
Moraga, CA 94556
|
1,708 sq. feet
|
2 baths 3 beds |
show details | |

|
#45
Caldecott Ln Unit 312
Oakland, CA 94618
|
1,095 sq. feet
|
2 baths 2 beds |
show details | |

|
#46
Jane Ct
Martinez, CA 94553
|
1,121 sq. feet
|
2 baths 3 beds |
show details | |

|
#47
-1725 7th Ave
San Francisco, CA 94122
|
2,376 sq. feet
|
2 baths 4 beds |
show details | |

|
#48
Thresher Dr
Vallejo, CA 94591
|
1,739 sq. feet
|
2 baths 4 beds |
show details | |

|
#49
Jouett Sq
Alameda, CA 94501
|
3,179 sq. feet
|
2 baths 3 beds |
show details | |

|
Check over 1 million property listings on Foreclosure.com!
|
browse all offers | |||

Household type by relationship:
Households: 1,038,711- In family households: 895,275 (185,206 male householders, 80,074 female householders)
199,021 spouses, 320,947 children (302,778 natural, 6,543 adopted, 11,626 stepchildren), 20,722 grandchildren, 14,424 brothers or sisters, 13,961 parents, foster children, 21,146 other relatives, 29,185 non-relatives
- In nonfamily households: 143,436 (48,395 male householders (34,478 living alone)), 61,689 female householders (50,577 living alone)), 33,352 nonrelatives
- In group quarters: 10,314 (5,346 institutionalized population)
175,577 married couples with children.
49,858 single-parent households (12,019 men, 37,839 women).
63.1% of residents of West Contra Costa speak English at home.
19.4% of residents speak Spanish at home (46% speak English very well, 24% speak English well, 21% speak English not well, 10% don't speak English at all).
4.3% of residents speak other Indo-European language at home (67% speak English very well, 21% speak English well, 9% speak English not well, 3% don't speak English at all).
12.2% of residents speak Asian or Pacific Island language at home (50% speak English very well, 30% speak English well, 16% speak English not well, 4% don't speak English at all).
1.0% of residents speak other language at home (71% speak English very well, 23% speak English well, 5% speak English not well, 1% don't speak English at all).
Foreign born population: 108,377 (37.7%)
(57.4% of them are naturalized citizens)
| Here: | 5.3 |
| State: | 6.0 |
| Here: | 4.2 |
| State: | 3.9 |
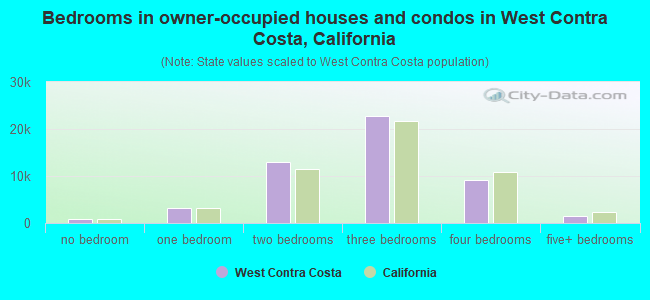
- Bedrooms in owner-occupied houses and condos in West Contra Costa, California
- 774no bedroom
- 3,2281 bedroom
- 13,0422 bedrooms
- 22,8453 bedrooms
- 9,1034 bedrooms
- 1,4565+ bedrooms
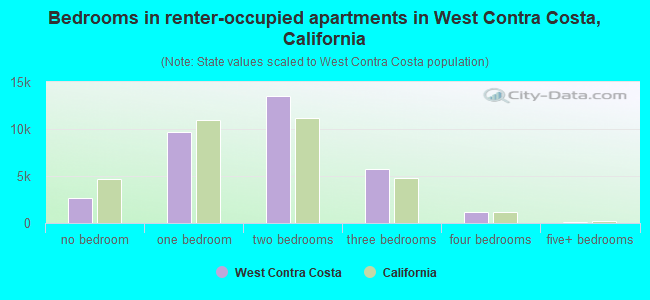
- Bedrooms in renter-occupied apartments in West Contra Costa, California
- 2,658no bedroom
- 9,6801 bedroom
- 13,4612 bedrooms
- 5,7213 bedrooms
- 1,2074 bedrooms
- 1165+ bedrooms
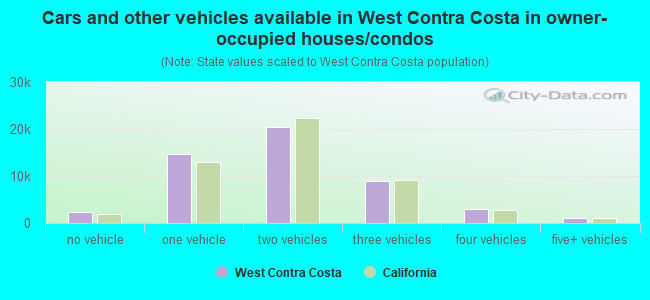
- Cars and other vehicles available in West Contra Costa in owner-occupied houses/condos
- 2,422no vehicle
- 14,7431 vehicle
- 20,3222 vehicles
- 8,9543 vehicles
- 2,9684 vehicles
- 1,0395+ vehicles
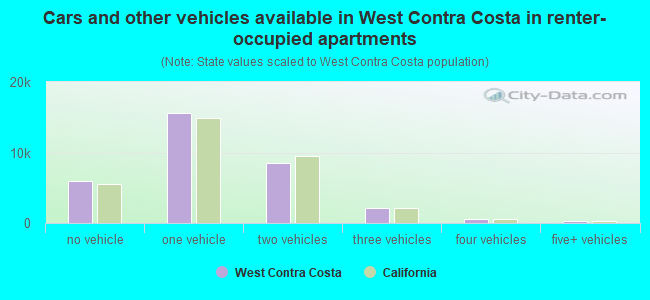
- Cars and other vehicles available in West Contra Costa in renter-occupied apartments
- 5,898no vehicle
- 15,5801 vehicle
- 8,4602 vehicles
- 2,0763 vehicles
- 5864 vehicles
- 2435+ vehicles
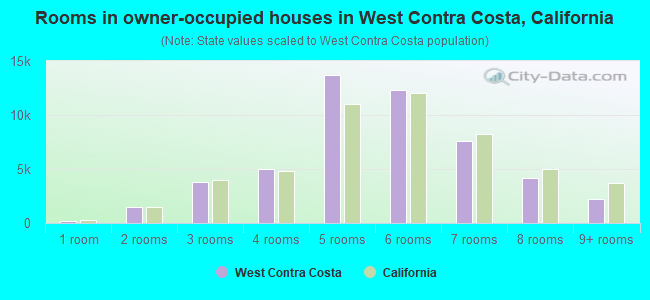
- Rooms in owner-occupied houses in West Contra Costa, California
- 2031 room
- 1,4722 rooms
- 3,7533 rooms
- 5,0154 rooms
- 13,7145 rooms
- 12,3126 rooms
- 7,6297 rooms
- 4,1548 rooms
- 2,1969+ rooms
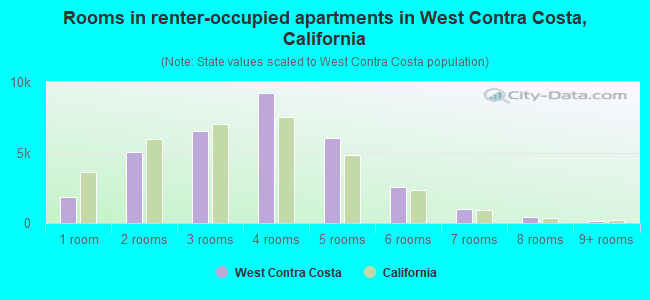
- Rooms in renter-occupied apartments in West Contra Costa, California
- 1,8701 room
- 5,0032 rooms
- 6,5033 rooms
- 9,2274 rooms
- 6,0625 rooms
- 2,5676 rooms
- 1,0287 rooms
- 4298 rooms
- 1549+ rooms
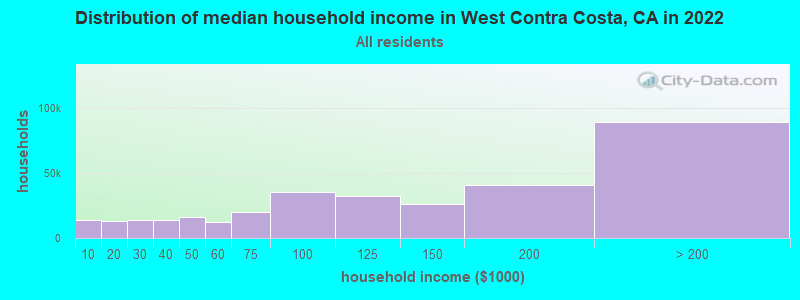
West Contra Costa, CA household income distribution

- 13,556Less than $10,000
- 12,864$10,000 to $19,999
- 14,012$20,000 to $29,999
- 13,734$30,000 to $39,999
- 16,034$40,000 to $49,999
- 12,116$50,000 to $59,999
- 19,863$60,000 to $74,999
- 35,373$75,000 to $99,999
- 32,160$100,000 to $124,999
- 26,263$125,000 to $149,999
- 40,891$150,000 to $199,999
- 89,323$200,000 or more
Percentage of workers working in this county: 48.3%
Number of people working at home: 26,739 (20.7% of all workers)
Travel time to work (commute)
- Less than 5 minutes: 1,308
- 5 to 9 minutes: 6,078
- 10 to 14 minutes: 9,368
- 15 to 19 minutes: 11,013
- 20 to 24 minutes: 11,450
- 25 to 29 minutes: 5,251
- 30 to 34 minutes: 15,991
- 35 to 39 minutes: 3,421
- 40 to 44 minutes: 5,588
- 45 to 59 minutes: 13,485
- 60 to 89 minutes: 12,069
- 90 or more minutes: 4,434
Means of transportation to work:
- Drove a car alone: 64,646 (63.0%)
- Carpooled: 19,089 (18.6%)
- Bus or trolley bus: 4,257 (4.1%)
- Streetcar or trolley car: 149 (0.1%)
- Subway or elevated: 7,226 (7.0%)
- Railroad: 384 (0.4%)
- Ferryboat: 76 (0.1%)
- Taxi: 176 (0.2%)
- Motorcycle: 238 (0.2%)
- Bicycle: 698 (0.7%)
- Walked: 1,526 (1.5%)
- Other means: 991 (1.0%)
- Worked at home: 3,176 (3.1%)
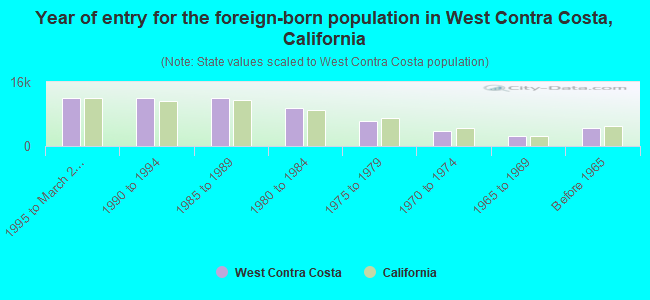
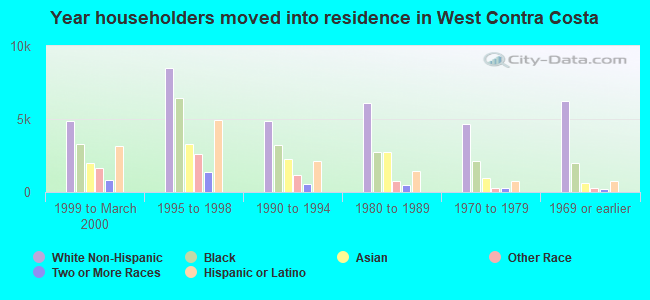
- Year of entry for the foreign-born population in West Contra Costa, California
- 12,0111995 to March 2000
- 12,0691990 to 1994
- 12,0971985 to 1989
- 9,3961980 to 1984
- 6,2061975 to 1979
- 3,7671970 to 1974
- 2,5641965 to 1969
- 4,575Before 1965
Most common places of birth for foreign-born residents (%):
| West Contra Costa: | 30.9% (19,349) |
| California: | 44.3% (3,928,701) |
| West Contra Costa: | 14.4% (9,005) |
| California: | 7.5% (664,935) |
| West Contra Costa: | 6.0% (3,747) |
| California: | 4.1% (359,673) |
| West Contra Costa: | 4.7% (2,968) |
| California: | 3.7% (327,611) |
| West Contra Costa: | 4.4% (2,742) |
| California: | 0.8% (68,306) |
| West Contra Costa: | 3.8% (2,367) |
| California: | 4.7% (418,249) |
| West Contra Costa: | 3.8% (2,361) |
| California: | 2.2% (198,201) |
| West Contra Costa: | 2.4% (1,504) |
| California: | 0.7% (64,411) |
| West Contra Costa: | 2.0% (1,279) |
| California: | 2.4% (211,458) |
| West Contra Costa: | 1.9% (1,171) |
| California: | 0.6% (53,250) |
| West Contra Costa: | 1.8% (1,123) |
| California: | 1.0% (91,101) |
| West Contra Costa: | 1.7% (1,058) |
| California: | 1.7% (151,775) |
| West Contra Costa: | 1.6% (974) |
| California: | 1.3% (112,212) |
Place of birth for U.S.-born residents:
- This state: 119,711
- Other state: 51,423
- Northeast: 8,186
- Midwest: 13,238
- South: 22,337
- West: 7,662
58% of West Contra Costa residents lived in the same house 5 years ago.
Out of people who lived in different houses, 52% lived in this county.
Out of people who lived in different counties, 85% lived in California.
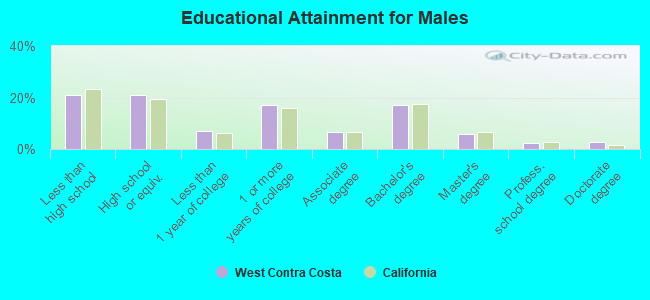
Education attainment for males 25 years and older:
- No schooling: 1,824
- Nursery to 4th grade: 765
- 5th and 6th grade: 2,099
- 7th and 8th grade: 1,768
- 9th grade: 1,563
- 10th grade: 1,536
- 11th grade: 1,752
- 12th grade, no diploma: 3,732
- High school graduate (or equivalency): 14,969
- Less than 1 year of college: 4,962
- Some college more than 1 year, no degree: 12,113
- Associate degree: 4,608
- Bachelor's degree: 12,181
- Master's degree: 4,116
- Professional school degree: 1,670
- Doctorate degree: 1,871
Education attainment for females 25 years and older:
- No schooling: 2,424
- Nursery to 4th grade: 877
- 5th and 6th grade: 2,296
- 7th and 8th grade: 2,046
- 9th grade: 1,419
- 10th grade: 1,573
- 11th grade: 2,127
- 12th grade, no diploma: 3,588
- High school graduate (or equivalency): 18,285
- Less than 1 year of college: 6,136
- Some college more than 1 year, no degree: 13,202
- Associate degree: 5,969
- Bachelor's degree: 13,502
- Master's degree: 5,560
- Professional school degree: 1,448
- Doctorate degree: 882

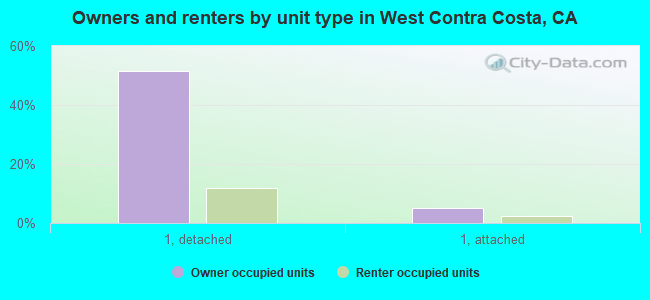
Housing units in structures:
- One, detached: 54,061
- One, attached: 6,510
- Two: 3,026
- 3 or 4: 6,700
- 5 to 9: 4,542
- 10 to 19: 3,176
- 20 to 49: 2,916
- 50 or more: 3,747
- Mobile homes: 1,200
- Boats, RVs, vans, etc.: 126
Median worth of mobile homes: $69,484
Housing units lacking complete kitchen facilities: 0.8%
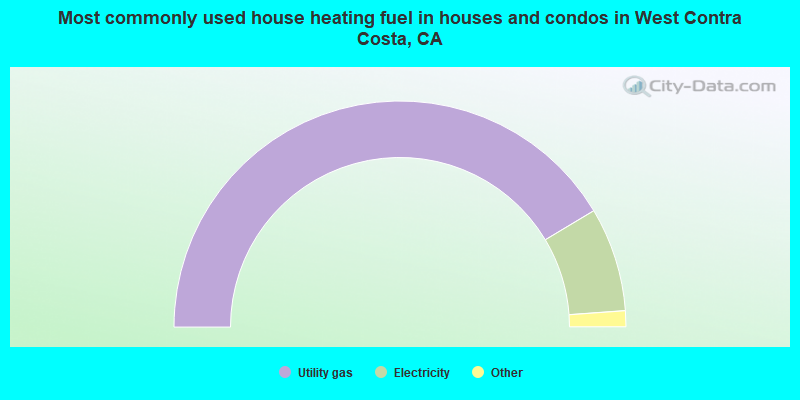
- 82.8%Utility gas
- 14.9%Electricity
- 1.1%Bottled, tank, or LP gas
- 0.8%Wood
- 0.2%No fuel used
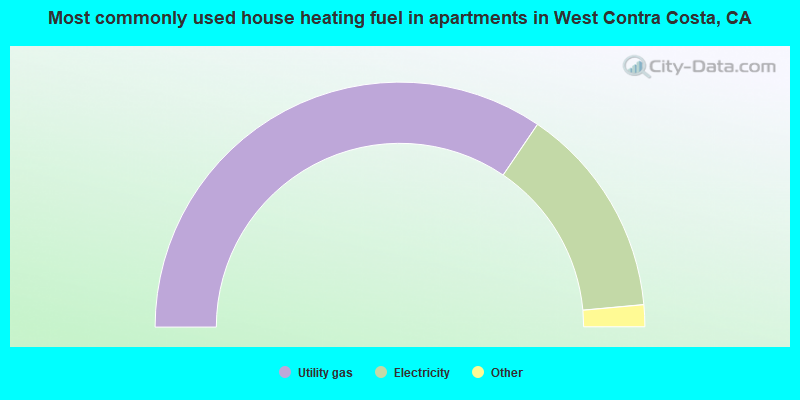
- 69.0%Utility gas
- 28.1%Electricity
- 1.4%Bottled, tank, or LP gas
- 0.8%No fuel used
- 0.3%Other fuel
- 0.2%Wood
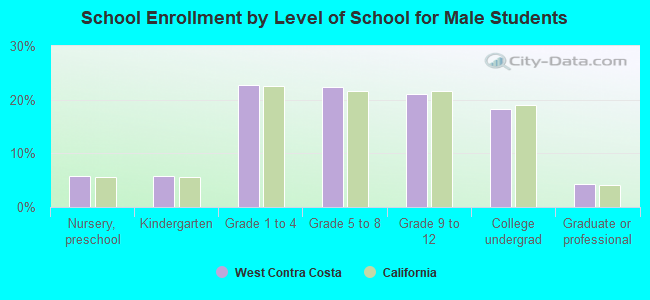
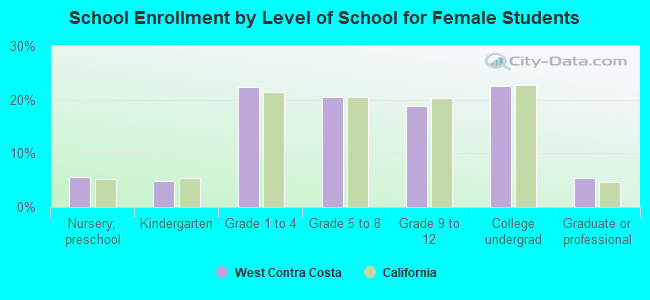
Private vs. public school enrollment:
| Here: | 14.0% |
| California: | 9.9% |
| Here: | 10.4% |
| California: | 7.8% |
| Here: | 13.5% |
| California: | 15.4% |