Work and Jobs in West Contra Costa, California (CA) Detailed Stats
Occupations, Industries, Unemployment, Workers, Commute
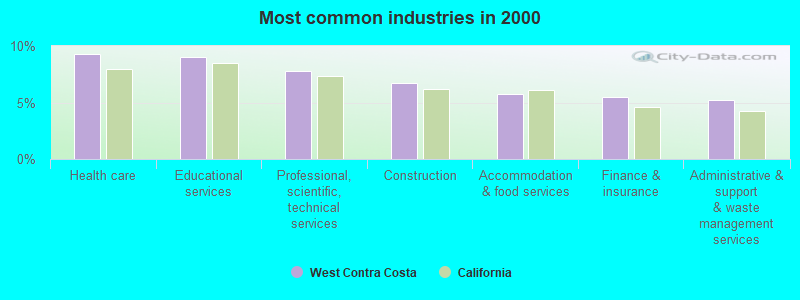
The most common industries in West Contra Costa are: Health care (9.3% of civilian employees), Educational services (9.0% of civilian employees), Professional, scientific, technical services (7.8% of civilian employees). 65.0% of workers are employees of private companies, which is 4.6% less than the rate of 68.0% across the entire state of California.
Most common industries
Most common industries | |||
|---|---|---|---|
Industry | All | Males | Females |
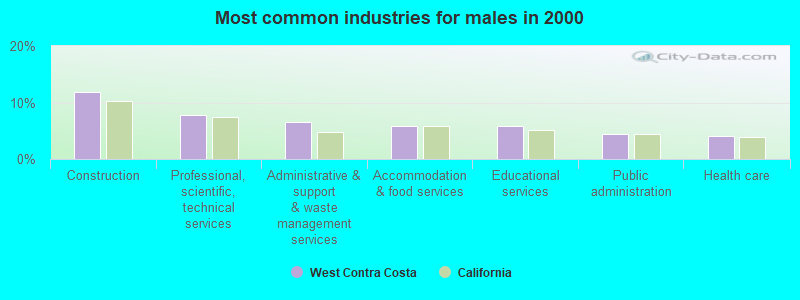
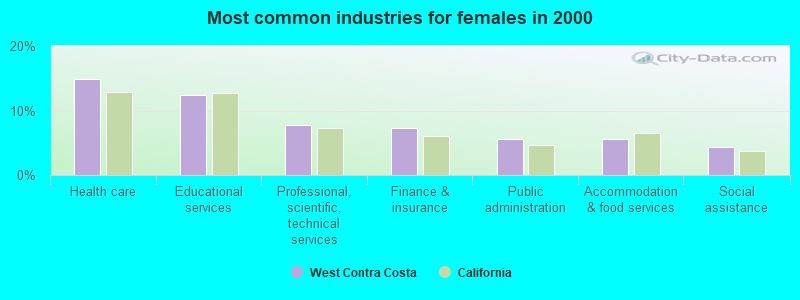
| Health care | 9.3% (9,814) | 4.0% (2,178) | 15.0% (7,636) |
| Educational services | 9.0% (9,500) | 5.9% (3,198) | 12.3% (6,302) |
| Professional, scientific, and technical services | 7.8% (8,195) | 7.8% (4,267) | 7.7% (3,928) |
| Construction | 6.8% (7,132) | 11.9% (6,488) | 1.3% (644) |
| Accommodation and food services | 5.8% (6,070) | 5.9% (3,211) | 5.6% (2,859) |
| Finance and insurance | 5.5% (5,757) | 3.7% (2,031) | 7.3% (3,726) |
| Administrative and support and waste management services | 5.2% (5,505) | 6.5% (3,527) | 3.9% (1,978) |
| Public administration | 5.0% (5,314) | 4.5% (2,448) | 5.6% (2,866) |
| Other transportation, and support activities, and couriers | 2.8% (2,946) | 3.9% (2,118) | 1.6% (828) |
| Food and beverage stores | 2.5% (2,656) | 2.7% (1,466) | 2.3% (1,190) |
| Social assistance | 2.5% (2,644) | 0.7% (403) | 4.4% (2,241) |
| Real estate and rental and leasing | 1.9% (2,024) | 1.8% (954) | 2.1% (1,070) |
| Repair and maintenance | 1.7% (1,832) | 2.9% (1,564) | 0.5% (268) |
| Arts, entertainment, and recreation | 1.7% (1,809) | 1.7% (936) | 1.7% (873) |
| U. S. Postal service | 1.6% (1,704) | 2.0% (1,065) | 1.3% (639) |
| Broadcasting and telecommunications | 1.6% (1,654) | 1.5% (820) | 1.6% (834) |
| Department and other general merchandise stores | 1.6% (1,652) | 1.2% (654) | 2.0% (998) |
| Personal and laundry services | 1.5% (1,610) | 1.1% (578) | 2.0% (1,032) |
| Publishing, and motion picture and sound recording industries | 1.5% (1,573) | 1.6% (853) | 1.4% (720) |
| Religious, grantmaking, civic, professional, and similar organizations | 1.4% (1,460) | 1.1% (603) | 1.7% (857) |
| Computer and electronic products | 1.2% (1,241) | 1.3% (720) | 1.0% (521) |
| Chemicals | 1.0% (1,093) | 1.1% (573) | 1.0% (520) |
| Motor vehicle and parts dealers | 1.0% (1,067) | 1.4% (776) | 0.6% (291) |
| Miscellaneous manufacturing | 1.0% (1,049) | 0.9% (504) | 1.1% (545) |
| Food | 1.0% (1,030) | 1.3% (702) | 0.6% (328) |
| Private households | 0.9% (995) | 0.2% (115) | 1.7% (880) |
| Petroleum and coal products | 0.9% (942) | 1.3% (713) | 0.4% (229) |
| Utilities | 0.8% (878) | 1.2% (671) | 0.4% (207) |
| Truck transportation | 0.8% (854) | 1.4% (757) | 0.2% (97) |
| Radio, TV, and computer stores | 0.8% (852) | 1.1% (616) | 0.5% (236) |
| Groceries and related products merchant wholesalers | 0.8% (832) | 1.0% (549) | 0.6% (283) |
| Data processing, libraries, and other information services | 0.8% (831) | 0.7% (401) | 0.8% (430) |
| Clothing and accessories, including shoe, stores | 0.7% (777) | 0.4% (238) | 1.1% (539) |
| Metal and metal products | 0.7% (743) | 1.2% (630) | 0.2% (113) |
| Building material and garden equipment and supplies dealers | 0.6% (666) | 0.9% (491) | 0.3% (175) |
| Furniture and home furnishings, and household appliance stores | 0.6% (632) | 0.8% (439) | 0.4% (193) |
| Printing and related support activities | 0.6% (628) | 0.8% (418) | 0.4% (210) |
| Used merchandise, gift, novelty, and souvenir, and other miscellaneous stores | 0.6% (592) | 0.4% (195) | 0.8% (397) |
| Air transportation | 0.5% (548) | 0.8% (432) | 0.2% (116) |
| Pharmacies and drug stores | 0.4% (474) | 0.4% (222) | 0.5% (252) |
| Miscellaneous nondurable goods merchant wholesalers | 0.4% (423) | 0.5% (284) | 0.3% (139) |
| Other direct selling establishments | 0.4% (413) | 0.4% (197) | 0.4% (216) |
| Plastics and rubber products | 0.3% (367) | 0.4% (209) | 0.3% (158) |
| Apparel | 0.3% (338) | 0.1% (65) | 0.5% (273) |
| Sporting goods, camera, and hobby and toy stores | 0.3% (307) | 0.3% (168) | 0.3% (139) |
| Gasoline stations | 0.3% (292) | 0.4% (214) | 0.2% (78) |
| Transportation equipment | 0.3% (277) | 0.4% (237) | 0.1% (40) |
| Professional and commercial equipment and supplies merchant wholesalers | 0.3% (272) | 0.3% (172) | 0.2% (100) |
| Agriculture, forestry, fishing and hunting | 0.3% (271) | 0.3% (162) | 0.2% (109) |
| Machinery | 0.2% (259) | 0.4% (207) | 0.1% (52) |
| Warehousing and storage | 0.2% (237) | 0.3% (188) | 0.1% (49) |
| Electronic shopping and mail-order houses | 0.2% (234) | 0.2% (128) | 0.2% (106) |
| Nonmetallic mineral products | 0.2% (231) | 0.3% (146) | 0.2% (85) |
| Machinery, equipment, and supplies merchant wholesalers | 0.2% (225) | 0.3% (152) | 0.1% (73) |
| Beverage and tobacco products | 0.2% (220) | 0.3% (136) | 0.2% (84) |
| Miscellaneous durable goods merchant wholesalers | 0.2% (220) | 0.2% (121) | 0.2% (99) |
| Electrical equipment, appliances, and components | 0.2% (215) | 0.2% (115) | 0.2% (100) |
| Office supplies and stationery stores | 0.2% (211) | 0.2% (93) | 0.2% (118) |
| Furniture and related product manufacturing | 0.2% (182) | 0.3% (140) | 0.1% (42) |
| Electrical and electronic goods merchant wholesalers | 0.2% (178) | 0.2% (127) | 0.1% (51) |
| Motor vehicles, parts and supplies merchant wholesalers | 0.2% (174) | 0.3% (158) | 0.0% (16) |
| Rail transportation | 0.2% (170) | 0.2% (122) | 0.1% (48) |
| Health and personal care, except drug, stores | 0.2% (163) | 0.1% (35) | 0.3% (128) |
| Music stores | 0.1% (143) | 0.2% (105) | 0.1% (38) |
| Water transportation | 0.1% (140) | 0.2% (101) | 0.1% (39) |
| Retail florists | 0.1% (138) | 0.1% (51) | 0.2% (87) |
| Book stores and news dealers | 0.1% (135) | 0.1% (75) | 0.1% (60) |
| Alcoholic beverages merchant wholesalers | 0.1% (123) | 0.2% (113) | 0.0% (10) |
| Apparel, fabrics, and notions merchant wholesalers | 0.1% (121) | 0.1% (53) | 0.1% (68) |
| Furniture and home furnishing merchant wholesalers | 0.1% (118) | 0.1% (63) | 0.1% (55) |
| Paper | 0.1% (117) | 0.2% (83) | 0.1% (34) |
| Drugs, sundries, and chemical and allied products merchant wholesalers | 0.1% (112) | 0.1% (66) | 0.1% (46) |
| Paper and paper products merchant wholesalers | 0.1% (110) | 0.2% (87) | 0.0% (23) |
| Jewelry, luggage, and leather goods stores | 0.1% (108) | 0.1% (36) | 0.1% (72) |
| Petroleum and petroleum products merchant wholesalers | 0.1% (104) | 0.2% (86) | 0.0% (18) |
| Mining, quarrying, and oil and gas extraction | 0.1% (94) | 0.1% (81) | 0.0% (13) |
| Recyclable material merchant wholesalers | 0.1% (78) | 0.1% (67) | 0.0% (11) |
Unemployment in West Contra Costa
- Unemployment by race in 2000
- Unemployment rate for White non-Hispanic residents
- 4.5%Males
- 5.1%Females
- Unemployment rate for Black residents
- 12.0%Males
- 9.0%Females
- Unemployment rate for American Indian and Alaska Native residents
- 12.5%Males
- 6.0%Females
- Unemployment rate for Asian residents
- 4.0%Males
- 4.3%Females
- Unemployment rate for other race residents
- 5.2%Males
- 10.7%Females
- Unemployment rate for two or more race residents
- 6.8%Males
- 5.4%Females
- Unemployment rate for Hispanic or Latino residents
- 6.4%Males
- 9.6%Females
Time leaving home to go to work

<5am:
| West Contra Costa: | 4.2% (4,327) |
| California: | 4.2% (606,086) |
5:30am:
| West Contra Costa: | 3.9% (3,972) |
| California: | 3.6% (523,209) |
6am:
| West Contra Costa: | 4.7% (4,785) |
| California: | 4.8% (692,256) |
6:30am:
| West Contra Costa: | 9.4% (9,684) |
| California: | 8.4% (1,216,867) |
7am:
| West Contra Costa: | 9.5% (9,733) |
| California: | 9.4% (1,362,830) |
7:30am:
| West Contra Costa: | 13.7% (14,044) |
| California: | 13.8% (2,006,950) |
8am:
| West Contra Costa: | 13.8% (14,133) |
| California: | 13.7% (1,986,831) |
8:30am:
| West Contra Costa: | 11.3% (11,628) |
| California: | 10.9% (1,577,815) |
9am:
| West Contra Costa: | 4.9% (4,991) |
| California: | 5.4% (778,152) |
10am:
| West Contra Costa: | 6.2% (6,378) |
| California: | 6.7% (972,355) |
11am:
| West Contra Costa: | 2.8% (2,877) |
| California: | 2.9% (414,479) |
12pm:
| West Contra Costa: | 1.4% (1,402) |
| California: | 1.3% (189,005) |
4pm:
| West Contra Costa: | 5.6% (5,776) |
| California: | 6.0% (865,284) |
>4pm:
| West Contra Costa: | 5.6% (5,726) |
| California: | 5.3% (776,167) |
Travel time to work


Less than 5 minutes:
| West Contra Costa: | 1.3% (1,308) |
| California: | 2.2% (324,703) |
5 to 9 minutes:
| West Contra Costa: | 5.9% (6,078) |
| California: | 8.8% (1,280,443) |
10 to 14 minutes:
| West Contra Costa: | 9.1% (9,368) |
| California: | 13.3% (1,930,263) |
15 to 19 minutes:
| West Contra Costa: | 10.7% (11,013) |
| California: | 14.9% (2,157,970) |
20 to 24 minutes:
| West Contra Costa: | 11.2% (11,450) |
| California: | 13.8% (2,004,060) |
25 to 29 minutes:
| West Contra Costa: | 5.1% (5,251) |
| California: | 5.4% (782,241) |
30 to 34 minutes:
| West Contra Costa: | 15.6% (15,991) |
| California: | 13.9% (2,025,657) |
35 to 39 minutes:
| West Contra Costa: | 3.3% (3,421) |
| California: | 2.5% (366,487) |
40 to 44 minutes:
| West Contra Costa: | 5.4% (5,588) |
| California: | 3.6% (528,043) |
45 to 59 minutes:
| West Contra Costa: | 13.1% (13,485) |
| California: | 7.9% (1,151,598) |
60 to 89 minutes:
| West Contra Costa: | 11.8% (12,069) |
| California: | 6.4% (933,123) |
90 or more minutes:
| West Contra Costa: | 4.3% (4,434) |
| California: | 3.3% (483,698) |
Means of transportation to work


Drove car alone:
| West Contra Costa: | 63.0% (64,646) |
| California: | 71.8% (10,432,462) |
Carpooled:
| West Contra Costa: | 18.6% (19,089) |
| California: | 14.5% (2,113,313) |
Bus or trolley bus:
| West Contra Costa: | 4.1% (4,257) |
| California: | 3.8% (549,425) |
Streetcar or trolley car:
| West Contra Costa: | 0.1% (149) |
| California: | 0.1% (21,158) |
Subway or elevated:
| West Contra Costa: | 7.0% (7,226) |
| California: | 0.7% (107,711) |
Railroad:
| West Contra Costa: | 0.4% (384) |
| California: | 0.3% (41,022) |
Ferryboat:
| West Contra Costa: | 0.1% (76) |
| California: | 0.0% (6,831) |
Taxicab:
| West Contra Costa: | 0.2% (176) |
| California: | 0.1% (9,890) |
Motorcycle:
| West Contra Costa: | 0.2% (238) |
| California: | 0.2% (36,262) |
Bicycle:
| West Contra Costa: | 0.7% (698) |
| California: | 0.8% (120,567) |
Walked:
| West Contra Costa: | 1.5% (1,526) |
| California: | 2.9% (414,581) |
Other means:
| West Contra Costa: | 1.0% (991) |
| California: | 0.8% (115,064) |
Private vehicle occupancy

Drove alone:
| West Contra Costa: | 77.2% (64,646) |
| California: | 83.2% (10,432,462) |
In 2 person carpool:
| West Contra Costa: | 14.4% (12,029) |
| California: | 12.5% (1,564,905) |
In 3 person carpool:
| West Contra Costa: | 6.0% (4,992) |
| California: | 2.6% (330,732) |
In 4 person carpool:
| West Contra Costa: | 1.5% (1,219) |
| California: | 1.0% (119,364) |
In 5-6 person carpool:
| West Contra Costa: | 0.6% (509) |
| California: | 0.5% (57,036) |
In 7+ person carpool:
| West Contra Costa: | 0.4% (340) |
| California: | 0.3% (41,276) |
Class of workers
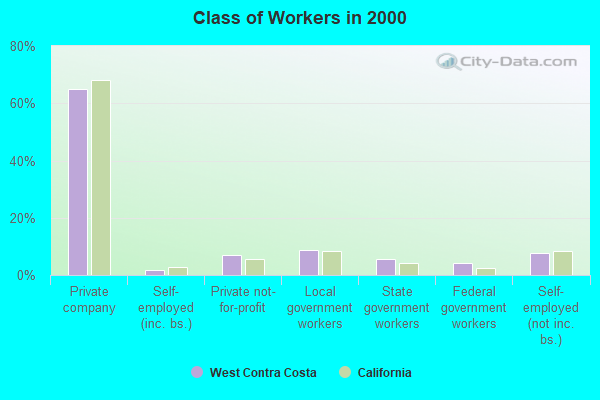
Employee of private company:
| West Contra Costa: | 65.0% (68,566) |
| California: | 68.0% (10,009,465) |
Self-employed in own incorporated business:
| West Contra Costa: | 1.7% (1,817) |
| California: | 2.7% (402,392) |
Private not-for-profit wage and salary workers:
| West Contra Costa: | 7.1% (7,451) |
| California: | 5.7% (845,536) |
Local government workers:
| West Contra Costa: | 8.6% (9,060) |
| California: | 8.3% (1,218,764) |
State government workers:
| West Contra Costa: | 5.5% (5,849) |
| California: | 4.0% (594,953) |
Federal government workers:
| West Contra Costa: | 4.0% (4,263) |
| California: | 2.3% (344,354) |
Self-employed workers in own not incorporated business:
| West Contra Costa: | 7.7% (8,123) |
| California: | 8.5% (1,249,530) |
Unpaid family workers:
| West Contra Costa: | 0.3% (314) |
| California: | 0.4% (53,934) |

Employee of private company - Males:
| West Contra Costa: | 69.5% (37,797) |
| California: | 71.1% (5,716,697) |
Self-employed in own incorporated business - Males:
| West Contra Costa: | 2.3% (1,238) |
| California: | 3.6% (290,657) |
Private not-for-profit wage and salary workers - Males:
| West Contra Costa: | 4.5% (2,423) |
| California: | 3.8% (303,997) |
Local government workers - Males:
| West Contra Costa: | 6.6% (3,582) |
| California: | 6.2% (495,927) |
State government workers - Males:
| West Contra Costa: | 4.4% (2,375) |
| California: | 3.2% (255,434) |
Federal government workers - Males:
| West Contra Costa: | 4.0% (2,193) |
| California: | 2.5% (198,555) |
Self-employed workers in own not incorporated business - Males:
| West Contra Costa: | 8.4% (4,591) |
| California: | 9.5% (760,853) |
Unpaid family workers - Males:
| West Contra Costa: | 0.3% (178) |
| California: | 0.3% (23,230) |

Employee of private company - Females:
| West Contra Costa: | 60.3% (30,769) |
| California: | 64.3% (4,292,768) |
Self-employed in own incorporated business - Females:
| West Contra Costa: | 1.1% (579) |
| California: | 1.7% (111,735) |
Private not-for-profit wage and salary workers - Females:
| West Contra Costa: | 9.8% (5,028) |
| California: | 8.1% (541,539) |
Local government workers - Females:
| West Contra Costa: | 10.7% (5,478) |
| California: | 10.8% (722,837) |
State government workers - Females:
| West Contra Costa: | 6.8% (3,474) |
| California: | 5.1% (339,519) |
Federal government workers - Females:
| West Contra Costa: | 4.1% (2,070) |
| California: | 2.2% (145,799) |
Self-employed workers in own not incorporated business - Females:
| West Contra Costa: | 6.9% (3,532) |
| California: | 7.3% (488,677) |
Unpaid family workers - Females:
| West Contra Costa: | 0.3% (136) |
| California: | 0.5% (30,704) |