Vancouver, WA (Washington) Houses and Residents
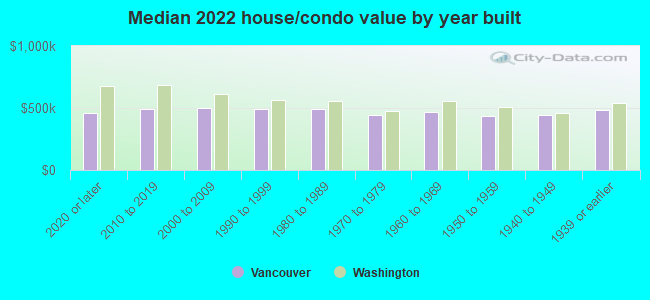
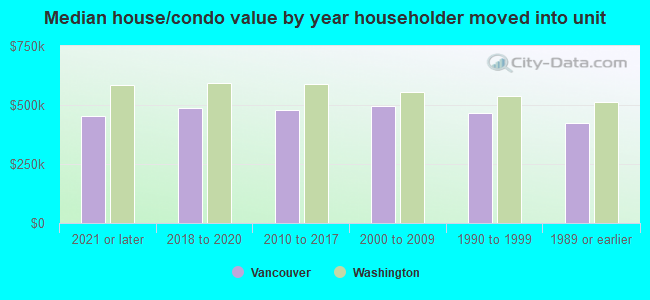
| Vancouver: | $472,300 |
| Washington: | $569,500 |
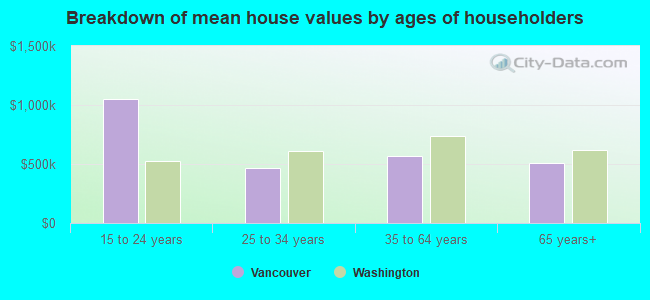
Mean price in 2022:
Detached houses: $525,533
Here: $525,533 State: $734,307 Townhouses or other attached units: $434,402
Here: $434,402 State: $657,697 In 2-unit structures: $406,921
Here: $406,921 State: $534,634 In 3-to-4-unit structures: $249,298
Here: $249,298 State: $510,239 In 5-or-more-unit structures: $433,104
Here: $433,104 State: $503,183 Mobile homes: $141,917
Here: $141,917 State: $218,362 Occupied boats, RVs, vans, etc.: $153,475
Here: $153,475 State: $159,523
Total population: 169,294 (Urban population: 142,821, Rural population: 405 (5 farm, 400 nonfarm))
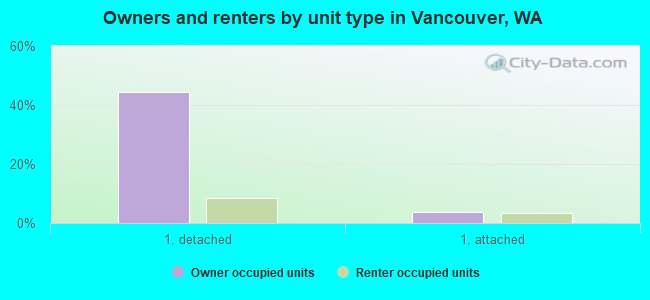
Houses: 82,941 (79,724 occupied: 40,448 owner occupied, 39,276 renter occupied)
| % of renters here: | 49% |
| State: | 36% |
Housing density: 1,938 houses/condos per square mile
Median price asked for vacant for-sale houses and condos in 2022: $688,596.
Median contract rent in 2022: $1,452 (lower quartile is $1,169, upper quartile is $1,813)
Median rent asked for vacant for-rent units in 2022: $3,228
Median gross rent in Vancouver, WA in 2022: $1,565
Housing units in Vancouver with a mortgage: 26,215 (2,623 second mortgage, 0 home equity loan, 2,374 both second mortgage and home equity loan)
Houses without a mortgage: 438
Median household income for houses/condos with a mortgage: $109,892
Median household income for apartments without a mortgage: $71,158
Median monthly housing costs: $1,546
Compare current foreclosures in Vancouver, WA:
| Photo | Address | Area | Beds / Baths | Price | Details |
|---|---|---|---|---|---|

|
#1
Ne10th St
Vancouver, WA 98684
|
1,109 sq. feet
|
1 baths 2 beds |
show details | |

|
#2
NE 85th Cir
Vancouver, WA 98662
|
1,635 sq. feet
|
1 baths 3 beds |
show details | |

|
#3
NE 135th Ave
Vancouver, WA 98682
|
2,036 sq. feet
|
2 baths 4 beds |
show details | |

|
#4
Ne82nd Street
Vancouver, WA 98662
|
- sq. feet
|
1 baths 3 beds |
show details | |

|
#5
NE 162nd Pl
Vancouver, WA 98684
|
1,240 sq. feet
|
2 baths 3 beds |
show details | |

|
#6
Ne133rd Ave
Vancouver, WA 98682
|
- sq. feet
|
2 baths 3 beds |
show details | |

|
#7
NE 77th Ave
Vancouver, WA 98664
|
1,094 sq. feet
|
2 baths 2 beds |
show details | |

|
#8
NE 16th St
Vancouver, WA 98664
|
- sq. feet
|
2 baths 3 beds |
show details | |

|
#9
NE 69th St
Vancouver, WA 98662
|
960 sq. feet
|
1 baths 3 beds |
show details | |

|
#10
NE 49th St
Vancouver, WA 98661
|
1,928 sq. feet
|
2 baths 3 beds |
show details |
| Photo | Address | Area | Beds / Baths | Price | Details |
|---|---|---|---|---|---|

|
#11
O St
Vancouver, WA 98663
|
784 sq. feet
|
1 baths 1 beds |
show details | |

|
#12
Ne80th St
Vancouver, WA 98682
|
1,591 sq. feet
|
2 baths 3 beds |
show details | |

|
#13
Carlson Rd
Vancouver, WA 98661
|
1,032 sq. feet
|
1 baths 3 beds |
show details | |

|
#14
NE 111th St
Vancouver, WA 98686
|
2,015 sq. feet
|
2 baths 4 beds |
show details | |

|
#15
NE 32nd St
Vancouver, WA 98682
|
1,094 sq. feet
|
2 baths 3 beds |
show details | |

|
#16
Ne22nd St
Vancouver, WA 98664
|
1,295 sq. feet
|
2 baths 2 beds |
show details | |

|
#17
Norris Rd
Vancouver, WA 98661
|
1,116 sq. feet
|
1 baths 3 beds |
show details | |

|
#18
NE 109th St
Vancouver, WA 98686
|
1,432 sq. feet
|
2 baths 3 beds |
show details | |

|
#19
NE 96th Ave
Vancouver, WA 98662
|
1,270 sq. feet
|
2 baths 3 beds |
show details | |

|
#20
NE Morrow Rd
Vancouver, WA 98682
|
1,808 sq. feet
|
2 baths 5 beds |
show details |
| Photo | Address | Area | Beds / Baths | Price | Details |
|---|---|---|---|---|---|

|
#21
NE 23rd Ave
Vancouver, WA 98663
|
1,280 sq. feet
|
1 baths 3 beds |
show details | |

|
#22
E 24th St
Vancouver, WA 98661
|
720 sq. feet
|
1 baths 2 beds |
show details | |

|
#23
NE 22nd Ct
Vancouver, WA 98665
|
3,073 sq. feet
|
4 baths 5 beds |
show details | |

|
#24
NW 8th Ave
Vancouver, WA 98685
|
964 sq. feet
|
1 baths 2 beds |
show details | |

|
#25
NE 88th Cir
Vancouver, WA 98682
|
1,996 sq. feet
|
3 baths 3 beds |
show details | |

|
#26
NE 37th St
Vancouver, WA 98682
|
1,024 sq. feet
|
2 baths 3 beds |
show details | |

|
#27
NW 10th Ct
Vancouver, WA 98665
|
1,130 sq. feet
|
1 baths 4 beds |
show details | |

|
#28
E 19th St
Vancouver, WA 98663
|
1,498 sq. feet
|
1 baths 2 beds |
show details | |

|
#29
NE 102nd Ct
Vancouver, WA 98662
|
1,342 sq. feet
|
4 baths 5 beds |
show details | |

|
#30
NW 131st St
Vancouver, WA 98685
|
2,102 sq. feet
|
3 baths 3 beds |
show details |
| Photo | Address | Area | Beds / Baths | Price | Details |
|---|---|---|---|---|---|

|
#31
Rossiter Ln
Vancouver, WA 98661
|
1,182 sq. feet
|
2 baths 3 beds |
show details | |

|
#32
NE 58th Ave
Vancouver, WA 98661
|
2,420 sq. feet
|
1 baths 2 beds |
show details | |

|
#33
NE 217th Ct
Vancouver, WA 98682
|
2,072 sq. feet
|
3 baths 3 beds |
show details | |

|
#34
E 28th St
Vancouver, WA 98663
|
974 sq. feet
|
1 baths 2 beds |
show details | |

|
#35
NE 30th St
Vancouver, WA 98662
|
1,304 sq. feet
|
1 baths 3 beds |
show details | |

|
#36
NE 107th Ave
Vancouver, WA 98664
|
1,200 sq. feet
|
1 baths 3 beds |
show details | |

|
#37
NE 52nd St
Vancouver, WA 98661
|
1,152 sq. feet
|
1 baths 2 beds |
show details | |

|
#38
NE 76th St Unit 1
Vancouver, WA 98662
|
1,440 sq. feet
|
2 baths 2 beds |
show details | |

|
#39
NE 72nd St Unit 20
Vancouver, WA 98665
|
896 sq. feet
|
1 baths 2 beds |
show details | |

|
#40
NE 54th St
Vancouver, WA 98662
|
1,130 sq. feet
|
2 baths 2 beds |
show details |
| Photo | Address | Area | Beds / Baths | Price | Details |
|---|---|---|---|---|---|

|
#41
NE 101st Cir
Vancouver, WA 98686
|
1,574 sq. feet
|
1 baths 2 beds |
show details | |

|
#42
NE 79th Ct
Vancouver, WA 98664
|
1,196 sq. feet
|
2 baths 2 beds |
show details | |

|
#43
NE 161st Ave
Vancouver, WA 98682
|
1,679 sq. feet
|
2 baths 3 beds |
show details | |

|
#44
NW 28th Ct
Vancouver, WA 98685
|
3,493 sq. feet
|
4 baths 4 beds |
show details | |

|
#45
SE 103rd Ave
Vancouver, WA 98664
|
1,288 sq. feet
|
1 baths 3 beds |
show details | |

|
#46
NE 79th St
Vancouver, WA 98682
|
1,560 sq. feet
|
1 baths 3 beds |
show details | |

|
#47
NE 73rd St
Vancouver, WA 98682
|
1,239 sq. feet
|
2 baths 3 beds |
show details | |

|
#48
NW 17th Ave
Vancouver, WA 98665
|
2,775 sq. feet
|
2 baths 3 beds |
show details | |

|
#49
Bryant St
Vancouver, WA 98661
|
696 sq. feet
|
1 baths 1 beds |
show details | |

|
Check over 1 million property listings on Foreclosure.com!
|
browse all offers | |||

Latest news about housing in Vancouver, WA collected exclusively by city-data.com from local newspapers, TV, and radio stations


Median year apartment built: 1991
Household type by relationship:
Households: 194,509- Male householders: 37,693 (10,604 living alone), Female householders: 42,031 (15,925 living alone)
32,268 spouses (31,793 opposite-sex spouses), 7,491 unmarried partners, (6,915 opposite-sex unmarried partners), 52,202 children (47,709 natural, 1,140 adopted, 3,353 stepchildren), 4,520 grandchildren, 2,248 brothers or sisters, 2,492 parents, 121 foster children, 3,273 other relatives, 8,103 non-relatives
- In group quarters: 2,067
Size of family households: 20,264 2-persons, 9,668 3-persons, 6,810 4-persons, 4,795 5-persons, 1,623 6-persons, 1,584 7-or-more-persons.
Size of nonfamily households: 26,529 1-person, 7,549 2-persons, 658 3-persons, 244 4-persons.
23,705 married couples with children.
11,954 single-parent households (3,500 men, 8,454 women).
78.0% of residents of Vancouver speak English at home.
11.5% of residents speak Spanish at home (65% speak English very well, 12% speak English well, 16% speak English not well, 7% don't speak English at all).
6.3% of residents speak other Indo-European language at home (61% speak English very well, 20% speak English well, 14% speak English not well, 4% don't speak English at all).
3.6% of residents speak Asian or Pacific Island language at home (53% speak English very well, 18% speak English well, 26% speak English not well, 3% don't speak English at all).
0.7% of residents speak other language at home (89% speak English very well, 11% speak English well).
Foreign born population: 26,827 (13.8%)
(49.2% of them are naturalized citizens)
| Here: | 6.0 |
| State: | 6.5 |
| Here: | 4.1 |
| State: | 3.9 |
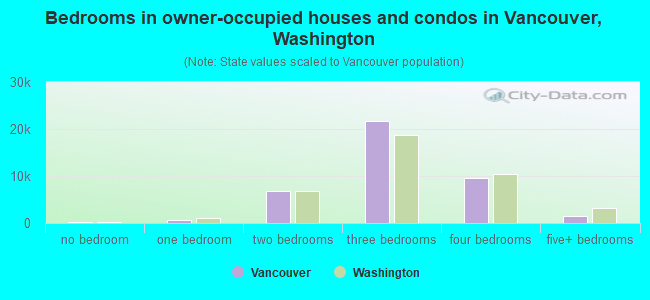
- Bedrooms in owner-occupied houses and condos in Vancouver, Washington
- 207no bedroom
- 6961 bedroom
- 6,8492 bedrooms
- 21,7183 bedrooms
- 9,5274 bedrooms
- 1,4515+ bedrooms
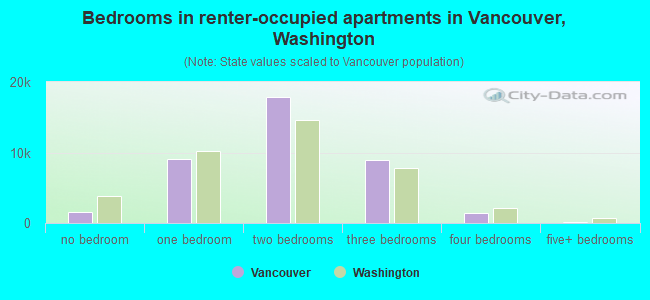
- Bedrooms in renter-occupied apartments in Vancouver, Washington
- 1,613no bedroom
- 9,1321 bedroom
- 17,9092 bedrooms
- 8,9513 bedrooms
- 1,4884 bedrooms
- 1835+ bedrooms
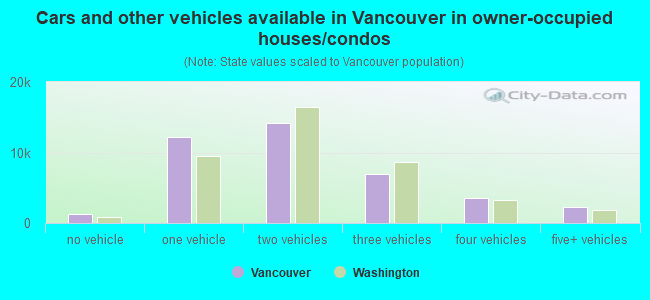
- Cars and other vehicles available in Vancouver in owner-occupied houses/condos
- 1,276no vehicle
- 12,2691 vehicle
- 14,2442 vehicles
- 6,9003 vehicles
- 3,5524 vehicles
- 2,2075+ vehicles
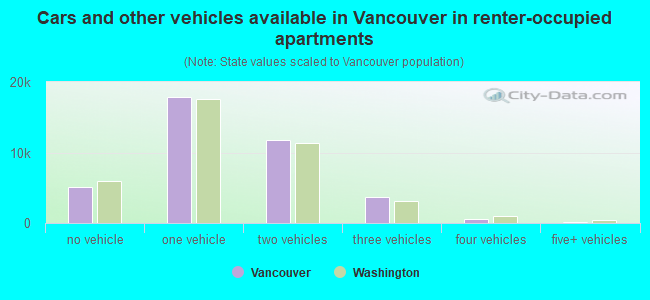
- Cars and other vehicles available in Vancouver in renter-occupied apartments
- 5,130no vehicle
- 17,9271 vehicle
- 11,8072 vehicles
- 3,7133 vehicles
- 5894 vehicles
- 1105+ vehicles
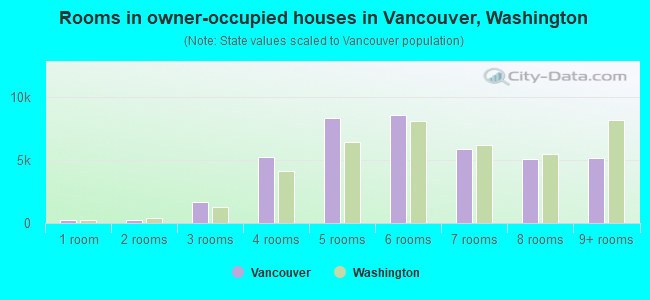
- Rooms in owner-occupied houses in Vancouver, Washington
- 2071 room
- 2482 rooms
- 1,6843 rooms
- 5,2604 rooms
- 8,3135 rooms
- 8,5706 rooms
- 5,8917 rooms
- 5,0948 rooms
- 5,1819+ rooms
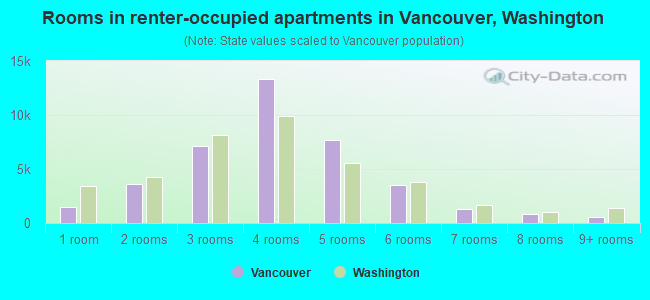
- Rooms in renter-occupied apartments in Vancouver, Washington
- 1,4591 room
- 3,5762 rooms
- 7,1163 rooms
- 13,3164 rooms
- 7,6405 rooms
- 3,5016 rooms
- 1,3127 rooms
- 8238 rooms
- 5339+ rooms
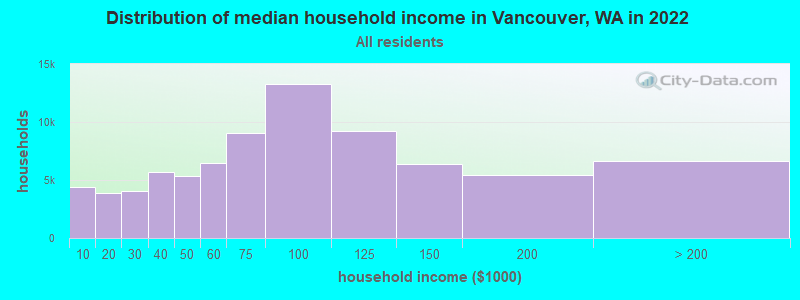
Vancouver, WA household income distribution

- 4,370Less than $10,000
- 3,863$10,000 to $19,999
- 4,039$20,000 to $29,999
- 5,678$30,000 to $39,999
- 5,337$40,000 to $49,999
- 6,454$50,000 to $59,999
- 9,014$60,000 to $74,999
- 13,254$75,000 to $99,999
- 9,243$100,000 to $124,999
- 6,413$125,000 to $149,999
- 5,420$150,000 to $199,999
- 6,639$200,000 or more
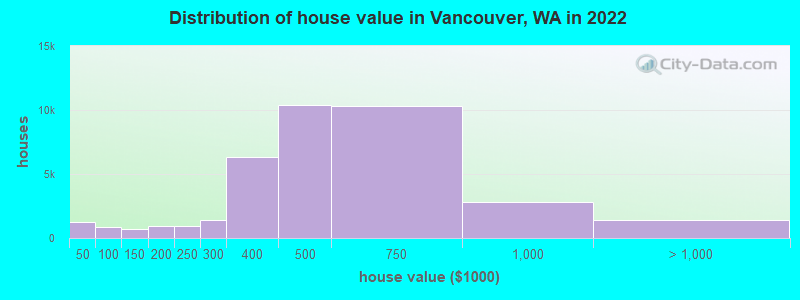
Home value of owner - occupied houses in 2022 in Vancouver, WA
-
- 441Less than $10,000
- 53$10,000 to $14,999
- 53$15,000 to $19,999
- 73$20,000 to $24,999
- 137$25,000 to $29,999
- 47$30,000 to $34,999
- 46$35,000 to $39,999
- 398$40,000 to $49,999
- 46$50,000 to $59,999
- 248$60,000 to $69,999
- 22$70,000 to $79,999
- 55$80,000 to $89,999
- 49$90,000 to $99,999
- 300$100,000 to $124,999
- 422$125,000 to $149,999
- 631$150,000 to $174,999
- 278$175,000 to $199,999
- 942$200,000 to $249,999
- 1,398$250,000 to $299,999
- 6,307$300,000 to $399,999
- 10,400$400,000 to $499,999
- 10,286$500,000 to $749,999
- 2,779$750,000 to $999,999
- 803$1,000,000 to $1,499,999
- 105$1,500,000 to $1,999,999
- 495$2,000,000 or more
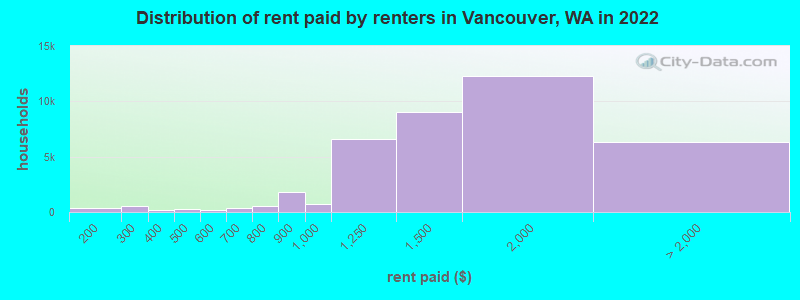
Rent paid by renters in 2022 in Vancouver, WA
-
- 63Less than $100
- 349$150 to $199
- 315$200 to $249
- 195$250 to $299
- 170$350 to $399
- 213$400 to $449
- 38$450 to $499
- 53$500 to $549
- 116$550 to $599
- 353$600 to $649
- 27$650 to $699
- 139$700 to $749
- 417$750 to $799
- 1,811$800 to $899
- 724$900 to $999
- 6,591$1,000 to $1,249
- 9,067$1,250 to $1,499
- 12,315$1,500 to $1,999
- 3,408$2,000 to $2,499
- 302$2,500 to $2,999
- 381$3,000 to $3,499
- 741$3,500 or more
- 1,488No cash rent
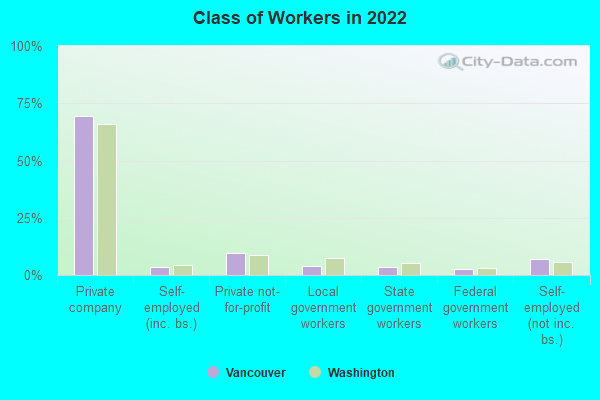
Percentage of workers working in this county: 73.7%
Number of people working at home: 16,140 (17.0% of all workers)
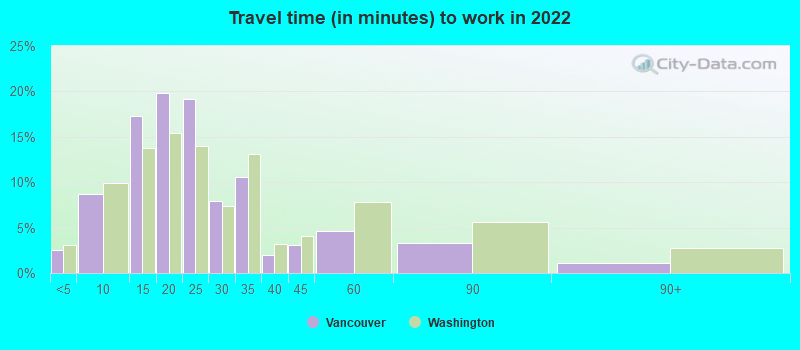
Travel time to work (commute)
- Less than 5 minutes: 2,149
- 5 to 9 minutes: 7,586
- 10 to 14 minutes: 12,261
- 15 to 19 minutes: 17,431
- 20 to 24 minutes: 13,578
- 25 to 29 minutes: 5,321
- 30 to 34 minutes: 8,770
- 35 to 39 minutes: 1,625
- 40 to 44 minutes: 2,185
- 45 to 59 minutes: 4,803
- 60 to 89 minutes: 2,088
- 90 or more minutes: 1,168

Means of transportation to work:
- Drove a car alone: 85,531 (71.0%)
- Carpooled: 10,210 (8.5%)
- Bus: 932 (0.8%)
- Subway or elevated rail: 34 (0.0%)
- Light rail, streetcar or trolley: 24 (0.0%)
- Taxi: 844 (0.7%)
- Bicycle: 154 (0.1%)
- Walked: 2,011 (1.7%)
- Worked at home: 17,959 (14.9%)
- Unemployment by race in 2022
- Unemployment rate for White non-Hispanic residents
- 7.8%Males
- 5.7%Females
- Unemployment rate for Black residents
- 3.8%Males
- 1.7%Females
- Unemployment rate for American Indian and Alaska Native residents
- 2.0%Males
- 9.4%Females
- Unemployment rate for Asian residents
- 1.7%Males
- 3.4%Females
- Unemployment rate for other race residents
- 2.5%Males
- 1.6%Females
- Unemployment rate for two or more race residents
- 14.7%Males
- 4.6%Females
- Unemployment rate for Hispanic or Latino residents
- 14.0%Males
- 7.0%Females
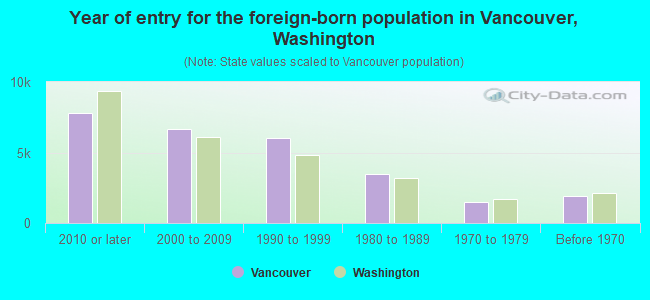
- Year of entry for the foreign-born population in Vancouver, Washington
- 7,7812010 or later
- 6,6472000 to 2009
- 5,9981990 to 1999
- 3,4971980 to 1989
- 1,5081970 to 1979
- 1,901Before 1970
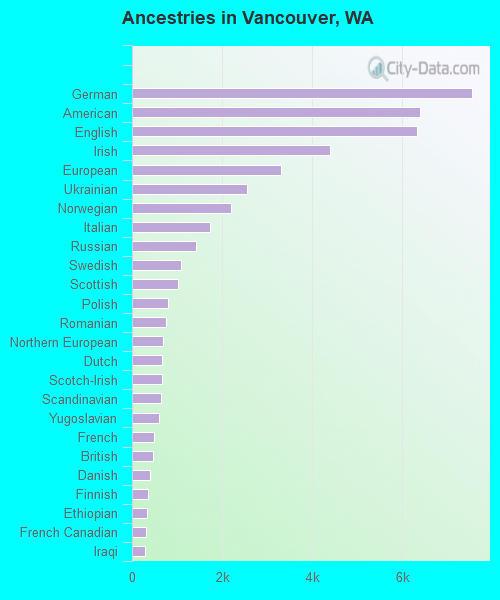
First ancestries reported:
- German: 7,546 (8.5%)
- American: 6,389 (7.2%)
- English: 6,336 (7.1%)
- Irish: 4,398 (4.9%)
- European: 3,310 (3.7%)
- Ukrainian: 2,563 (2.9%)
- Norwegian: 2,203 (2.5%)
- Italian: 1,735 (1.9%)
- Russian: 1,419 (1.6%)
- Swedish: 1,079 (1.2%)
- Scottish: 1,026 (1.2%)
- Polish: 803 (0.9%)
- Romanian: 750 (0.8%)
- Northern European: 681 (0.8%)
- Dutch: 658 (0.7%)
- Scotch-Irish: 656 (0.7%)
- Scandinavian: 653 (0.7%)
- Yugoslavian: 590 (0.7%)
- French: 497 (0.6%)
- British: 477 (0.5%)
- Danish: 401 (0.4%)
- Finnish: 362 (0.4%)
- Ethiopian: 344 (0.4%)
- French Canadian: 314 (0.4%)
- Iraqi: 288 (0.3%)
- Liberian: 268 (0.3%)
- African: 263 (0.3%)
- Welsh: 245 (0.3%)
- Armenian: 227 (0.3%)
- Iranian: 173 (0.2%)
- Canadian: 172 (0.2%)
- Czech: 154 (0.2%)
- Eastern European: 131 (0.1%)
- Serbian: 125 (0.1%)
- Greek: 114 (0.1%)
- Palestinian: 109 (0.1%)
- Carpatho Rusyn: 105 (0.1%)
- Nigerian: 101 (0.1%)
- Somali: 95 (0.1%)
- Hungarian: 92 (0.1%)
- Swiss: 91 (0.1%)
- Australian: 72 (0.08%)
- Latvian: 72 (0.08%)
- Portuguese: 71 (0.08%)
- Jordanian: 56 (0.06%)
- Slovak: 47 (0.05%)
- Austrian: 45 (0.05%)
- Slavic: 42 (0.05%)
- Luxembourger: 40 (0.04%)
- Sudanese: 39 (0.04%)
- Arab: 35 (0.04%)
- Lebanese: 34 (0.04%)
- Croatian: 28 (0.03%)
- Icelander: 27 (0.03%)
- Haitian: 27 (0.03%)
- Bulgarian: 26 (0.03%)
- Lithuanian: 23 (0.03%)
- Israeli: 21 (0.02%)
- Afghan: 20 (0.02%)
- Basque: 18 (0.02%)
- Egyptian: 18 (0.02%)
- Czechoslovakian: 17 (0.02%)
- Turkish: 10 (0.01%)
- Pennsylvania German: 7 (0.01%)
- Estonian: 6 (0.01%)
- Guyanese: 5 (0.01%)
Most common places of birth for foreign-born residents (%):
| Vancouver: | 26.5% (7,282) |
| Washington: | 21.1% (241,655) |
| Vancouver: | 8.6% (2,374) |
| Washington: | 3.1% (35,872) |
| Vancouver: | 6.8% (1,872) |
| Washington: | 0.4% (4,144) |
| Vancouver: | 4.7% (1,287) |
| Washington: | 1.9% (21,540) |
| Vancouver: | 4.3% (1,195) |
| Washington: | 1.2% (13,855) |
| Vancouver: | 4.1% (1,132) |
| Washington: | 7.4% (84,470) |
| Vancouver: | 4.0% (1,095) |
| Washington: | 6.3% (71,661) |
| Vancouver: | 3.9% (1,060) |
| Washington: | 5.4% (62,003) |
| Vancouver: | 3.1% (854) |
| Washington: | 4.3% (48,886) |
| Vancouver: | 2.6% (725) |
| Washington: | 8.9% (101,353) |
| Vancouver: | 2.0% (537) |
| Washington: | 4.1% (47,238) |
| Vancouver: | 1.7% (476) |
| Washington: | 0.7% (7,568) |
| Vancouver: | 1.5% (422) |
| Washington: | 1.5% (16,607) |
| Vancouver: | 1.5% (419) |
| Washington: | 0.3% (3,825) |
Place of birth for U.S.-born residents:
- This state: 58,997
- Other state: 105,951
- Northeast: 7,185
- Midwest: 10,643
- South: 9,616
- West: 78,507
84.6% of Vancouver residents lived in the same house 1 years ago.
Out of people who lived in different houses, 33.1% lived in this county.
Out of people who lived in different counties, 12.8% lived in Washington.
| Vancouver: | 84.6% |
| State average: | 85.2% |
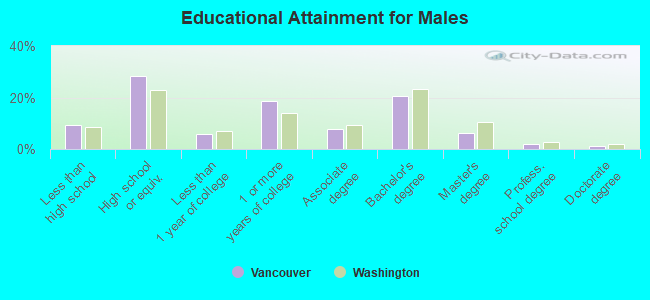
Education attainment for males 25 years and older:
- No schooling: 570
- Nursery to 4th grade: 279
- 5th and 6th grade: 68
- 7th and 8th grade: 968
- 9th grade: 1,264
- 10th grade: 1,124
- 11th grade: 325
- 12th grade, no diploma: 1,532
- High school graduate (or equivalency): 18,205
- Less than 1 year of college: 3,872
- Some college more than 1 year, no degree: 12,118
- Associate degree: 5,037
- Bachelor's degree: 13,223
- Master's degree: 3,977
- Professional school degree: 1,179
- Doctorate degree: 731
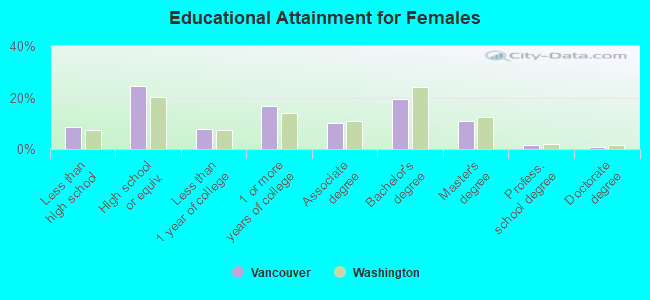
Education attainment for females 25 years and older:
- No schooling: 1,254
- Nursery to 4th grade: 54
- 5th and 6th grade: 406
- 7th and 8th grade: 289
- 9th grade: 904
- 10th grade: 1,347
- 11th grade: 421
- 12th grade, no diploma: 1,219
- High school graduate (or equivalency): 17,302
- Less than 1 year of college: 5,420
- Some college more than 1 year, no degree: 11,826
- Associate degree: 7,099
- Bachelor's degree: 13,775
- Master's degree: 7,592
- Professional school degree: 1,084
- Doctorate degree: 503
Housing units in structures:
- One, detached: 42,584
- One, attached: 6,313
- Two: 4,287
- 3 or 4: 4,035
- 5 to 9: 6,950
- 10 to 19: 3,370
- 20 to 49: 4,421
- 50 or more: 9,419
- Mobile homes: 1,513
- Boats, RVs, vans, etc.: 49
Median worth of mobile homes: $137,300
Housing units lacking complete kitchen facilities in 2022: 1.9%
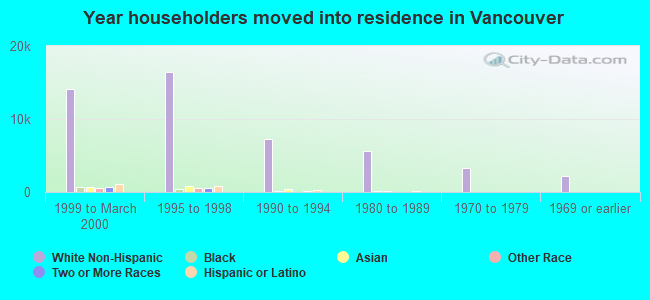
House/condo owner moved in on average 10 years ago
Renter moved in on average 2 years ago
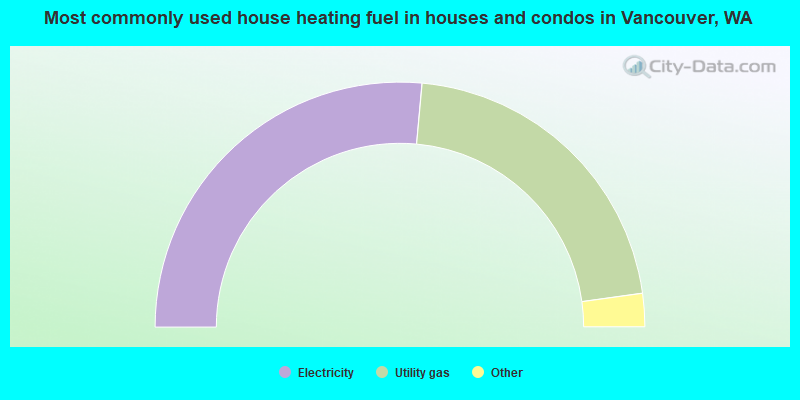
- 52.9%Electricity
- 42.7%Utility gas
- 2.0%Wood
- 0.8%Fuel oil, kerosene, etc.
- 0.7%Bottled, tank, or LP gas
- 0.6%Other fuel
- 0.3%No fuel used
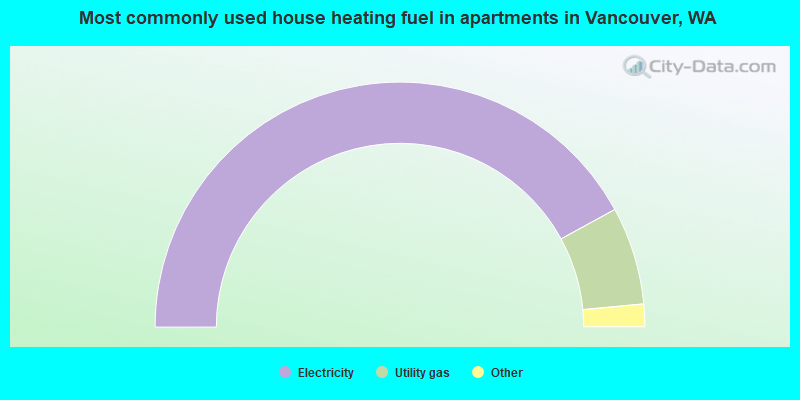
- 84.1%Electricity
- 12.9%Utility gas
- 1.2%Bottled, tank, or LP gas
- 1.1%No fuel used
- 0.4%Wood
- 0.2%Other fuel
- 0.1%Fuel oil, kerosene, etc.
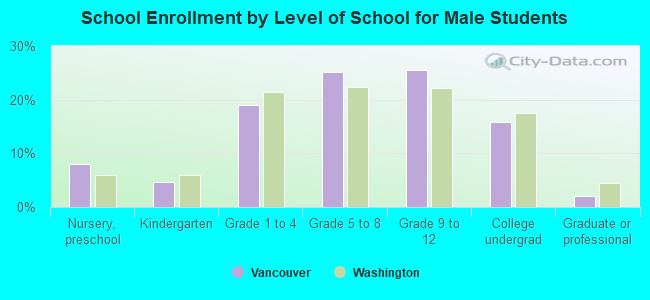
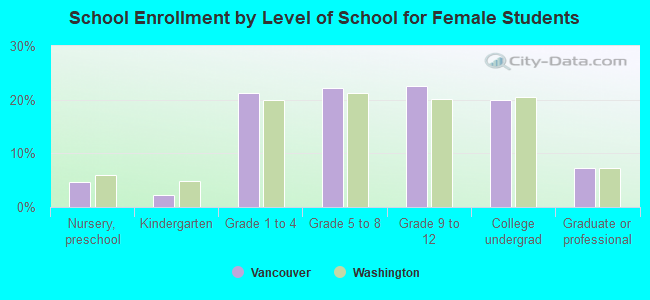
Private vs. public school enrollment:
| Here: | 6.3% |
| Washington: | 12.4% |
| Here: | 7.2% |
| Washington: | 9.2% |
| Here: | 13.2% |
| Washington: | 16.5% |