Races in Vancouver, Washington (WA) Detailed Stats
Data:
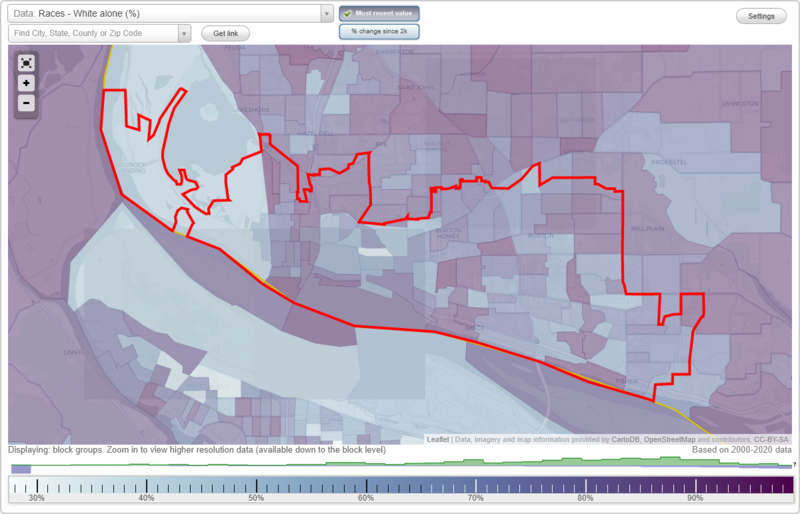
Races - White alone (%)
Races - White alone (% change since 2000)
Races - Black alone (%)
Races - Black alone (% change since 2000)
Races - American Indian alone (%)
Races - American Indian alone (% change since 2000)
Races - Asian alone (%)
Races - Asian alone (% change since 2000)
Races - Hispanic (%)
Races - Hispanic (% change since 2000)
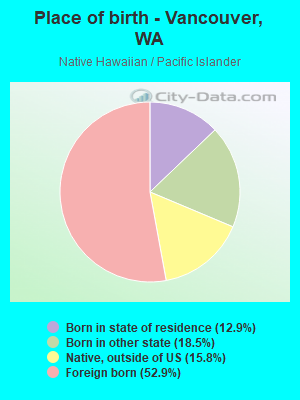
Races - Native Hawaiian and Other Pacific Islander alone (%)
Races - Native Hawaiian and Other Pacific Islander alone (% change since 2000)
Races - Two or more races(%)
Races - Two or more races(% change since 2000)
Races - Other race alone (%)
Races - Other race alone (% change since 2000)
Racial diversity
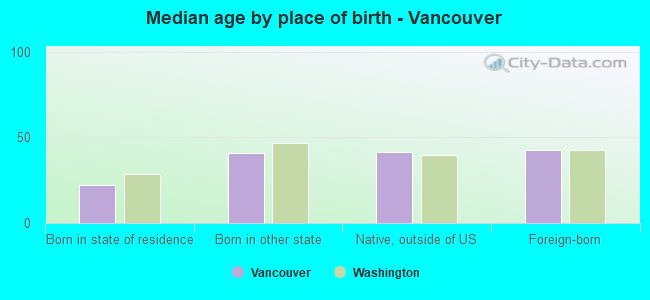
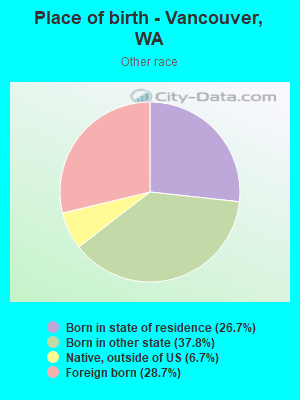
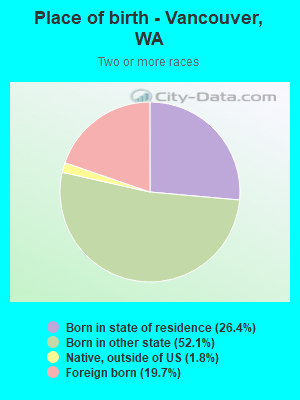
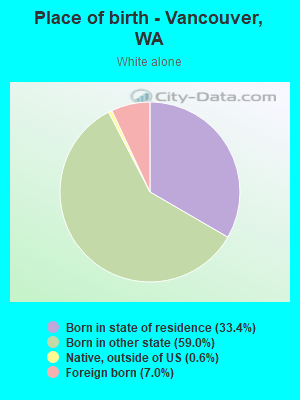
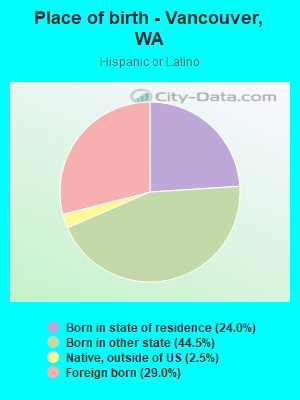
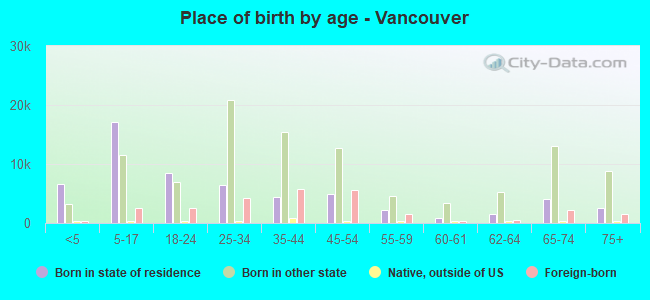
Place of birth - Born in state of residence (%)
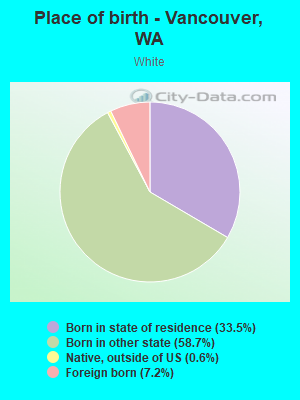
Place of birth - Born in state of residence (%) - White
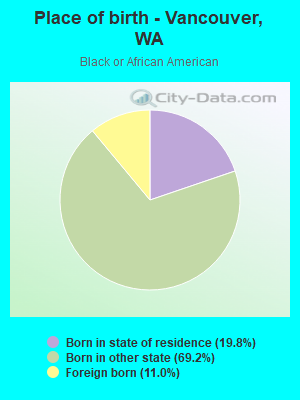
Place of birth - Born in state of residence (%) - Black or African American
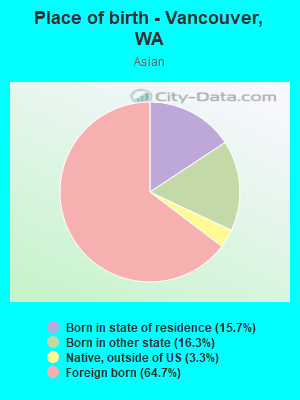
Place of birth - Born in state of residence (%) - Asian
Place of birth - Born in state of residence (%) - Hispanic or Latino
Place of birth - Born in state of residence (%) - American Indian and Alaska Native
Place of birth - Born in state of residence (%) - Multirace
Place of birth - Born in state of residence (%) - Other Race
Place of birth - Born in other state (%)
Place of birth - Born in other state (%) - White
Place of birth - Born in other state (%) - Black or African American
Place of birth - Born in other state (%) - Asian
Place of birth - Born in other state (%) - Hispanic or Latino
Place of birth - Born in other state (%) - American Indian and Alaska Native
Place of birth - Born in other state (%) - Multirace
Place of birth - Born in other state (%) - Other Race
Place of birth - Native, outside of US (%)
Place of birth - Native, outside of US (%) - White
Place of birth - Native, outside of US (%) - Black or African American
Place of birth - Native, outside of US (%) - Asian
Place of birth - Native, outside of US (%) - Hispanic or Latino
Place of birth - Native, outside of US (%) - American Indian and Alaska Native
Place of birth - Native, outside of US (%) - Multirace
Place of birth - Native, outside of US (%) - Other Race
Place of birth - Foreign born (%)
Place of birth - Foreign born (%) - White
Place of birth - Foreign born (%) - Black or African American
Place of birth - Foreign born (%) - Asian
Place of birth - Foreign born (%) - Hispanic or Latino
Place of birth - Foreign born (%) - American Indian and Alaska Native
Place of birth - Foreign born (%) - Multirace
Place of birth - Foreign born (%) - Other Race
Residents speaking English at home (%)
Residents speaking English at home - Born in the United States (%)
Residents speaking English at home - Native, born elsewhere (%)
Residents speaking English at home - Foreign born (%)
Residents speaking Spanish at home (%)
Residents speaking Spanish at home - Born in the United States (%)
Residents speaking Spanish at home - Native, born elsewhere (%)
Residents speaking Spanish at home - Foreign born (%)
Residents speaking other language at home (%)
Residents speaking other language at home - Born in the United States (%)
Residents speaking other language at home - Native, born elsewhere (%)
Residents speaking other language at home - Foreign born (%)
Marital status - Never married (%)
Marital status - Now married (%)
Marital status - Separated (%)
Marital status - Widowed (%)
Marital status - Divorced (%)
Ancestries Reported - Arab (%)
Ancestries Reported - Czech (%)
Ancestries Reported - Danish (%)
Ancestries Reported - Dutch (%)
Ancestries Reported - English (%)
Ancestries Reported - French (%)
Ancestries Reported - French Canadian (%)
Ancestries Reported - German (%)
Ancestries Reported - Greek (%)
Ancestries Reported - Hungarian (%)
Ancestries Reported - Irish (%)
Ancestries Reported - Italian (%)
Ancestries Reported - Lithuanian (%)
Ancestries Reported - Norwegian (%)
Ancestries Reported - Polish (%)
Ancestries Reported - Portuguese (%)
Ancestries Reported - Russian (%)
Ancestries Reported - Scotch-Irish (%)
Ancestries Reported - Scottish (%)
Ancestries Reported - Slovak (%)
Ancestries Reported - Subsaharan African (%)
Ancestries Reported - Swedish (%)
Ancestries Reported - Swiss (%)
Ancestries Reported - Ukrainian (%)
Ancestries Reported - United States (%)
Ancestries Reported - Welsh (%)
Ancestries Reported - West Indian (%)
Ancestries Reported - Other (%)
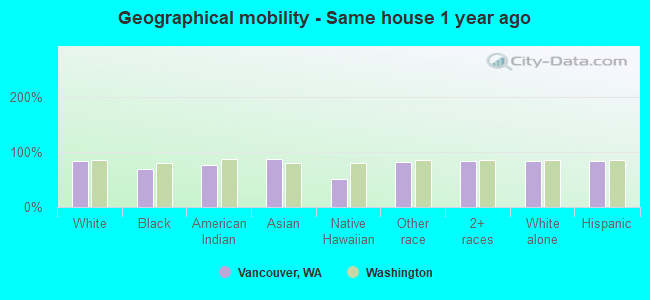
Geographical mobility - Same house 1 year ago (%)
Geographical mobility - Same house 1 year ago (%) - White
Geographical mobility - Same house 1 year ago (%) - Black or African American
Geographical mobility - Same house 1 year ago (%) - Asian
Geographical mobility - Same house 1 year ago (%) - Hispanic or Latino
Geographical mobility - Same house 1 year ago (%) - American Indian and Alaska Native
Geographical mobility - Same house 1 year ago (%) - Multirace
Geographical mobility - Same house 1 year ago (%) - Other Race
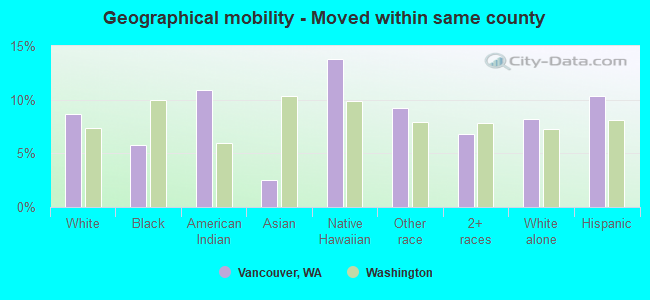
Geographical mobility - Moved within same county (%)
Geographical mobility - Moved within same county (%) - White
Geographical mobility - Moved within same county (%) - Black or African American
Geographical mobility - Moved within same county (%) - Asian
Geographical mobility - Moved within same county (%) - Hispanic or Latino
Geographical mobility - Moved within same county (%) - American Indian and Alaska Native
Geographical mobility - Moved within same county (%) - Multirace
Geographical mobility - Moved within same county (%) - Other Race
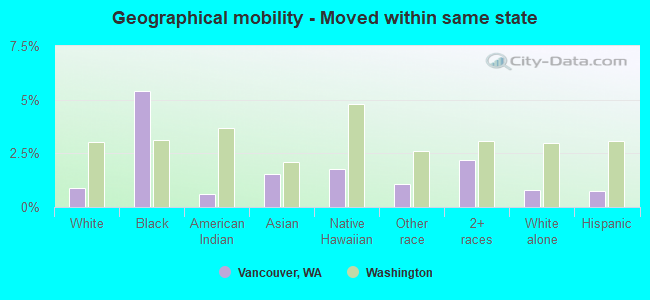
Geographical mobility - Moved from different county within same state (%)
Geographical mobility - Moved from different county within same state (%) - White
Geographical mobility - Moved from different county within same state (%) - Black or African American
Geographical mobility - Moved from different county within same state (%) - Asian
Geographical mobility - Moved from different county within same state (%) - Hispanic or Latino
Geographical mobility - Moved from different county within same state (%) - American Indian and Alaska Native
Geographical mobility - Moved from different county within same state (%) - Multirace
Geographical mobility - Moved from different county within same state (%) - Other Race
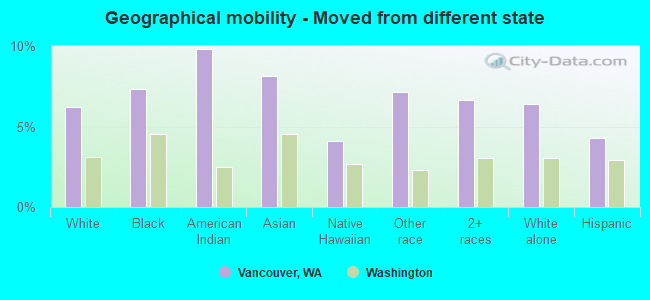
Geographical mobility - Moved from different state (%)
Geographical mobility - Moved from different state (%) - White
Geographical mobility - Moved from different state (%) - Black or African American
Geographical mobility - Moved from different state (%) - Asian
Geographical mobility - Moved from different state (%) - Hispanic or Latino
Geographical mobility - Moved from different state (%) - American Indian and Alaska Native
Geographical mobility - Moved from different state (%) - Multirace
Geographical mobility - Moved from different state (%) - Other Race
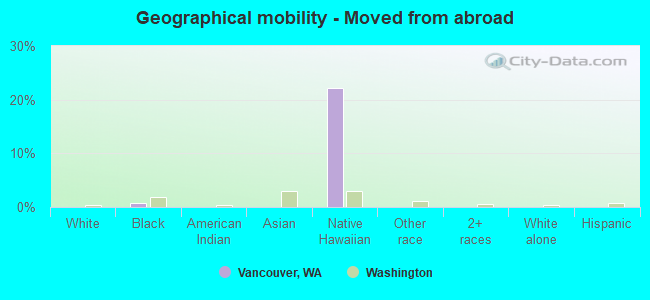
Geographical mobility - Moved from abroad (%)
Geographical mobility - Moved from abroad (%) - White
Geographical mobility - Moved from abroad (%) - Black or African American
Geographical mobility - Moved from abroad (%) - Asian
Geographical mobility - Moved from abroad (%) - Hispanic or Latino
Geographical mobility - Moved from abroad (%) - American Indian and Alaska Native
Geographical mobility - Moved from abroad (%) - Multirace
Geographical mobility - Moved from abroad (%) - Other Race
Place of birth for the foreign-born population - Ireland (%)
Place of birth for the foreign-born population - Denmark (%)
Place of birth for the foreign-born population - Norway (%)
Place of birth for the foreign-born population - Sweden (%)
Place of birth for the foreign-born population - United Kingdom (%)
Place of birth for the foreign-born population - England (%)
Place of birth for the foreign-born population - Scotland (%)
Place of birth for the foreign-born population - Other Northern Europe (%)
Place of birth for the foreign-born population - Austria (%)
Place of birth for the foreign-born population - Belgium (%)
Place of birth for the foreign-born population - France (%)
Place of birth for the foreign-born population - Germany (%)
Place of birth for the foreign-born population - Netherlands (%)
Place of birth for the foreign-born population - Switzerland (%)
Place of birth for the foreign-born population - Other Western Europe (%)
Place of birth for the foreign-born population - Greece (%)
Place of birth for the foreign-born population - Italy (%)
Place of birth for the foreign-born population - Portugal (%)
Place of birth for the foreign-born population - Spain (%)
Place of birth for the foreign-born population - Other Southern Europe (%)
Place of birth for the foreign-born population - Albania (%)
Place of birth for the foreign-born population - Belarus (%)
Place of birth for the foreign-born population - Bosnia and Herzegovina (%)
Place of birth for the foreign-born population - Bulgaria (%)
Place of birth for the foreign-born population - Croatia (%)
Place of birth for the foreign-born population - Czechoslovakia (%)
Place of birth for the foreign-born population - Hungary (%)
Place of birth for the foreign-born population - Latvia (%)
Place of birth for the foreign-born population - Lithuania (%)
Place of birth for the foreign-born population - North Macedonia (Macedonia) (%)
Place of birth for the foreign-born population - Moldova (%)
Place of birth for the foreign-born population - Poland (%)
Place of birth for the foreign-born population - Romania (%)
Place of birth for the foreign-born population - Russia (%)
Place of birth for the foreign-born population - Serbia (%)
Place of birth for the foreign-born population - Ukraine (%)
Place of birth for the foreign-born population - Other Eastern Europe (%)
Place of birth for the foreign-born population - China (%)
Place of birth for the foreign-born population - Hong Kong (%)
Place of birth for the foreign-born population - Taiwan (%)
Place of birth for the foreign-born population - Japan (%)
Place of birth for the foreign-born population - Korea (%)
Place of birth for the foreign-born population - Other Eastern Asia (%)
Place of birth for the foreign-born population - Afghanistan (%)
Place of birth for the foreign-born population - Bangladesh (%)
Place of birth for the foreign-born population - India (%)
Place of birth for the foreign-born population - Iran (%)
Place of birth for the foreign-born population - Kazakhstan (%)
Place of birth for the foreign-born population - Nepal (%)
Place of birth for the foreign-born population - Pakistan (%)
Place of birth for the foreign-born population - Sri Lanka (%)
Place of birth for the foreign-born population - Uzbekistan (%)
Place of birth for the foreign-born population - Other South Central Asia (%)
Place of birth for the foreign-born population - Burma (%)
Place of birth for the foreign-born population - Cambodia (%)
Place of birth for the foreign-born population - Indonesia (%)
Place of birth for the foreign-born population - Laos (%)
Place of birth for the foreign-born population - Malaysia (%)
Place of birth for the foreign-born population - Philippines (%)
Place of birth for the foreign-born population - Singapore (%)
Place of birth for the foreign-born population - Thailand (%)
Place of birth for the foreign-born population - Vietnam (%)
Place of birth for the foreign-born population - Other South Eastern Asia (%)
Place of birth for the foreign-born population - Armenia (%)
Place of birth for the foreign-born population - Iraq (%)
Place of birth for the foreign-born population - Israel (%)
Place of birth for the foreign-born population - Jordan (%)
Place of birth for the foreign-born population - Kuwait (%)
Place of birth for the foreign-born population - Lebanon (%)
Place of birth for the foreign-born population - Saudi Arabia (%)
Place of birth for the foreign-born population - Syria (%)
Place of birth for the foreign-born population - Turkey (%)
Place of birth for the foreign-born population - Yemen (%)
Place of birth for the foreign-born population - Other Western Asia (%)
Place of birth for the foreign-born population - Eritrea (%)
Place of birth for the foreign-born population - Ethiopia (%)
Place of birth for the foreign-born population - Kenya (%)
Place of birth for the foreign-born population - Somalia (%)
Place of birth for the foreign-born population - Uganda (%)
Place of birth for the foreign-born population - Zimbabwe (%)
Place of birth for the foreign-born population - Other Eastern Africa (%)
Place of birth for the foreign-born population - Cameroon (%)
Place of birth for the foreign-born population - Congo (%)
Place of birth for the foreign-born population - Democratic Republic of Congo (Zaire) (%)
Place of birth for the foreign-born population - Other Middle Africa (%)
Place of birth for the foreign-born population - Egypt (%)
Place of birth for the foreign-born population - Morocco (%)
Place of birth for the foreign-born population - Sudan (%)
Place of birth for the foreign-born population - Other Northern Africa (%)
Place of birth for the foreign-born population - South Africa (%)
Place of birth for the foreign-born population - Other Southern Africa (%)
Place of birth for the foreign-born population - Cabo Verde (%)
Place of birth for the foreign-born population - Ghana (%)
Place of birth for the foreign-born population - Liberia (%)
Place of birth for the foreign-born population - Nigeria (%)
Place of birth for the foreign-born population - Senegal (%)
Place of birth for the foreign-born population - Sierra Leone (%)
Place of birth for the foreign-born population - Other Western Africa (%)
Place of birth for the foreign-born population - Australia (%)
Place of birth for the foreign-born population - New Zealand (%)
Place of birth for the foreign-born population - Fiji (%)
Place of birth for the foreign-born population - Micronesia (%)
Place of birth for the foreign-born population - Bahamas (%)
Place of birth for the foreign-born population - Barbados (%)
Place of birth for the foreign-born population - Cuba (%)
Place of birth for the foreign-born population - Dominica (%)
Place of birth for the foreign-born population - Dominican Republic (%)
Place of birth for the foreign-born population - Grenada (%)
Place of birth for the foreign-born population - Haiti (%)
Place of birth for the foreign-born population - Jamaica (%)
Place of birth for the foreign-born population - St. Vincent and the Grenadines (%)
Place of birth for the foreign-born population - Trinidad and Tobago (%)
Place of birth for the foreign-born population - West Indies (%)
Place of birth for the foreign-born population - Other Caribbean (%)
Place of birth for the foreign-born population - Belize (%)
Place of birth for the foreign-born population - Costa Rica (%)
Place of birth for the foreign-born population - El Salvador (%)
Place of birth for the foreign-born population - Guatemala (%)
Place of birth for the foreign-born population - Honduras (%)
Place of birth for the foreign-born population - Mexico (%)
Place of birth for the foreign-born population - Nicaragua (%)
Place of birth for the foreign-born population - Panama (%)
Place of birth for the foreign-born population - Other Central America (%)
Place of birth for the foreign-born population - Argentina (%)
Place of birth for the foreign-born population - Bolivia (%)
Place of birth for the foreign-born population - Brazil (%)
Place of birth for the foreign-born population - Chile (%)
Place of birth for the foreign-born population - Colombia (%)
Place of birth for the foreign-born population - Ecuador (%)
Place of birth for the foreign-born population - Guyana (%)
Place of birth for the foreign-born population - Peru (%)
Place of birth for the foreign-born population - Uruguay (%)
Place of birth for the foreign-born population - Venezuela (%)
Place of birth for the foreign-born population - Other South America (%)
Place of birth for the foreign-born population - Canada (%)
Place of birth for the foreign-born population - Other Northern America (%)
Place of birth for the foreign-born population - Other (%)
Latest news about races in Vancouver, WA collected exclusively by city-data.com from local newspapers, TV, and radio stations
According to 2022 data, the most numerous races in Vancouver, WA are White alone (125,707 residents), Hispanic (34,223 residents), and Asian alone (10,687 residents). 78.0% of Vancouver residents speak English at home. 14.1% of Vancouver, WA residents are foreign-born (4.8% born in Latin America, 4.0% born in Asia, 3.3% born in Europe), which is 6.7% less than the foreign-born rate of 15.0% across the entire state of Washington.
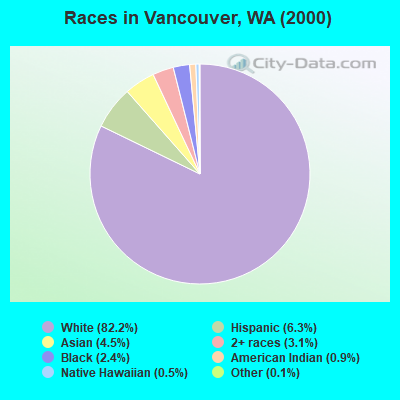
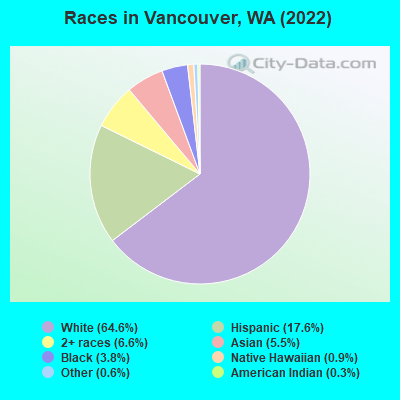
Race distribution in Vancouver
2000 2022
117,958 82.2% White alone 9,035 6.3% Hispanic 6,423 4.5% Asian alone 4,487 3.1% Two or more races 3,482 2.4% Black alone 1,222 0.9% American Indian alone 747 0.5% Native Hawaiian and Other 206 0.1% Other race alone
125,707 64.6% White alone 34,223 17.6% Hispanic 12,914 6.6% Two or more races 10,687 5.5% Asian alone 7,413 3.8% Black alone 1,738 0.9% Native Hawaiian and Other 1,209 0.6% Other race alone 618 0.3% American Indian alone
2000 2022
4,652,490 78.9% White alone 441,509 7.5% Hispanic 319,401 5.4% Asian alone 184,631 3.1% Black alone 175,926 3.0% Two or more races 85,396 1.4% American Indian alone 22,779 0.4% Native Hawaiian and Other 11,989 0.2% Other race alone
4,941,456 63.5% White alone 1,093,313 14.0% Hispanic 755,832 9.7% Asian alone 523,448 6.7% Two or more races 299,537 3.8% Black alone 69,024 0.9% American Indian alone 52,231 0.7% Native Hawaiian and Other 50,945 0.7% Other race alone
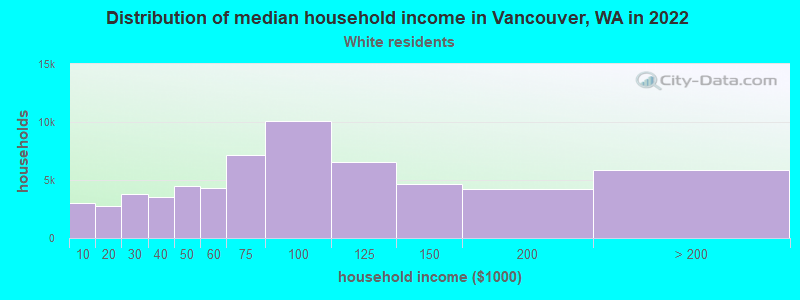
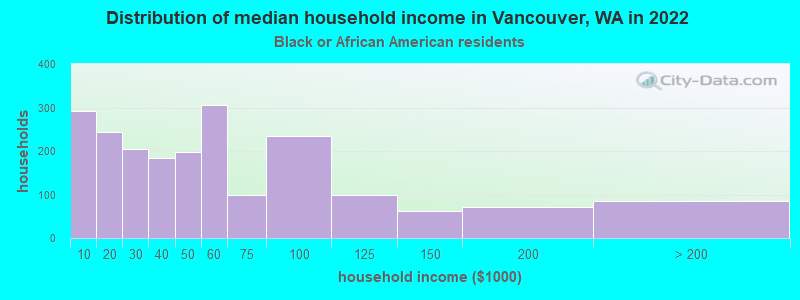
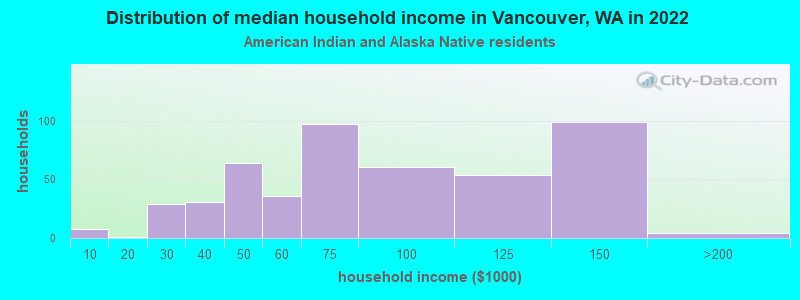
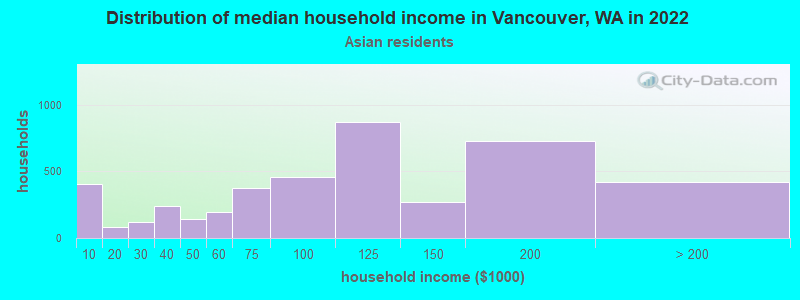
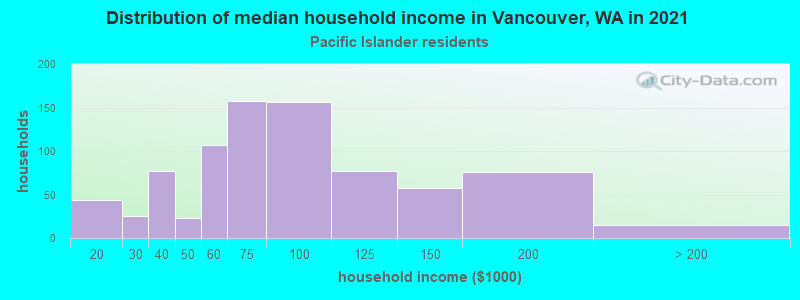
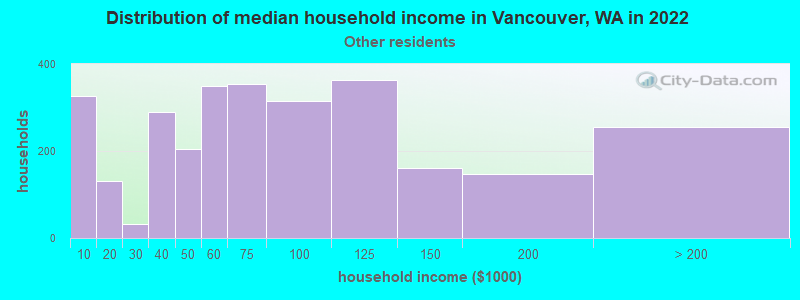
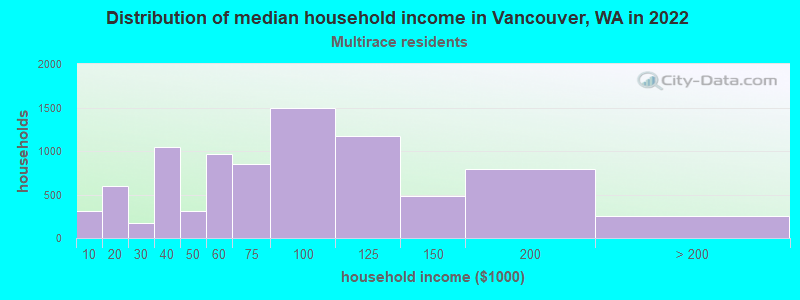
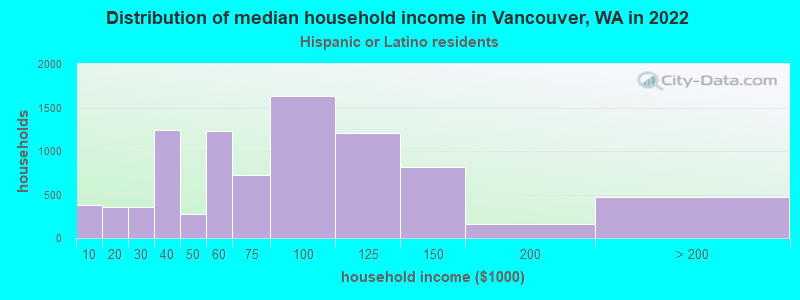
Income and house value in Vancouver Median household income in 2022 $78,804 White non-Hispanic householders$50,023 Black householders$120,379 American Indian and Alaska Native householders$86,685 Asian householders$61,755 Native Hawaiian and other Pacific Islander householders$97,271 Some other race householders$74,468 Two or more races householders$73,059 Hispanic or Latino race householdersMedian 2022 house value $478,673 White Non-Hispanic householders$518,590 Black or African American householders$497,458 American Indian or Alaska Native householders $495,780 Asian householders$534,691 Native Hawaiian and other Pacific Islander householders$432,382 Some other race householders$474,648 Two or more races householders$437,749 Hispanic or Latino householders
Median age by race in Vancouver
42.8 Median age for White residents40.3 44.4 38.2 Median age for Black or African American residents36.8 44.8 33.9 Median age for American Indian / Alaska Native residents23.3 64.8 40.4 Median age for Asian residents39.5 41.2 33.3 Median age for Native Hawaiian / Pacific Islander residents29.8 42.3 30.5 Median age for Other race residents29.6 32.5 24.1 Median age for Two or more races residents22.5 24.3 43.8 Median age for White alone residents41.7 44.8 24.7 Median age for Hispanic or Latino residents24.4 24.8
Owner/renter occupied households by race in Vancouver
House owners and renters - White residents 33,307 55.1% Owner occupied27,180 44.9% Renter occupiedHouse owners and renters - Black or African American residents 219 8.0% Owner occupied2,526 92.0% Renter occupiedHouse owners and renters - American Indian / Alaska Native residents 159 34.2% Owner occupied306 65.8% Renter occupiedHouse owners and renters - Asian residents 2,312 54.0% Owner occupied1,968 46.0% Renter occupiedHouse owners and renters - Native Hawaiian / Pacific Islander residents 281 28.3% Owner occupied712 71.7% Renter occupiedHouse owners and renters - Other race residents 1,280 51.4% Owner occupied1,209 48.6% Renter occupiedHouse owners and renters - Two or more races residents 3,098 36.7% Owner occupied5,354 63.3% Renter occupiedHouse owners and renters - White alone residents 32,821 55.4% Owner occupied26,414 44.6% Renter occupiedHouse owners and renters - Hispanic or Latino residents 2,912 32.8% Owner occupied5,962 67.2% Renter occupied
Language usage in Vancouver
English speakers - Total 78.0% of residents of Vancouver speak English at home.
11.5% of residents speak Spanish at home 13,820 65.3% Speak English very well7,346 34.7% Speak English less than very well10.6% of residents speak other language at home 11,748 60.2% Speak English very well7,763 39.8% Speak English less than very well
English speakers - Born in the United States 89.9% of residents of Vancouver speak English at home.
7.2% of residents speak Spanish at home 6,601 88.7% Speak English very well842 11.3% Speak English less than very well2.8% of residents speak other language at home 2,646 90.9% Speak English very well264 9.1% Speak English less than very well
English speakers - Native, born elsewhere 71.1% of residents of Vancouver speak English at home.
20.1% of residents speak Spanish at home 158 29.4% Speak English very well379 70.6% Speak English less than very well8.8% of residents speak other language at home 236 100.0% Speak English very well
English speakers - Foreign-born 14.8% of residents of Vancouver speak English at home.
36.7% of residents speak Spanish at home 4,269 43.4% Speak English very well5,575 56.6% Speak English less than very well48.5% of residents speak other language at home 6,051 46.5% Speak English very well6,965 53.5% Speak English less than very well
White (Caucasian) - Speak only English Native:
95.1% (110,707)Foreign-born:
18.6% (1,729)
White (Caucasian) - Speak another language Native:
4.9% (5,694)Foreign-born:
81.4% (7,581)
Black or African American - Speak only English Native:
96.9% (4,259)Foreign-born:
38.8% (289)
Black or African American - Speak another language Native:
4.0% (178)Foreign-born:
63.4% (472)
American Indian / Alaska Native - Speak only English Native:
85.3% (867)Foreign-born:
3.5% (7)
American Indian / Alaska Native - Speak another language Native:
14.5% (147)Foreign-born:
100.0% (214)
Asian - Speak only English Native:
70.0% (2,300)Foreign-born:
21.2% (1,481)
Asian - Speak another language Native:
30.0% (987)Foreign-born:
78.8% (5,496)
Native Hawaiian / Pacific Islander - Speak only English Native:
73.1% (822)Foreign-born:
32.4% (538)
Native Hawaiian / Pacific Islander - Speak another language Native:
23.8% (268)Foreign-born:
68.9% (1,143)
Other race - Speak only English Native:
58.8% (3,726)Foreign-born:
2.7% (77)
Other race - Speak another language Native:
41.2% (2,613)Foreign-born:
97.3% (2,795)
Two or more races - Speak another language Native:
33.9% (7,847)Foreign-born:
100.0% (6,543)
White alone - Speak only English Native:
95.4% (107,927)Foreign-born:
19.8% (1,729)
White alone - Speak another language Native:
4.6% (5,262)Foreign-born:
80.2% (7,013)
Hispanic or Latino - Speak only English Native:
50.1% (10,517)Foreign-born:
0.8% (77)
Hispanic or Latino - Speak another language Native:
49.9% (10,487)Foreign-born:
99.2% (9,844)
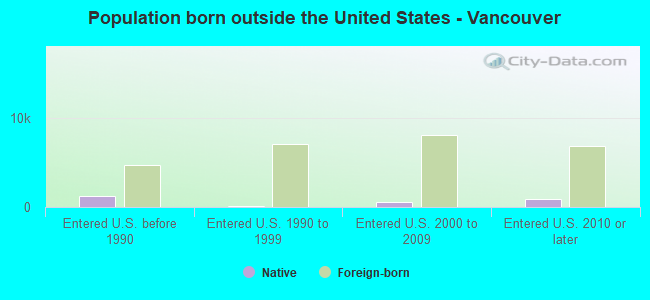
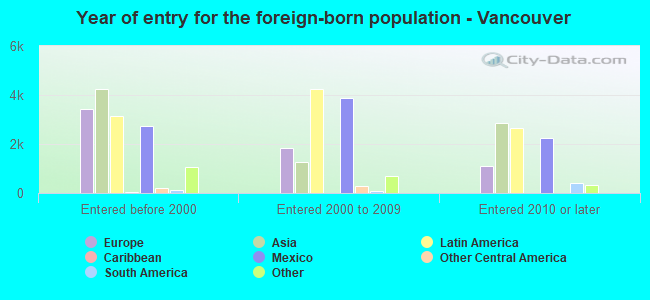
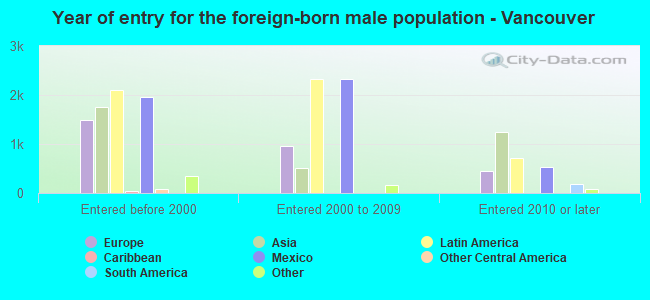
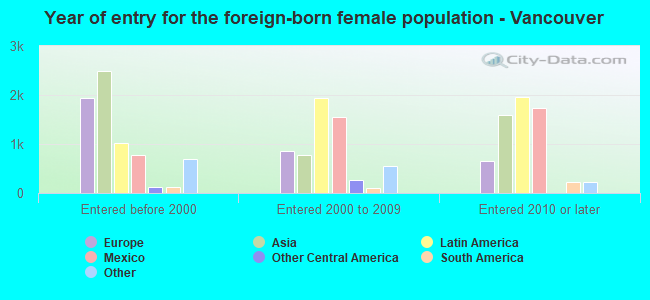
Foreign-born residents in Vancouver 27,493 residents are foreign born (4.8% Latin America , 4.0% Asia , 3.3% Europe ).
This city:
14.1%Washington:
14.9%
Marital status for residents in Vancouver Marital status - White (Caucasian) population 15 years and over
Males 38.0% Never married47.1% Now married1.7% Separated1.5% Widowed11.7% DivorcedFemales 30.4% Never married42.4% Now married1.7% Separated9.1% Widowed16.4% DivorcedWomen who gave birth in the past 12 months Now married:
84.6% (614)Unmarried:
15.4% (112)
Women who did not give birth in the past 12 months Now married:
42.0% (12,811)Unmarried:
58.0% (17,686)
Marital status - Black or African American population 15 years and over
Males 31.1% Never married35.6% Now married1.0% Separated0.0% Widowed32.2% DivorcedFemales 49.7% Never married25.9% Now married0.0% Separated0.0% Widowed24.4% DivorcedWomen who gave birth in the past 12 months Now married:
54.2% (52)Unmarried:
45.8% (44)
Women who did not give birth in the past 12 months Now married:
25.8% (325)Unmarried:
74.2% (931)
Marital status - American Indian / Alaska Native population 15 years and over
Males 40.9% Never married25.8% Now married0.0% Separated5.1% Widowed28.1% DivorcedFemales 33.8% Never married26.8% Now married11.1% Separated9.5% Widowed18.9% DivorcedWomen who gave birth in the past 12 months Now married:
88.2% (18)Unmarried:
11.8% (2)
Women who did not give birth in the past 12 months Now married:
46.4% (161)Unmarried:
53.6% (185)
Marital status - Asian population 15 years and over
Males 37.7% Never married61.2% Now married0.0% Separated1.2% Widowed0.0% DivorcedFemales 22.0% Never married54.8% Now married1.2% Separated9.7% Widowed12.2% DivorcedWomen who gave birth in the past 12 months Now married:
88.6% (42)Unmarried:
11.4% (5)
Women who did not give birth in the past 12 months Now married:
54.7% (1,650)Unmarried:
45.3% (1,368)
Marital status - Native Hawaiian / Pacific Islander population 15 years and over
Males 39.7% Never married50.7% Now married0.0% Separated0.0% Widowed9.7% DivorcedFemales 40.1% Never married27.4% Now married5.5% Separated6.2% Widowed20.7% DivorcedWomen who gave birth in the past 12 months Now married:
51.9% (44)Unmarried:
48.1% (41)
Women who did not give birth in the past 12 months Now married:
27.8% (276)Unmarried:
72.2% (716)
Marital status - Other race population 15 years and over
Males 32.4% Never married60.8% Now married0.0% Separated0.0% Widowed6.7% DivorcedFemales 54.1% Never married30.7% Now married2.7% Separated6.1% Widowed6.4% DivorcedWomen who gave birth in the past 12 months Now married:
82.3% (236)Unmarried:
17.7% (51)
Women who did not give birth in the past 12 months Now married:
39.7% (847)Unmarried:
60.3% (1,285)
Marital status - Two or more races population 15 years and over
Males 50.5% Never married42.2% Now married1.4% Separated0.6% Widowed5.2% DivorcedFemales 51.6% Never married26.2% Now married1.3% Separated2.5% Widowed18.4% DivorcedWomen who gave birth in the past 12 months Now married:
89.0% (276)Unmarried:
11.0% (34)
Women who did not give birth in the past 12 months Now married:
23.5% (2,048)Unmarried:
76.5% (6,672)
Marital status - White alone, not Hispanic / Latino population 15 years and over
Males 37.8% Never married47.1% Now married1.7% Separated1.6% Widowed11.7% DivorcedFemales 30.6% Never married42.0% Now married1.7% Separated9.1% Widowed16.6% DivorcedWomen who gave birth in the past 12 months Now married:
84.6% (614)Unmarried:
15.4% (112)
Women who did not give birth in the past 12 months Now married:
41.1% (12,128)Unmarried:
58.9% (17,351)
Marital status - Hispanic or Latino population 15 years and over
Males 45.8% Never married46.5% Now married1.3% Separated0.2% Widowed6.3% DivorcedFemales 50.4% Never married30.1% Now married2.0% Separated5.4% Widowed12.1% DivorcedWomen who gave birth in the past 12 months Now married:
88.3% (316)Unmarried:
11.7% (42)
Women who did not give birth in the past 12 months Now married:
28.9% (2,833)Unmarried:
71.1% (6,960)
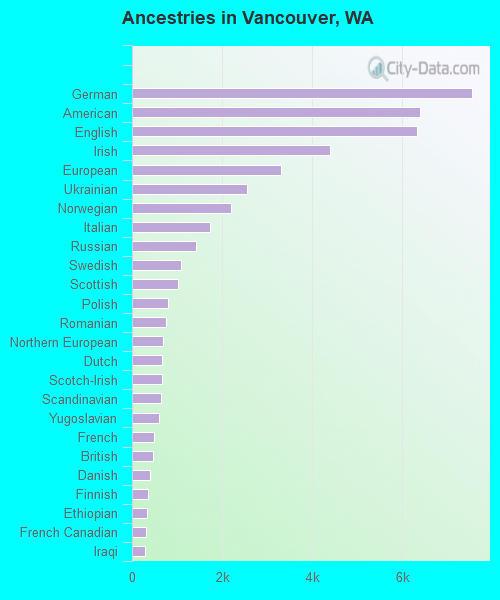
Ancestries in Vancouver
7,546 8.5% German6,389 7.2% American6,336 7.1% English4,398 4.9% Irish3,310 3.7% European2,563 2.9% Ukrainian2,203 2.5% Norwegian1,735 1.9% Italian1,419 1.6% Russian1,079 1.2% Swedish1,026 1.2% Scottish803 0.9% Polish750 0.8% Romanian681 0.8% Northern European658 0.7% Dutch656 0.7% Scotch-Irish653 0.7% Scandinavian590 0.7% Yugoslavian497 0.6% French477 0.5% British401 0.4% Danish362 0.4% Finnish344 0.4% Ethiopian314 0.4% French Canadian288 0.3% Iraqi268 0.3% Liberian263 0.3% African245 0.3% Welsh227 0.3% Armenian173 0.2% Iranian172 0.2% Canadian154 0.2% Czech131 0.1% Eastern European125 0.1% Serbian114 0.1% Greek109 0.1% Palestinian105 0.1% Carpatho Rusyn101 0.1% Nigerian95 0.1% Somali92 0.1% Hungarian91 0.1% Swiss72 0.08% Australian72 0.08% Latvian71 0.08% Portuguese56 0.06% Jordanian47 0.05% Slovak45 0.05% Austrian42 0.05% Slavic40 0.04% Luxembourger39 0.04% Sudanese35 0.04% Arab34 0.04% Lebanese28 0.03% Croatian27 0.03% Icelander27 0.03% Haitian26 0.03% Bulgarian23 0.03% Lithuanian21 0.02% Israeli20 0.02% Afghan18 0.02% Basque18 0.02% Egyptian17 0.02% Czechoslovakian10 0.01% Turkish7 0.01% Pennsylvania German6 0.01% Estonian5 0.01% Guyanese
Geographical mobility in Vancouver Same house 1 year ago 108,952 84.3% White (Caucasian)4,354 69.1% Black or African American1,020 76.4% American Indian / Alaska Native9,473 87.8% Asian1,544 50.9% Native Hawaiian / Pacific Islander8,246 82.5% Other race25,420 83.7% Two or more races106,018 84.6% White alone, not Hispanic / Latino28,599 84.6% Hispanic or LatinoMoved within same county 11,186 8.7% White / Caucasian366 5.8% Black or African American145 10.9% American Indian / Alaska Native274 2.5% Asian419 13.8% Native Hawaiian / Pacific Islander923 9.2% Other race2,059 6.8% Two or more races10,239 8.2% White alone, not Hispanic / Latino3,482 10.3% Hispanic or LatinoMoved within same state 1,169 0.9% White / Caucasian341 5.4% Black or African American8 0.6% American Indian / Alaska Native166 1.5% Asian53 1.8% Native Hawaiian / Pacific Islander106 1.1% Other race658 2.2% Two or more races1,020 0.8% White alone, not Hispanic / Latino255 0.8% Hispanic or LatinoMoved from different state 8,002 6.2% White / Caucasian464 7.4% Black or African American131 9.8% American Indian / Alaska Native876 8.1% Asian125 4.1% Native Hawaiian / Pacific Islander716 7.2% Other race2,010 6.6% Two or more races8,002 6.4% White alone, not Hispanic / Latino1,454 4.3% Hispanic or LatinoMoved from abroad 50 0.8% Black or African American674 22.2% Native Hawaiian / Pacific Islander
Children Nativity (place of birth) in Vancouver
Children under 6 years - Living with two parents Both parents native 4,331 100.0% NativeBoth parents foreign-born 1,842 100.0% NativeOne native, one foreign-born parent 857 100.0% NativeChildren under 6 years - Living with one parent Native parent 3,557 100.0% NativeForeign-born parent 1,158 100.0% NativeChildren 6 to 17 years - Living with two parents Both parents native 11,018 99.8% Native27 0.2% Foreign-bornBoth parents foreign-born 3,961 74.8% Native1,331 25.2% Foreign-bornOne native, one foreign-born parent 1,236 100.0% NativeChildren 6 to 17 years - Living with one parent Native parent 7,024 100.0% NativeForeign-born parent 2,329 59.4% Native1,590 40.6% Foreign-born
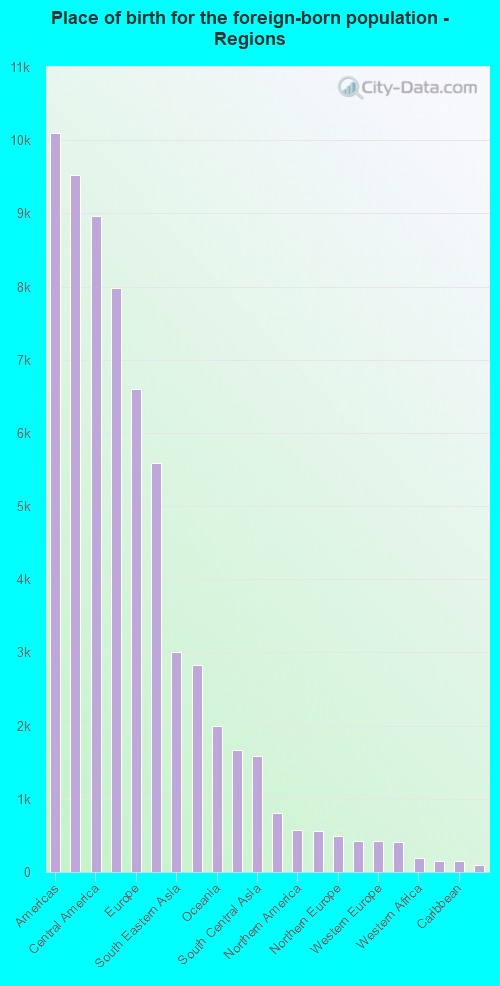
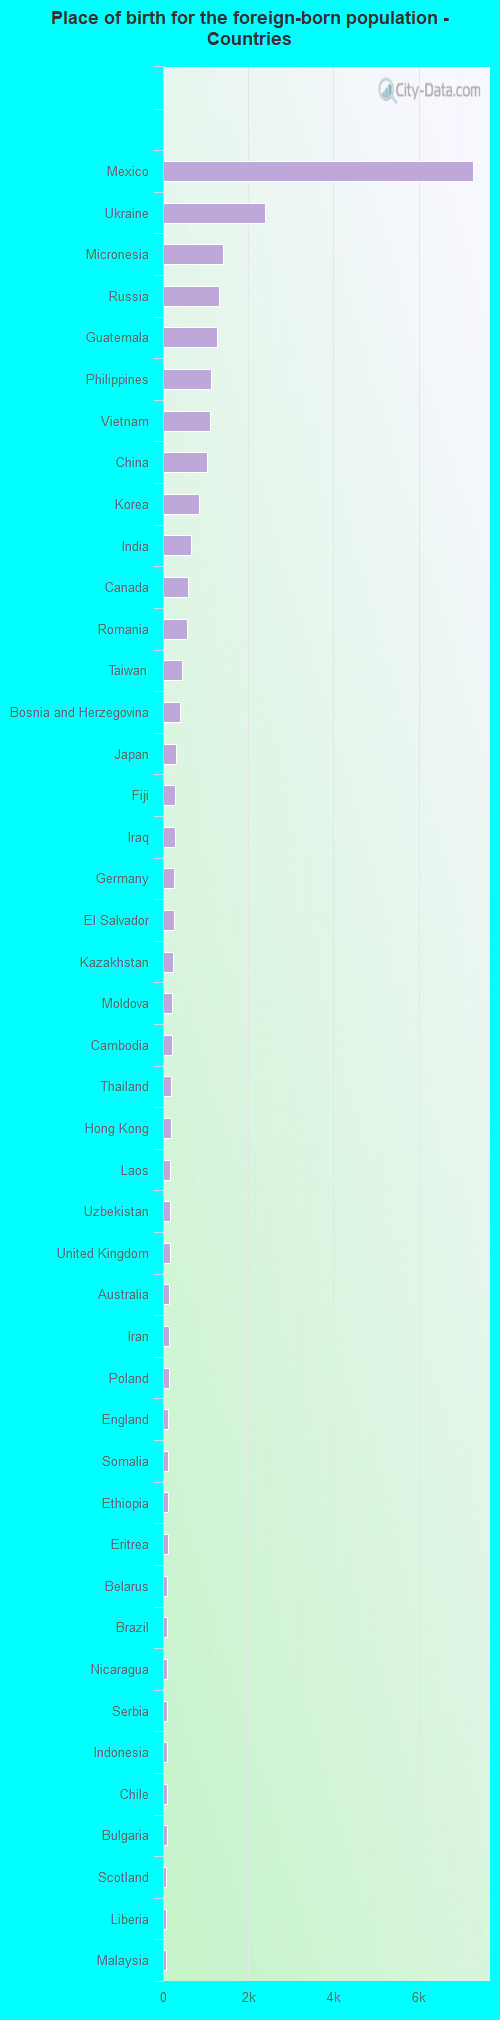
Place of birth for residents in Vancouver 10,097 Americas9,518 Latin America8,968 Central America7,986 Asia6,606 Europe5,590 Eastern Europe3,012 South Eastern Asia2,833 Eastern Asia1,992 Oceania1,663 China1,580 South Central Asia810 Africa578 Northern America559 Western Asia492 Northern Europe430 Eastern Africa423 Western Europe405 South America196 Western Africa148 Australia and New Zealand Subregion144 Caribbean100 Southern Europe77 Northern Africa19 Southern Africa7,288 Mexico2,392 Ukraine1,415 Micronesia1,326 Russia1,272 Guatemala1,117 Philippines1,095 Vietnam1,029 China856 Korea656 India578 Canada567 Romania442 Taiwan402 Bosnia and Herzegovina312 Japan275 Fiji272 Iraq257 Germany255 El Salvador235 Kazakhstan204 Moldova204 Cambodia194 Thailand191 Hong Kong172 Laos157 Uzbekistan153 United Kingdom139 Australia133 Iran130 Poland129 England127 Somalia121 Ethiopia112 Eritrea104 Belarus99 Brazil94 Nicaragua92 Serbia90 Indonesia88 Chile86 Bulgaria82 Scotland72 Liberia67 Malaysia65 Sri Lanka62 Peru60 Burma (Myanmar)57 Switzerland54 Haiti53 Nigeria53 Saudi Arabia53 Kuwait51 Kenya49 France46 Egypt43 Ecuador42 Jordan41 Colombia38 Czechoslovakia38 Honduras38 Argentina36 Armenia36 Ireland35 Cuba35 Spain34 Yemen33 Syria32 Afghanistan31 Sweden25 Austria24 Trinidad and Tobago21 Netherlands20 West Indies19 South Africa17 Venezuela16 Portugal16 Uganda15 Italy12 Greece11 Costa Rica10 Belgium10 Morocco10 Singapore9 New Zealand9 Turkey8 Latvia8 Dominican Republic8 United Arab Emirates7 Pakistan7 Nepal7 North Macedonia (Macedonia)7 Panama4 Denmark3 Azores Islands1 Jamaica
Grandparents responsible for own grandchildren in Vancouver
Grandparents (30 to 59 years) White / Caucasian 89 26.0% Responsible for grandchildren253 74.0% Not responsible for grandchildrenBlack or African American 53 100.0% Responsible for grandchildrenAmerican Indian / Alaska Native 19 100.0% Not responsible for grandchildrenAsian 16 100.0% Not responsible for grandchildrenNative Hawaiian / Pacific Islander 56 100.0% Not responsible for grandchildrenOther race 22 9.7% Responsible for grandchildren200 90.3% Not responsible for grandchildrenTwo or more races 93 61.6% Responsible for grandchildren58 38.4% Not responsible for grandchildrenWhite alone, not Hispanic / Latino 78 24.3% Responsible for grandchildren244 75.7% Not responsible for grandchildrenHispanic or Latino 377 52.9% Responsible for grandchildren336 47.1% Not responsible for grandchildrenGrandparents (60 years and over) White / Caucasian 180 18.4% Responsible for grandchildren797 81.6% Not responsible for grandchildrenBlack or African American 72 100.0% Not responsible for grandchildrenAmerican Indian / Alaska Native 23 100.0% Not responsible for grandchildrenAsian 17 9.2% Responsible for grandchildren173 90.8% Not responsible for grandchildrenNative Hawaiian / Pacific Islander 83 100.0% Not responsible for grandchildrenOther race 64 100.0% Not responsible for grandchildrenTwo or more races 30 25.3% Responsible for grandchildren89 74.7% Not responsible for grandchildrenWhite alone, not Hispanic / Latino 183 19.2% Responsible for grandchildren769 80.8% Not responsible for grandchildrenHispanic or Latino 320 100.0% Not responsible for grandchildren