Tulsa, OK (Oklahoma) Houses and Residents
| Tulsa: | $199,600 |
| Oklahoma: | $191,700 |
Mean price in 2022:
Detached houses: $287,211
Here: $287,211 State: $255,409 Townhouses or other attached units: $182,112
Here: $182,112 State: $206,466 In 2-unit structures: $374,039
Here: $374,039 State: $195,100 In 3-to-4-unit structures: $141,586
Here: $141,586 State: $140,612 In 5-or-more-unit structures: $205,125
Here: $205,125 State: $233,805 Mobile homes: $58,926
Here: $58,926 State: $110,804 Occupied boats, RVs, vans, etc.: $133,193
Here: $133,193 State: $68,690
Total population: 399,682 (Urban population: 390,406, Rural population: 2,645 (9 farm, 2,636 nonfarm))
Houses: 194,541 (175,943 occupied: 90,197 owner occupied, 85,746 renter occupied)
| % of renters here: | 49% |
| State: | 35% |
Housing density: 1,065 houses/condos per square mile
Median price asked for vacant for-sale houses and condos in 2022: $190,172.
Median contract rent in 2022: $802 (lower quartile is $632, upper quartile is $1,027)
Median rent asked for vacant for-rent units in 2022: $1,054
Median gross rent in Tulsa, OK in 2022: $971
Housing units in Tulsa with a mortgage: 51,668 (3,582 second mortgage, 193 home equity loan, 2,257 both second mortgage and home equity loan)
Houses without a mortgage: 1,084
Median household income for houses/condos with a mortgage: $89,765
Median household income for apartments without a mortgage: $60,784
Median monthly housing costs: $990
Compare current foreclosures in Tulsa, OK:
| Photo | Address | Area | Beds / Baths | Price | Details |
|---|---|---|---|---|---|

|
#1
S. 80th East Ave 27d
Tulsa, OK 74133
|
1,030 sq. feet
|
2 baths 1 beds |
$46,500
|
show details |

|
#2
99th East Ave
Tulsa, OK 74129
|
2,358 sq. feet
|
2 baths 4 beds |
show details | |

|
#3
N Evanston Ave
Tulsa, OK 74110
|
- sq. feet
|
- baths - beds |
$29,900
|
show details |

|
#4
E Archer St
Tulsa, OK 74115
|
- sq. feet
|
- baths - beds |
$26,900
|
show details |

|
#5
S 27th West Ave
Tulsa, OK 74107
|
1,202 sq. feet
|
1 baths 3 beds |
show details | |

|
#6
S Louisville Ave
Tulsa, OK 74135
|
939 sq. feet
|
1 baths 2 beds |
show details | |

|
#7
E Newton St
Tulsa, OK 74115
|
1,308 sq. feet
|
1 baths 3 beds |
show details | |

|
#8
E 68th St # A2-120
Tulsa, OK 74136
|
1,402 sq. feet
|
2 baths 3 beds |
show details | |

|
#9
N Frankfort Pl
Tulsa, OK 74126
|
1,348 sq. feet
|
1 baths 2 beds |
show details | |

|
#10
S 142nd East Ave
Tulsa, OK 74108
|
1,583 sq. feet
|
2 baths 3 beds |
show details |
| Photo | Address | Area | Beds / Baths | Price | Details |
|---|---|---|---|---|---|

|
#11
139th E Ave
Tulsa, OK 74134
|
1,708 sq. feet
|
2 baths 3 beds |
show details | |

|
#12
W Easton St
Tulsa, OK 74127
|
1,395 sq. feet
|
2 baths 4 beds |
show details | |

|
#13
S Granite Ave
Tulsa, OK 74136
|
2,412 sq. feet
|
2 baths 3 beds |
show details | |

|
#14
119th E Ave
Tulsa, OK 74129
|
999 sq. feet
|
1 baths 3 beds |
show details | |

|
#15
73rd East Ave
Tulsa, OK 74133
|
2,886 sq. feet
|
3 baths 4 beds |
show details | |

|
#16
S 111th East Ave
Tulsa, OK 74133
|
1,963 sq. feet
|
2 baths 3 beds |
show details | |

|
#17
S 107th East Ave
Tulsa, OK 74128
|
1,022 sq. feet
|
1 baths 2 beds |
show details | |

|
#18
S 45th West Ave
Tulsa, OK 74127
|
1,176 sq. feet
|
1 baths 3 beds |
show details | |

|
#19
E Zion St
Tulsa, OK 74106
|
1,247 sq. feet
|
1 baths 4 beds |
show details | |

|
#20
W Independence Pl
Tulsa, OK 74127
|
2,020 sq. feet
|
2 baths 3 beds |
show details |
| Photo | Address | Area | Beds / Baths | Price | Details |
|---|---|---|---|---|---|

|
#21
E 24th Pl
Tulsa, OK 74114
|
1,036 sq. feet
|
1 baths 2 beds |
show details | |

|
#22
E 103rd St
Tulsa, OK 74133
|
3,579 sq. feet
|
3 baths 4 beds |
show details | |

|
#23
W Xyler St
Tulsa, OK 74127
|
1,947 sq. feet
|
2 baths 4 beds |
show details | |

|
#24
E 26th Pl N
Tulsa, OK 74110
|
952 sq. feet
|
1 baths - beds |
show details | |

|
#25
W Oklahoma Pl
Tulsa, OK 74127
|
1,595 sq. feet
|
2 baths 3 beds |
show details | |

|
#26
S 119th East Ave
Tulsa, OK 74129
|
999 sq. feet
|
1 baths - beds |
show details | |

|
#27
N 158th East Ave
Tulsa, OK 74116
|
1,656 sq. feet
|
2 baths 3 beds |
show details | |

|
#28
W Virgin St
Tulsa, OK 74127
|
2,190 sq. feet
|
2 baths 4 beds |
show details | |

|
#29
S 93rd East Ave
Tulsa, OK 74145
|
1,240 sq. feet
|
1 baths - beds |
show details | |

|
#30
S Allegheny Ave
Tulsa, OK 74137
|
3,330 sq. feet
|
3 baths - beds |
show details |
| Photo | Address | Area | Beds / Baths | Price | Details |
|---|---|---|---|---|---|

|
#31
W Haskell Pl
Tulsa, OK 74127
|
1,368 sq. feet
|
1 baths 2 beds |
show details | |

|
#32
N Union Pl
Tulsa, OK 74127
|
1,477 sq. feet
|
2 baths 3 beds |
show details | |

|
#33
S 68th East Ave
Tulsa, OK 74133
|
3,890 sq. feet
|
3 baths - beds |
show details | |

|
#34
W Haskell Pl
Tulsa, OK 74127
|
1,791 sq. feet
|
2 baths 3 beds |
show details | |

|
#35
S 139th East Ave
Tulsa, OK 74134
|
1,708 sq. feet
|
2 baths - beds |
show details | |

|
#36
S 111th East Ave
Tulsa, OK 74128
|
1,177 sq. feet
|
2 baths - beds |
show details | |

|
#37
E 13th Pl
Tulsa, OK 74104
|
1,799 sq. feet
|
2 baths - beds |
show details | |

|
#38
E 59th St
Tulsa, OK 74145
|
2,146 sq. feet
|
2 baths - beds |
show details | |

|
#39
N Kenosha Ave
Tulsa, OK 74106
|
888 sq. feet
|
1 baths - beds |
show details | |

|
#40
S 104th East Ave
Tulsa, OK 74128
|
1,556 sq. feet
|
1 baths - beds |
show details |
| Photo | Address | Area | Beds / Baths | Price | Details |
|---|---|---|---|---|---|

|
#41
E 28th St
Tulsa, OK 74129
|
1,122 sq. feet
|
1 baths - beds |
show details | |

|
#42
E 64th St
Tulsa, OK 74136
|
1,352 sq. feet
|
1 baths - beds |
show details | |

|
#43
S Maybelle Ave
Tulsa, OK 74107
|
1,500 sq. feet
|
1 baths - beds |
show details | |

|
#44
N Utica Pl
Tulsa, OK 74130
|
1,780 sq. feet
|
1 baths - beds |
show details | |

|
#45
N Hartford Ave
Tulsa, OK 74126
|
1,073 sq. feet
|
1 baths - beds |
show details | |

|
#46
S Richmond Ave
Tulsa, OK 74114
|
1,356 sq. feet
|
1 baths - beds |
show details | |

|
#47
W 49th Pl
Tulsa, OK 74107
|
1,032 sq. feet
|
1 baths - beds |
show details | |

|
#48
S Pittsburg Ave
Tulsa, OK 74112
|
872 sq. feet
|
1 baths - beds |
show details | |

|
#49
E 47th Pl
Tulsa, OK 74135
|
2,218 sq. feet
|
2 baths - beds |
show details | |

|
Check over 1 million property listings on Foreclosure.com!
|
browse all offers | |||

Latest news about housing in Tulsa, OK collected exclusively by city-data.com from local newspapers, TV, and radio stations


Median year apartment built: 1976
Household type by relationship:
Households: 413,142- Male householders: 84,656 (28,944 living alone), Female householders: 91,287 (33,984 living alone)
63,629 spouses (62,674 opposite-sex spouses), 13,139 unmarried partners, (12,197 opposite-sex unmarried partners), 113,493 children (106,318 natural, 2,931 adopted, 4,244 stepchildren), 8,699 grandchildren, 5,548 brothers or sisters, 3,981 parents, 491 foster children, 5,307 other relatives, 13,006 non-relatives
- In group quarters: 9,906
Size of family households: 43,958 2-persons, 22,129 3-persons, 17,129 4-persons, 8,056 5-persons, 3,112 6-persons, 2,282 7-or-more-persons.
Size of nonfamily households: 62,928 1-person, 14,533 2-persons, 1,161 3-persons, 460 4-persons, 116 5-persons, 50 6-persons, 29 7-or-more-persons.
53,387 married couples with children.
34,194 single-parent households (6,593 men, 27,601 women).
79.9% of residents of Tulsa speak English at home.
14.8% of residents speak Spanish at home (55% speak English very well, 16% speak English well, 17% speak English not well, 11% don't speak English at all).
1.9% of residents speak other Indo-European language at home (66% speak English very well, 20% speak English well, 8% speak English not well, 6% don't speak English at all).
2.5% of residents speak Asian or Pacific Island language at home (53% speak English very well, 24% speak English well, 16% speak English not well, 7% don't speak English at all).
1.0% of residents speak other language at home (72% speak English very well, 22% speak English well, 4% speak English not well, 1% don't speak English at all).
Foreign born population: 48,927 (11.8%)
(28.9% of them are naturalized citizens)
| Here: | 6.3 |
| State: | 6.1 |
| Here: | 4.0 |
| State: | 4.5 |
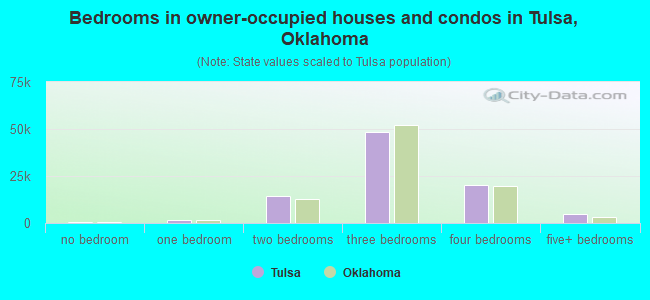
- Bedrooms in owner-occupied houses and condos in Tulsa, Oklahoma
- 274no bedroom
- 1,5531 bedroom
- 14,5452 bedrooms
- 48,6113 bedrooms
- 20,2654 bedrooms
- 4,9495+ bedrooms
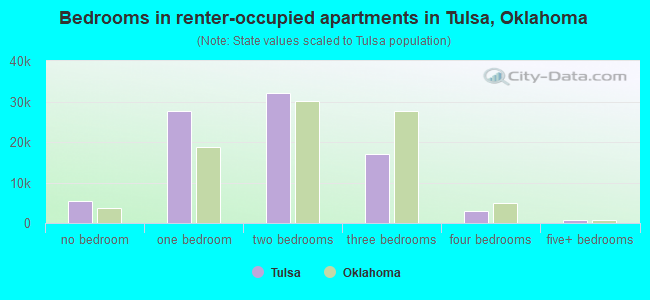
- Bedrooms in renter-occupied apartments in Tulsa, Oklahoma
- 5,442no bedroom
- 27,7371 bedroom
- 32,0382 bedrooms
- 16,9183 bedrooms
- 2,9344 bedrooms
- 6775+ bedrooms
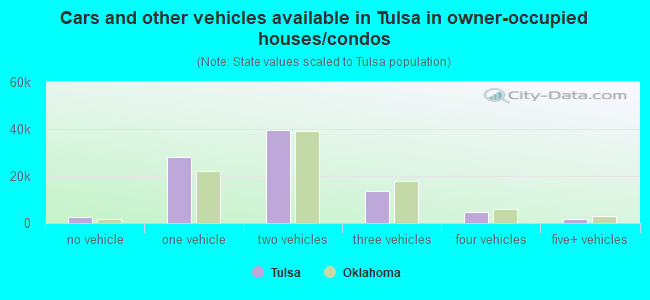
- Cars and other vehicles available in Tulsa in owner-occupied houses/condos
- 2,374no vehicle
- 27,9271 vehicle
- 39,6372 vehicles
- 13,7473 vehicles
- 4,7504 vehicles
- 1,7625+ vehicles
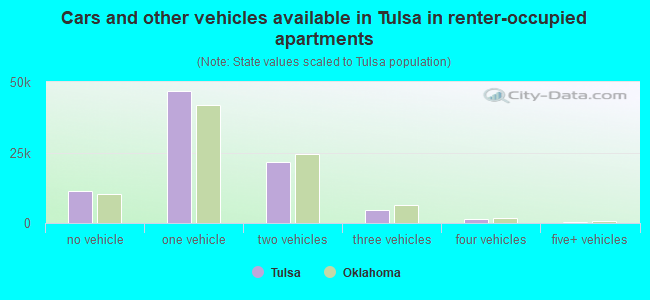
- Cars and other vehicles available in Tulsa in renter-occupied apartments
- 11,203no vehicle
- 46,8691 vehicle
- 21,5812 vehicles
- 4,4403 vehicles
- 1,3544 vehicles
- 2995+ vehicles
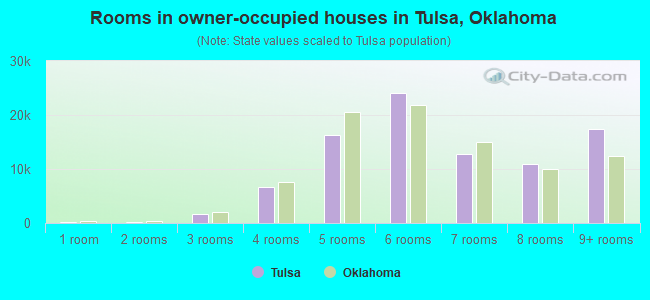
- Rooms in owner-occupied houses in Tulsa, Oklahoma
- 1551 room
- 1942 rooms
- 1,7143 rooms
- 6,6094 rooms
- 16,3665 rooms
- 24,0666 rooms
- 12,7987 rooms
- 10,8788 rooms
- 17,4179+ rooms

- Rooms in renter-occupied apartments in Tulsa, Oklahoma
- 5,0101 room
- 7,4452 rooms
- 19,3283 rooms
- 22,8614 rooms
- 14,5435 rooms
- 9,6866 rooms
- 3,7287 rooms
- 1,4448 rooms
- 1,7019+ rooms
Tulsa, OK household income distribution

- 14,500Less than $10,000
- 14,318$10,000 to $19,999
- 16,428$20,000 to $29,999
- 18,426$30,000 to $39,999
- 17,485$40,000 to $49,999
- 14,771$50,000 to $59,999
- 17,480$60,000 to $74,999
- 18,581$75,000 to $99,999
- 12,975$100,000 to $124,999
- 8,999$125,000 to $149,999
- 9,842$150,000 to $199,999
- 12,138$200,000 or more
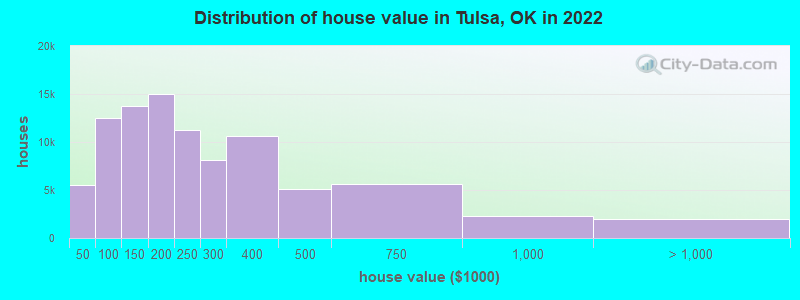
Home value of owner - occupied houses in 2022 in Tulsa, OK
-
- 872Less than $10,000
- 499$10,000 to $14,999
- 606$15,000 to $19,999
- 397$20,000 to $24,999
- 359$25,000 to $29,999
- 809$30,000 to $34,999
- 365$35,000 to $39,999
- 1,643$40,000 to $49,999
- 1,656$50,000 to $59,999
- 1,852$60,000 to $69,999
- 1,862$70,000 to $79,999
- 3,010$80,000 to $89,999
- 2,521$90,000 to $99,999
- 8,028$100,000 to $124,999
- 5,741$125,000 to $149,999
- 9,206$150,000 to $174,999
- 5,760$175,000 to $199,999
- 11,242$200,000 to $249,999
- 8,083$250,000 to $299,999
- 10,600$300,000 to $399,999
- 5,153$400,000 to $499,999
- 5,663$500,000 to $749,999
- 2,248$750,000 to $999,999
- 1,203$1,000,000 to $1,499,999
- 373$1,500,000 to $1,999,999
- 446$2,000,000 or more
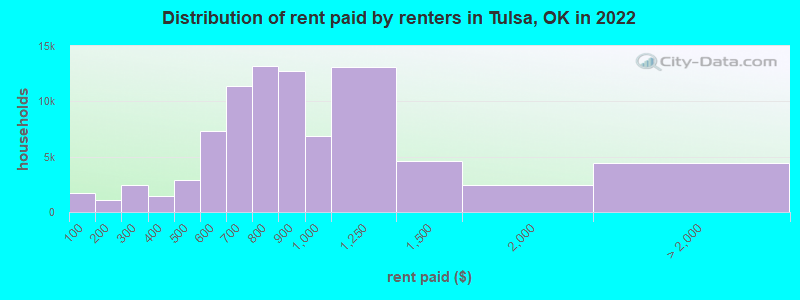
Rent paid by renters in 2022 in Tulsa, OK
-
- 1,739Less than $100
- 536$100 to $149
- 572$150 to $199
- 1,675$200 to $249
- 766$250 to $299
- 811$300 to $349
- 652$350 to $399
- 1,618$400 to $449
- 1,317$450 to $499
- 3,039$500 to $549
- 4,250$550 to $599
- 6,019$600 to $649
- 5,381$650 to $699
- 7,443$700 to $749
- 5,710$750 to $799
- 12,771$800 to $899
- 6,911$900 to $999
- 13,085$1,000 to $1,249
- 4,587$1,250 to $1,499
- 2,406$1,500 to $1,999
- 1,052$2,000 to $2,499
- 376$2,500 to $2,999
- 305$3,000 to $3,499
- 480$3,500 or more
- 2,245No cash rent
Percentage of workers working in this county: 92.5%
Number of people working at home: 21,190 (10.8% of all workers)
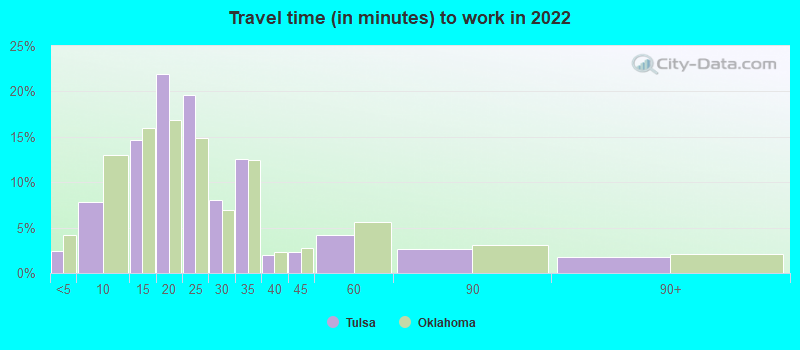
Travel time to work (commute)
- Less than 5 minutes: 5,612
- 5 to 9 minutes: 18,864
- 10 to 14 minutes: 33,874
- 15 to 19 minutes: 49,133
- 20 to 24 minutes: 33,716
- 25 to 29 minutes: 9,070
- 30 to 34 minutes: 14,829
- 35 to 39 minutes: 1,321
- 40 to 44 minutes: 1,755
- 45 to 59 minutes: 2,805
- 60 to 89 minutes: 2,731
- 90 or more minutes: 1,978
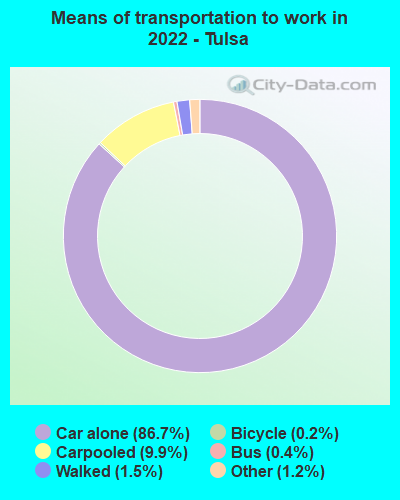
Means of transportation to work:
- Drove a car alone: 225,807 (80.2%)
- Carpooled: 25,882 (9.2%)
- Bus: 1,045 (0.4%)
- Taxi: 3,099 (1.1%)
- Bicycle: 586 (0.2%)
- Walked: 3,878 (1.4%)
- Worked at home: 21,190 (7.5%)
- Unemployment by race in 2022
- Unemployment rate for White non-Hispanic residents
- 3.3%Males
- 3.3%Females
- Unemployment rate for Black residents
- 8.8%Males
- 9.2%Females
- Unemployment rate for American Indian and Alaska Native residents
- 5.7%Males
- 17.0%Females
- Unemployment rate for Asian residents
- 3.9%Males
- 8.7%Females
- Unemployment rate for other race residents
- 1.1%Males
- 6.4%Females
- Unemployment rate for two or more race residents
- 3.8%Males
- 6.5%Females
- Unemployment rate for Hispanic or Latino residents
- 2.8%Males
- 6.9%Females
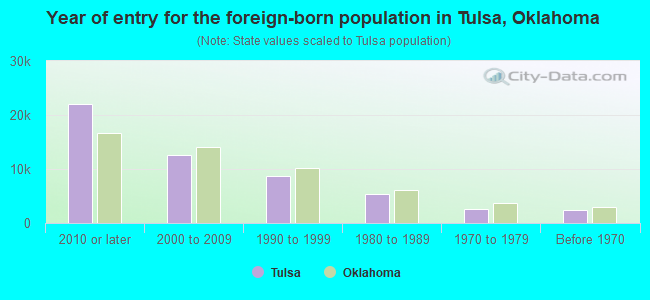
- Year of entry for the foreign-born population in Tulsa, Oklahoma
- 21,9962010 or later
- 12,5812000 to 2009
- 8,6611990 to 1999
- 5,4451980 to 1989
- 2,5641970 to 1979
- 2,320Before 1970
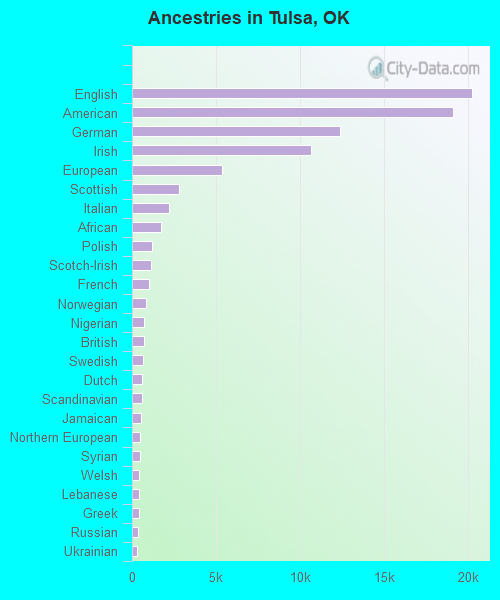
First ancestries reported:
- English: 20,268 (9.2%)
- American: 19,162 (8.7%)
- German: 12,391 (5.6%)
- Irish: 10,664 (4.9%)
- European: 5,341 (2.4%)
- Scottish: 2,803 (1.3%)
- Italian: 2,199 (1.0%)
- African: 1,724 (0.8%)
- Polish: 1,201 (0.5%)
- Scotch-Irish: 1,144 (0.5%)
- French: 1,043 (0.5%)
- Norwegian: 850 (0.4%)
- Nigerian: 735 (0.3%)
- British: 693 (0.3%)
- Swedish: 639 (0.3%)
- Dutch: 616 (0.3%)
- Scandinavian: 594 (0.3%)
- Jamaican: 519 (0.2%)
- Northern European: 500 (0.2%)
- Syrian: 485 (0.2%)
- Welsh: 446 (0.2%)
- Lebanese: 440 (0.2%)
- Greek: 421 (0.2%)
- Russian: 341 (0.2%)
- Ukrainian: 303 (0.1%)
- Egyptian: 300 (0.1%)
- Afghan: 297 (0.1%)
- Eastern European: 279 (0.1%)
- Portuguese: 262 (0.1%)
- Brazilian: 248 (0.1%)
- Iranian: 238 (0.1%)
- French Canadian: 233 (0.1%)
- Czech: 232 (0.1%)
- Romanian: 228 (0.1%)
- Haitian: 180 (0.08%)
- Danish: 168 (0.08%)
- Hungarian: 157 (0.07%)
- West Indian: 153 (0.07%)
- Turkish: 150 (0.07%)
- Kenyan: 149 (0.07%)
- Canadian: 142 (0.06%)
- Palestinian: 141 (0.06%)
- Dutch West Indian: 140 (0.06%)
- Finnish: 135 (0.06%)
- Lithuanian: 110 (0.05%)
- Arab: 107 (0.05%)
- Armenian: 99 (0.05%)
- Iraqi: 99 (0.05%)
- Ghanaian: 90 (0.04%)
- Icelander: 81 (0.04%)
- Swiss: 73 (0.03%)
- Croatian: 71 (0.03%)
- Israeli: 71 (0.03%)
- Ethiopian: 70 (0.03%)
- Cajun: 66 (0.03%)
- Ugandan: 60 (0.03%)
- Australian: 49 (0.02%)
- Belizean: 49 (0.02%)
- Bahamian: 43 (0.02%)
- Slavic: 39 (0.02%)
- Jordanian: 39 (0.02%)
- Czechoslovakian: 39 (0.02%)
- Slovene: 37 (0.02%)
- Austrian: 36 (0.02%)
- Liberian: 36 (0.02%)
- Belgian: 28 (0.01%)
- Slovak: 28 (0.01%)
- Barbadian: 27 (0.01%)
- Sudanese: 20 (0.01%)
- Basque: 19 (0.01%)
- Pennsylvania German: 19 (0.01%)
- Trinidadian and Tobagonian: 11 (0.01%)
- Zimbabwean: 11 (0.01%)
Most common places of birth for foreign-born residents (%):
| Tulsa: | 46.6% (21,315) |
| Oklahoma: | 42.4% (103,425) |
| Tulsa: | 4.7% (2,161) |
| Oklahoma: | 4.2% (10,287) |
| Tulsa: | 3.3% (1,527) |
| Oklahoma: | 1.7% (4,135) |
| Tulsa: | 3.2% (1,452) |
| Oklahoma: | 4.1% (10,034) |
| Tulsa: | 3.0% (1,357) |
| Oklahoma: | 5.6% (13,699) |
| Tulsa: | 3.0% (1,351) |
| Oklahoma: | 1.7% (4,239) |
| Tulsa: | 2.1% (978) |
| Oklahoma: | 3.2% (7,698) |
| Tulsa: | 1.8% (812) |
| Oklahoma: | 1.2% (3,010) |
| Tulsa: | 1.8% (804) |
| Oklahoma: | 1.6% (3,824) |
Place of birth for U.S.-born residents:
- This state: 230,067
- Other state: 128,655
- Northeast: 10,375
- Midwest: 40,199
- South: 46,962
- West: 31,119
83.1% of Tulsa residents lived in the same house 1 years ago.
Out of people who lived in different houses, 38.9% lived in this county.
Out of people who lived in different counties, 46.6% lived in Oklahoma.
| Tulsa: | 83.1% |
| State average: | 85.5% |
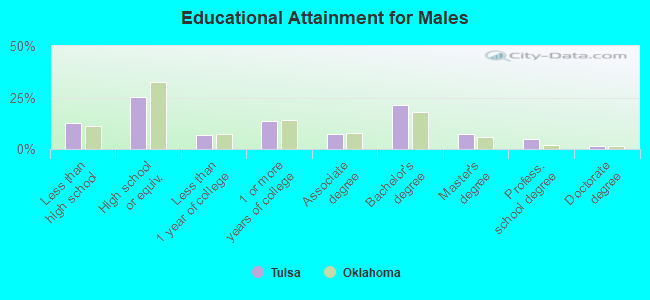
Education attainment for males 25 years and older:
- No schooling: 3,267
- Nursery to 4th grade: 1,134
- 5th and 6th grade: 2,790
- 7th and 8th grade: 1,133
- 9th grade: 1,724
- 10th grade: 1,639
- 11th grade: 2,720
- 12th grade, no diploma: 1,926
- High school graduate (or equivalency): 33,210
- Less than 1 year of college: 8,810
- Some college more than 1 year, no degree: 17,649
- Associate degree: 9,520
- Bachelor's degree: 28,220
- Master's degree: 9,729
- Professional school degree: 6,377
- Doctorate degree: 1,724
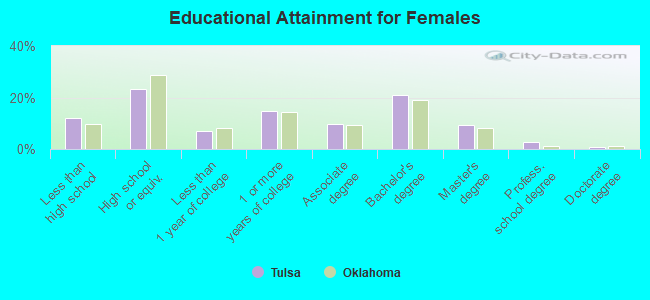
Education attainment for females 25 years and older:
- No schooling: 2,785
- Nursery to 4th grade: 657
- 5th and 6th grade: 2,268
- 7th and 8th grade: 1,011
- 9th grade: 2,203
- 10th grade: 2,220
- 11th grade: 3,825
- 12th grade, no diploma: 2,010
- High school graduate (or equivalency): 33,118
- Less than 1 year of college: 9,680
- Some college more than 1 year, no degree: 20,943
- Associate degree: 13,568
- Bachelor's degree: 29,669
- Master's degree: 13,017
- Professional school degree: 3,938
- Doctorate degree: 1,174
Housing units in structures:
- One, detached: 117,584
- One, attached: 6,071
- Two: 4,064
- 3 or 4: 8,581
- 5 to 9: 16,240
- 10 to 19: 15,275
- 20 to 49: 9,870
- 50 or more: 14,303
- Mobile homes: 2,302
- Boats, RVs, vans, etc.: 251
Median worth of mobile homes: $32,100
Housing units lacking complete kitchen facilities in 2022: 2.3%
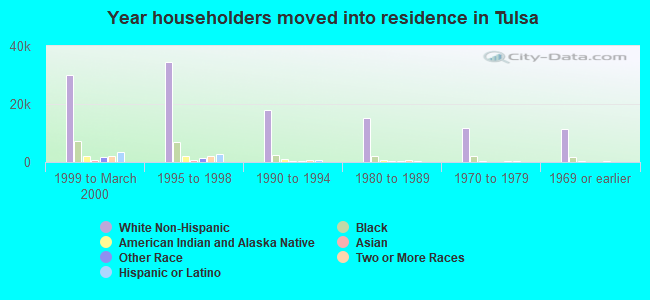
House/condo owner moved in on average 11 years ago
Renter moved in on average 2 years ago
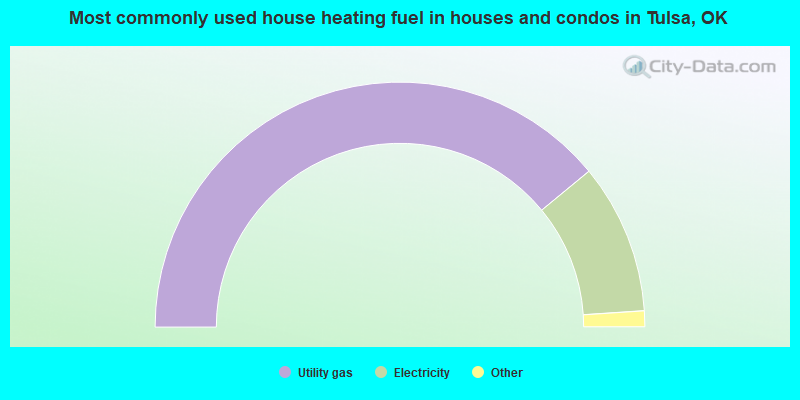
- 78.0%Utility gas
- 19.8%Electricity
- 1.3%Bottled, tank, or LP gas
- 0.6%No fuel used
- 0.2%Other fuel
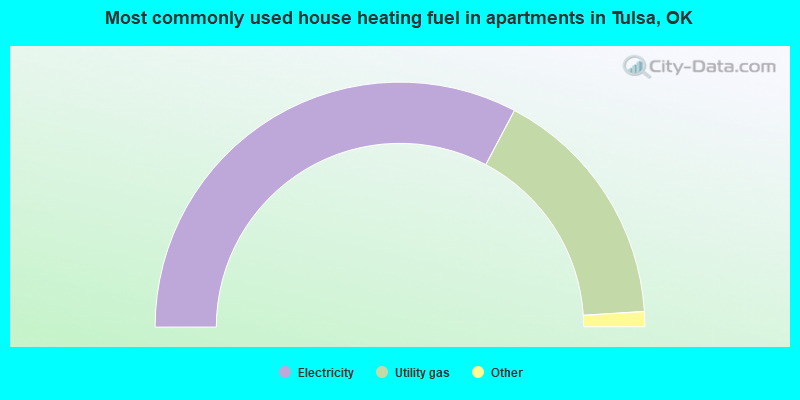
- 65.5%Electricity
- 32.5%Utility gas
- 0.9%Bottled, tank, or LP gas
- 0.8%No fuel used
- 0.2%Other fuel
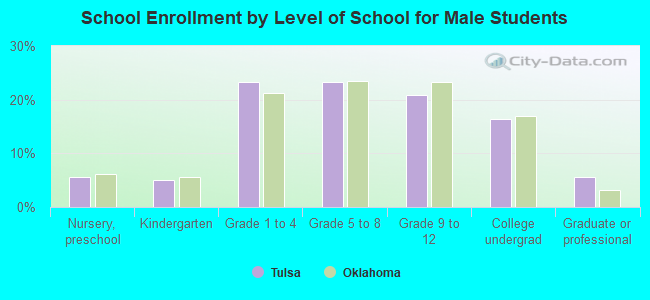
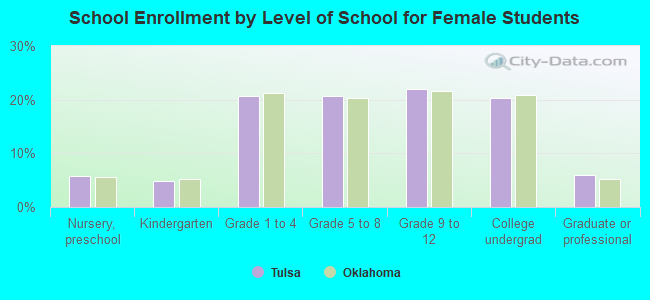
Private vs. public school enrollment:
| Here: | 16.1% |
| Oklahoma: | 11.7% |
| Here: | 15.1% |
| Oklahoma: | 11.7% |
| Here: | 43.1% |
| Oklahoma: | 19.3% |