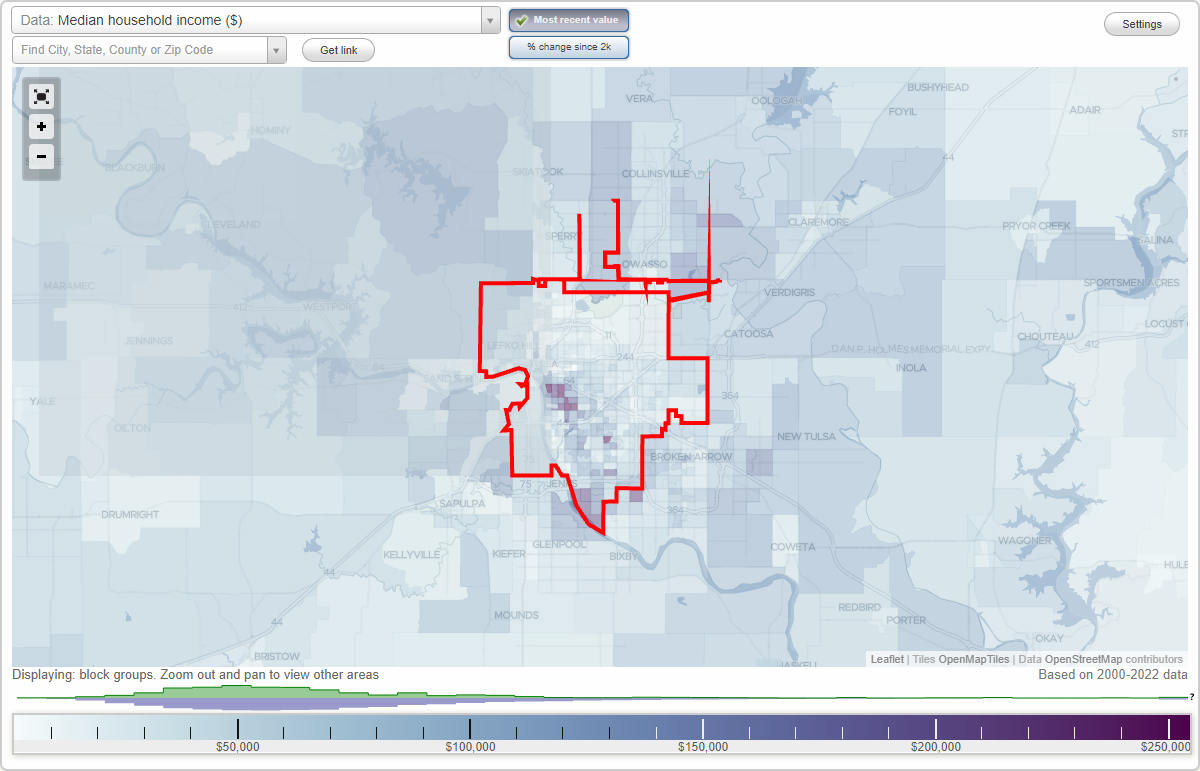
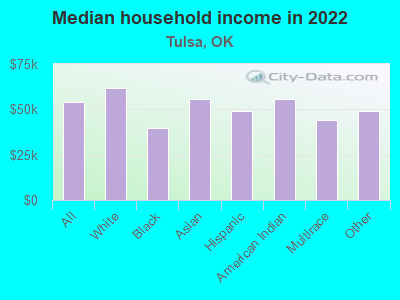
The median household income in Tulsa, OK in 2022 was $54,040, which was 10.4% less than the median annual income of $59,673 across the entire state of Oklahoma. Compared to the median income of $35,316 in 2000 this represents an increase of 34.6%. The per capita income in 2022 was $35,447, which means an increase of 39.3% compared to 2000 when it was $21,534.
Whole page based on the data from 2000 / 2022 when the population of Tulsa, Oklahoma was 393,049 / 413,142
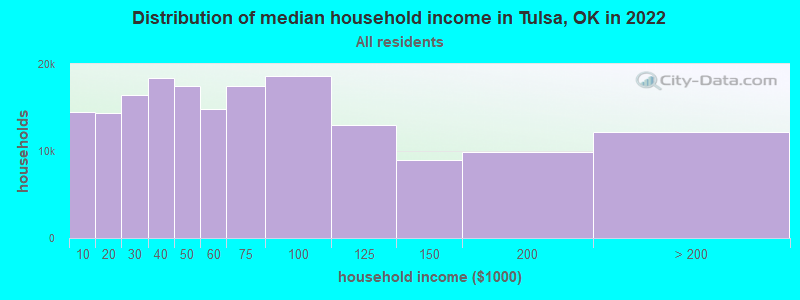
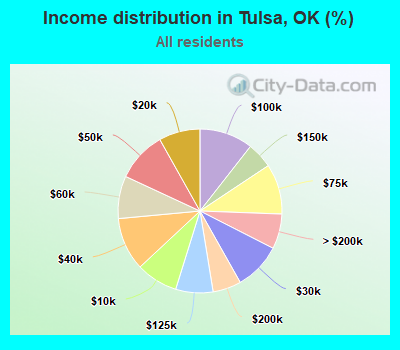
Income statistics for all residents
Median household income in Tulsa, OK in 2022:
Tulsa:
$54,040
State:
$59,673
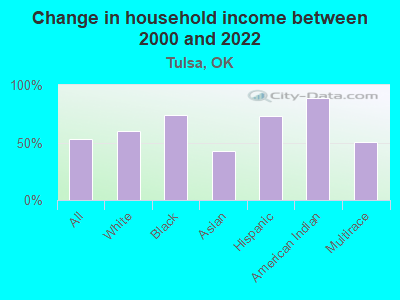
Change in median household income between 2000 and 2022:
Tulsa, Oklahoma:
+53.0%
State:
+78.7%
Number of households with income < $10k:
Tulsa:
8.2% (14,500)
State:
6.4% (100,950)
Number of households with income $10k - 20k:
Tulsa:
8.1% (14,318)
State:
8.8% (137,709)
Number of households with income $20k - 30k:
Tulsa:
9.3% (16,428)
Oklahoma:
9.1% (143,661)
Number of households with income $30k - 40k:
Tulsa:
10.5% (18,426)
Oklahoma:
9.0% (141,098)
Number of households with income $40k - 50k:
Tulsa:
9.9% (17,485)
Oklahoma:
8.9% (140,217)
Number of households with income $50k - 60k:
Tulsa:
8.4% (14,771)
Oklahoma:
8.1% (126,882)
Number of households with income $60k - 75k:
Tulsa:
9.9% (17,480)
Oklahoma:
10.0% (157,916)
Number of households with income $75k - 100k:
Tulsa:
10.6% (18,581)
Oklahoma:
12.4% (195,015)
Number of households with income $100k - 125k:
Tulsa:
7.4% (12,975)
State:
9.0% (141,779)
Number of households with income $125k - 150k:
Tulsa:
5.1% (8,999)
State:
5.8% (91,594)
Number of households with income $150k - 200k:
Tulsa:
5.6% (9,842)
State:
6.3% (98,589)
Number of households with income > $200k:
Tulsa:
6.9% (12,138)
State:
6.2% (97,770)
Aggregate household income in Tulsa in 2022: $14,597,138,800
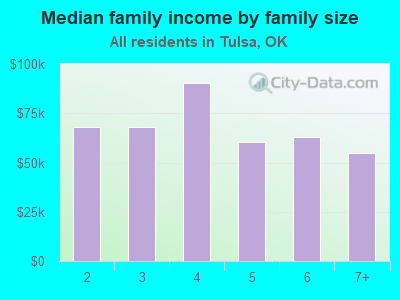
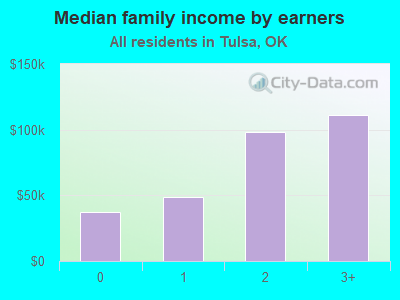
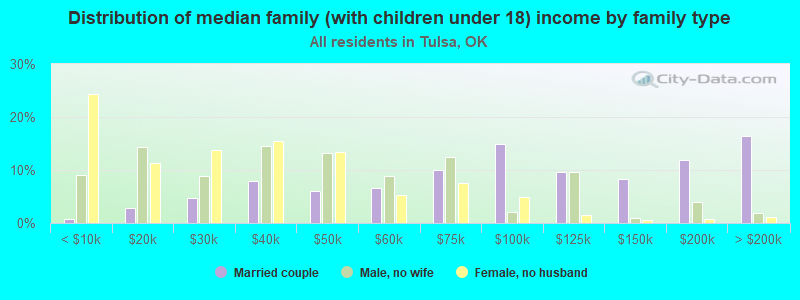
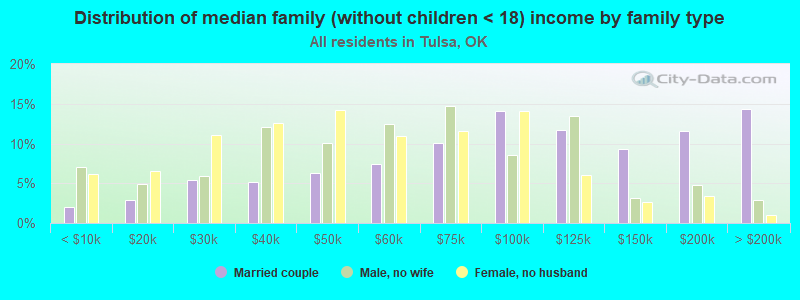
Median family income in Tulsa in 2022:
Tulsa:
$69,784
State:
$75,476
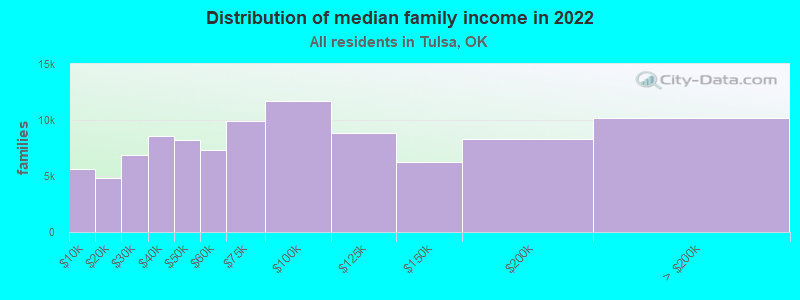
Number of families with income < $10k:
Tulsa:
5.8% (5,622)
Oklahoma:
4.2% (42,724)
Number of families with income $10k - 20k:
Tulsa:
5.0% (4,862)
State:
4.9% (49,571)
Number of families with income $20k - 30k:
Tulsa:
7.1% (6,876)
State:
6.3% (64,367)
Number of families with income $30k - 40k:
Tulsa:
8.8% (8,544)
State:
7.5% (76,467)
Number of families with income $40k - 50k:
Tulsa:
8.5% (8,181)
State:
8.3% (84,578)
Number of families with income $50k - 60k:
Tulsa:
7.6% (7,344)
State:
7.8% (79,642)
Number of families with income $60k - 75k:
Tulsa:
10.2% (9,876)
State:
10.6% (108,169)
Number of families with income $75k - 100k:
Tulsa:
12.1% (11,724)
State:
14.6% (148,857)
Number of families with income $100k - 125k:
Tulsa:
9.2% (8,881)
State:
11.2% (113,480)
Number of families with income $125k - 150k:
Tulsa:
6.5% (6,254)
Oklahoma:
7.6% (77,253)
Number of families with income $150k - 200k:
Tulsa:
8.6% (8,317)
State:
8.4% (85,947)
Number of families with income > $200k:
Tulsa:
10.5% (10,185)
State:
8.5% (86,531)
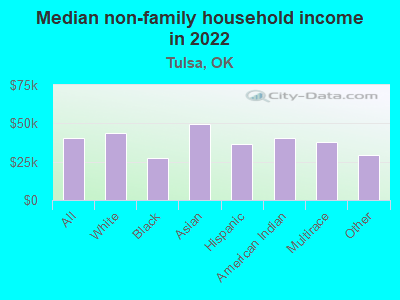
Median non-family income in Tulsa in 2022:
Tulsa:
$40,142
Oklahoma:
$35,419
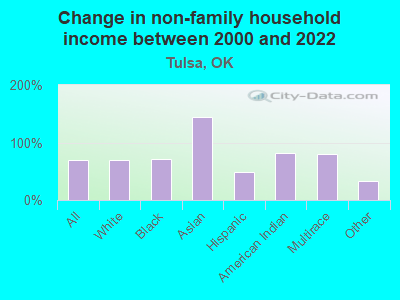
Change in median non-family income between 2000 and 2022:
Tulsa, Oklahoma:
+68.7%
State:
+83.2%
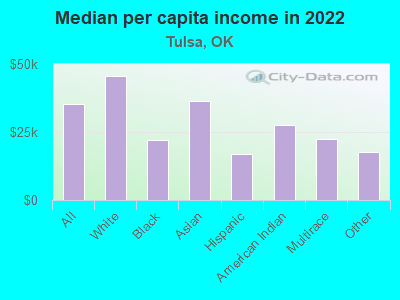
Median per capita income in Tulsa in 2022:
Tulsa:
$35,447
Oklahoma:
$32,930
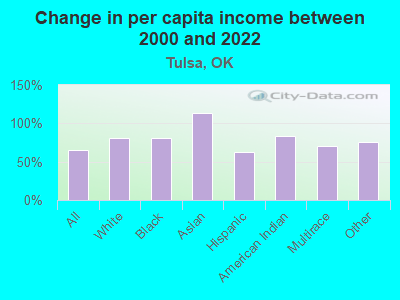
Change in median per capita income between 2000 and 2022:
Tulsa, Oklahoma:
+64.6%
Oklahoma:
+86.6%
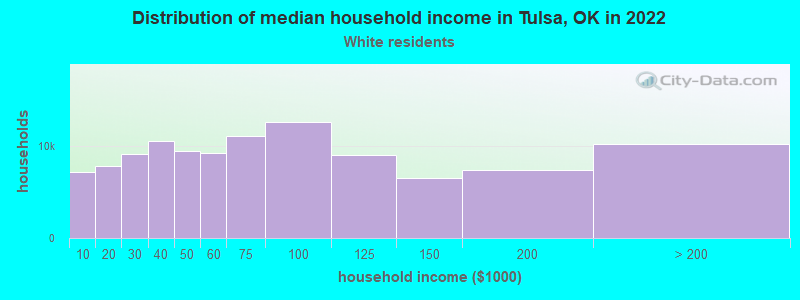
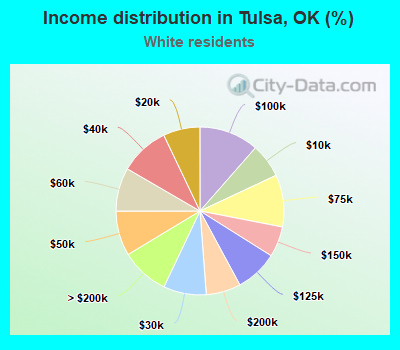
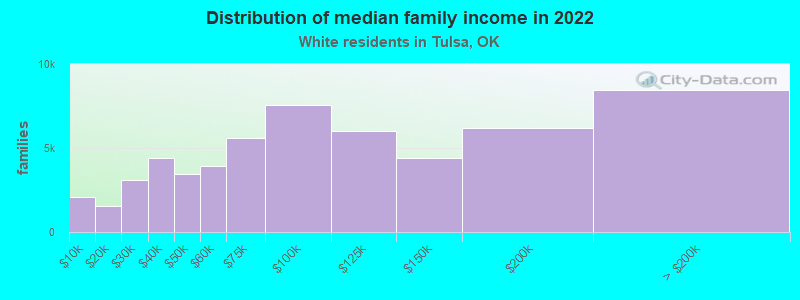
Income statistics for White residents
Median household income in Tulsa, OK in 2022:
Tulsa:
$61,825
State:
$63,444
Change in median household income between 2000 and 2022:
Tulsa, Oklahoma:
+59.7%
State:
+79.3%
Number of households with income < $10k:
Tulsa:
6.6% (7,180)
State:
5.5% (60,994)
Number of households with income $10k - 20k:
Tulsa:
7.1% (7,755)
State:
8.2% (91,263)
Number of households with income $20k - 30k:
Tulsa:
8.3% (9,057)
State:
8.7% (96,988)
Number of households with income $30k - 40k:
Tulsa:
9.5% (10,459)
State:
8.4% (93,121)
Number of households with income $40k - 50k:
Tulsa:
8.6% (9,467)
State:
8.6% (95,446)
Number of households with income $50k - 60k:
Tulsa:
8.4% (9,173)
Oklahoma:
7.9% (87,723)
Number of households with income $60k - 75k:
Tulsa:
10.0% (10,997)
State:
9.9% (109,955)
Number of households with income $75k - 100k:
Tulsa:
11.5% (12,559)
Oklahoma:
12.9% (143,880)
Number of households with income $100k - 125k:
Tulsa:
8.2% (8,957)
Oklahoma:
9.7% (107,851)
Number of households with income $125k - 150k:
Tulsa:
5.9% (6,444)
State:
6.3% (69,802)
Number of households with income $150k - 200k:
Tulsa:
6.7% (7,316)
State:
6.9% (76,863)
Number of households with income > $200k:
Tulsa:
9.3% (10,163)
State:
7.0% (78,099)
Aggregate household income in Tulsa in 2022: $10,495,193,400
Median family income in Tulsa in 2022:
Tulsa:
$86,916
Oklahoma:
$82,251
Number of families with income < $10k:
Tulsa:
3.6% (2,063)
Oklahoma:
3.4% (24,057)
Number of families with income $10k - 20k:
Tulsa:
2.7% (1,525)
State:
4.1% (29,440)
Number of families with income $20k - 30k:
Tulsa:
5.4% (3,076)
State:
5.7% (40,670)
Number of families with income $30k - 40k:
Tulsa:
7.8% (4,409)
Oklahoma:
6.5% (46,540)
Number of families with income $40k - 50k:
Tulsa:
6.1% (3,465)
State:
7.7% (55,082)
Number of families with income $50k - 60k:
Tulsa:
6.9% (3,935)
Oklahoma:
7.5% (53,408)
Number of families with income $60k - 75k:
Tulsa:
9.9% (5,594)
Oklahoma:
10.4% (74,624)
Number of families with income $75k - 100k:
Tulsa:
13.3% (7,530)
State:
15.3% (109,679)
Number of families with income $100k - 125k:
Tulsa:
10.6% (6,029)
Oklahoma:
12.0% (86,208)
Number of families with income $125k - 150k:
Tulsa:
7.8% (4,412)
State:
8.3% (59,328)
Number of families with income $150k - 200k:
Tulsa:
10.9% (6,166)
Oklahoma:
9.4% (67,640)
Number of families with income > $200k:
Tulsa:
14.9% (8,454)
State:
9.7% (69,551)
Median non-family income in Tulsa in 2022:
Tulsa:
$43,473
State:
$36,941
Change in median non-family income between 2000 and 2022:
Tulsa, Oklahoma:
+69.0%
State:
+83.5%
Median per capita income in Tulsa in 2022:
Tulsa:
$45,717
Oklahoma:
$37,390
Change in median per capita income between 2000 and 2022:
Tulsa, Oklahoma:
+80.9%
State:
+92.4%
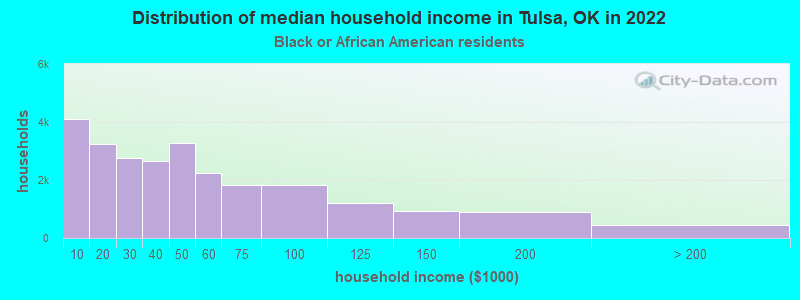
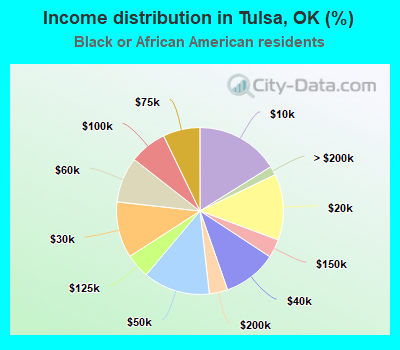
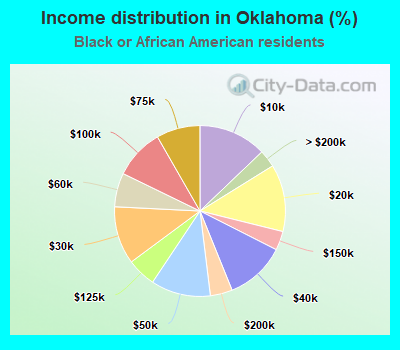
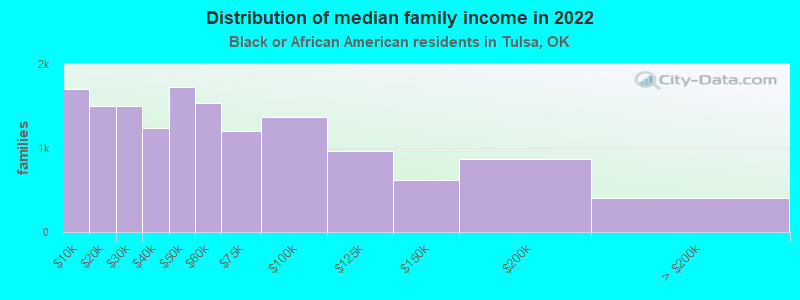
Income statistics for Black or African American residents
Median household income in Tulsa, OK in 2022:
Tulsa:
$39,779
State:
$41,135
Change in median household income between 2000 and 2022:
Tulsa, Oklahoma:
+73.5%
Oklahoma:
+72.7%
Number of households with income < $10k:
Tulsa:
16.1% (4,096)
State:
12.9% (13,905)
Number of households with income $10k - 20k:
Tulsa:
12.8% (3,253)
State:
12.7% (13,734)
Number of households with income $20k - 30k:
Tulsa:
10.9% (2,764)
State:
11.0% (11,826)
Number of households with income $30k - 40k:
Tulsa:
10.4% (2,647)
State:
11.4% (12,301)
Number of households with income $40k - 50k:
Tulsa:
12.9% (3,291)
State:
11.3% (12,200)
Number of households with income $50k - 60k:
Tulsa:
8.8% (2,243)
State:
6.4% (6,925)
Number of households with income $60k - 75k:
Tulsa:
7.2% (1,821)
Oklahoma:
8.3% (8,947)
Number of households with income $75k - 100k:
Tulsa:
7.3% (1,844)
State:
9.5% (10,253)
Number of households with income $100k - 125k:
Tulsa:
4.7% (1,198)
Oklahoma:
5.5% (5,928)
Number of households with income $125k - 150k:
Tulsa:
3.6% (915)
Oklahoma:
3.6% (3,885)
Number of households with income $150k - 200k:
Tulsa:
3.6% (903)
Oklahoma:
4.2% (4,529)
Number of households with income > $200k:
Tulsa:
1.7% (440)
State:
3.3% (3,551)
Aggregate household income in Tulsa in 2022: $1,312,941,800
Median family income in Tulsa in 2022:
Tulsa:
$48,515
Oklahoma:
$53,226
Number of families with income < $10k:
Tulsa:
11.6% (1,704)
Oklahoma:
8.4% (5,089)
Number of families with income $10k - 20k:
Tulsa:
10.2% (1,501)
Oklahoma:
7.7% (4,638)
Number of families with income $20k - 30k:
Tulsa:
10.2% (1,500)
Oklahoma:
10.1% (6,085)
Number of families with income $30k - 40k:
Tulsa:
8.5% (1,241)
State:
10.7% (6,478)
Number of families with income $40k - 50k:
Tulsa:
11.8% (1,726)
State:
10.1% (6,091)
Number of families with income $50k - 60k:
Tulsa:
10.5% (1,538)
Oklahoma:
8.1% (4,896)
Number of families with income $60k - 75k:
Tulsa:
8.2% (1,203)
State:
9.4% (5,686)
Number of families with income $75k - 100k:
Tulsa:
9.4% (1,373)
State:
12.4% (7,470)
Number of families with income $100k - 125k:
Tulsa:
6.6% (968)
State:
7.5% (4,544)
Number of families with income $125k - 150k:
Tulsa:
4.3% (625)
Oklahoma:
4.7% (2,864)
Number of families with income $150k - 200k:
Tulsa:
5.9% (870)
State:
5.7% (3,474)
Number of families with income > $200k:
Tulsa:
2.8% (406)
Oklahoma:
5.2% (3,167)
Median non-family income in Tulsa in 2022:
Tulsa:
$27,148
State:
$27,166
Change in median non-family income between 2000 and 2022:
Tulsa, Oklahoma:
+72.3%
State:
+81.9%
Median per capita income in Tulsa in 2022:
Tulsa:
$22,158
Oklahoma:
$24,741
Change in median per capita income between 2000 and 2022:
Tulsa, Oklahoma:
+80.8%
State:
+98.7%
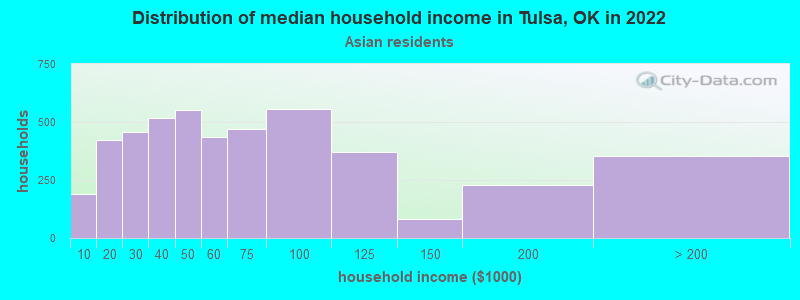
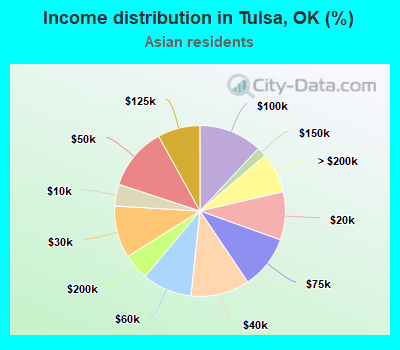
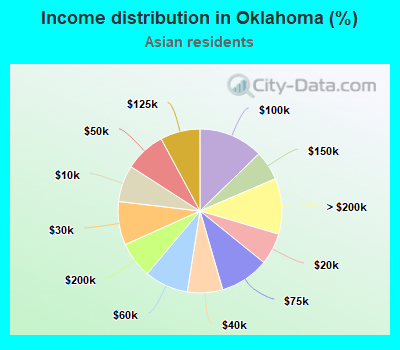
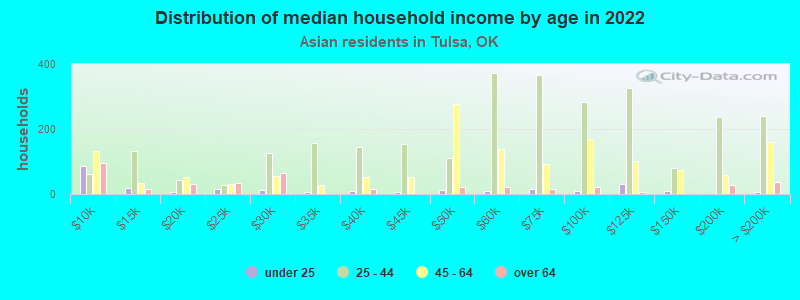
Income statistics for Asian residents
Median household income in Tulsa, OK in 2022:
Tulsa:
$55,970
State:
$65,557
Change in median household income between 2000 and 2022:
Tulsa, Oklahoma:
+42.7%
State:
+89.8%
Number of households with income < $10k:
Tulsa:
4.1% (191)
Oklahoma:
7.2% (2,371)
Number of households with income $10k - 20k:
Tulsa:
9.1% (422)
State:
6.2% (2,045)
Number of households with income $20k - 30k:
Tulsa:
9.9% (458)
State:
8.6% (2,814)
Number of households with income $30k - 40k:
Tulsa:
11.1% (516)
Oklahoma:
6.9% (2,280)
Number of households with income $40k - 50k:
Tulsa:
11.9% (552)
State:
8.1% (2,646)
Number of households with income $50k - 60k:
Tulsa:
9.4% (435)
State:
8.7% (2,845)
Number of households with income $60k - 75k:
Tulsa:
10.1% (468)
State:
9.7% (3,194)
Number of households with income $75k - 100k:
Tulsa:
12.0% (555)
State:
12.7% (4,184)
Number of households with income $100k - 125k:
Tulsa:
8.0% (372)
State:
7.8% (2,576)
Number of households with income $125k - 150k:
Tulsa:
1.8% (84)
State:
5.8% (1,910)
Number of households with income $150k - 200k:
Tulsa:
5.0% (230)
State:
7.1% (2,342)
Number of households with income > $200k:
Tulsa:
7.6% (352)
Oklahoma:
11.0% (3,610)
Aggregate household income in Tulsa in 2022: $388,858,600
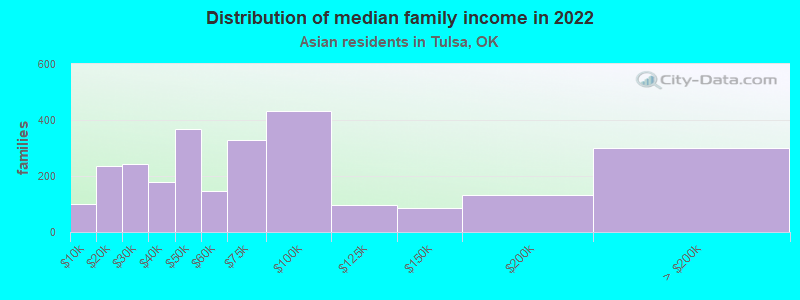
Median family income in Tulsa in 2022:
Tulsa:
$63,553
State:
$86,230
Number of families with income < $10k:
Tulsa:
3.8% (100)
State:
3.6% (747)
Number of families with income $10k - 20k:
Tulsa:
8.9% (235)
State:
4.1% (848)
Number of families with income $20k - 30k:
Tulsa:
9.2% (244)
Oklahoma:
3.6% (735)
Number of families with income $30k - 40k:
Tulsa:
6.8% (179)
State:
5.9% (1,215)
Number of families with income $40k - 50k:
Tulsa:
13.9% (369)
State:
8.1% (1,675)
Number of families with income $50k - 60k:
Tulsa:
5.6% (148)
Oklahoma:
7.2% (1,487)
Number of families with income $60k - 75k:
Tulsa:
12.4% (327)
State:
10.9% (2,238)
Number of families with income $75k - 100k:
Tulsa:
16.3% (431)
State:
16.9% (3,488)
Number of families with income $100k - 125k:
Tulsa:
3.6% (96)
Oklahoma:
6.7% (1,389)
Number of families with income $125k - 150k:
Tulsa:
3.2% (84)
State:
8.6% (1,770)
Number of families with income $150k - 200k:
Tulsa:
5.0% (133)
State:
9.7% (1,989)
Number of families with income > $200k:
Tulsa:
11.3% (300)
Oklahoma:
14.6% (3,001)
Median non-family income in Tulsa in 2022:
Tulsa:
$49,439
State:
$42,116
Change in median non-family income between 2000 and 2022:
Tulsa, Oklahoma:
+144.7%
State:
+229.5%
Median per capita income in Tulsa in 2022:
Tulsa:
$36,403
State:
$36,283
Change in median per capita income between 2000 and 2022:
Tulsa, Oklahoma:
+114.1%
Oklahoma:
+131.2%
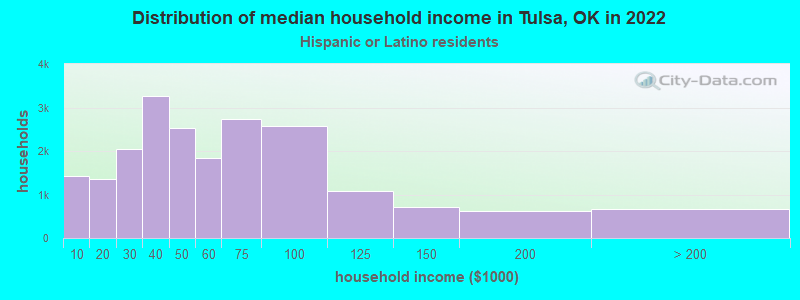
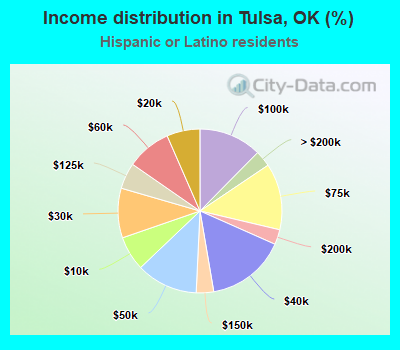
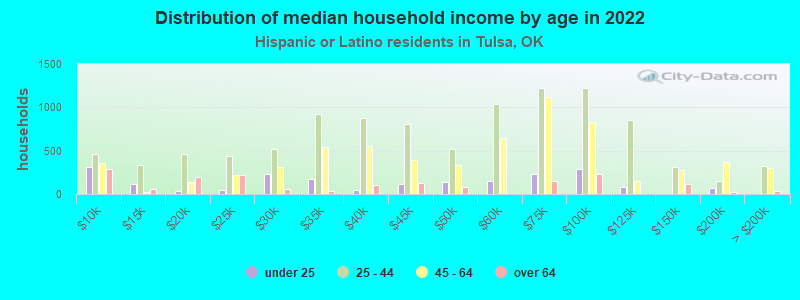
Income statistics for Hispanic or Latino residents
Median household income in Tulsa, OK in 2022:
Tulsa:
$49,162
State:
$52,856
Change in median household income between 2000 and 2022:
Tulsa, Oklahoma:
+73.2%
State:
+89.4%
Number of households with income < $10k:
Tulsa:
6.8% (1,415)
State:
6.0% (7,958)
Number of households with income $10k - 20k:
Tulsa:
6.6% (1,363)
State:
8.4% (11,153)
Number of households with income $20k - 30k:
Tulsa:
9.8% (2,038)
Oklahoma:
9.7% (13,003)
Number of households with income $30k - 40k:
Tulsa:
15.7% (3,257)
Oklahoma:
11.7% (15,624)
Number of households with income $40k - 50k:
Tulsa:
12.2% (2,529)
Oklahoma:
11.0% (14,697)
Number of households with income $50k - 60k:
Tulsa:
8.8% (1,831)
Oklahoma:
9.6% (12,832)
Number of households with income $60k - 75k:
Tulsa:
13.1% (2,729)
State:
12.2% (16,321)
Number of households with income $75k - 100k:
Tulsa:
12.4% (2,582)
State:
12.5% (16,668)
Number of households with income $100k - 125k:
Tulsa:
5.2% (1,072)
State:
7.5% (9,988)
Number of households with income $125k - 150k:
Tulsa:
3.4% (715)
Oklahoma:
4.5% (6,042)
Number of households with income $150k - 200k:
Tulsa:
3.0% (617)
State:
3.8% (5,080)
Number of households with income > $200k:
Tulsa:
3.2% (658)
Oklahoma:
3.0% (4,063)
Aggregate household income in Tulsa in 2022: $1,336,708,000
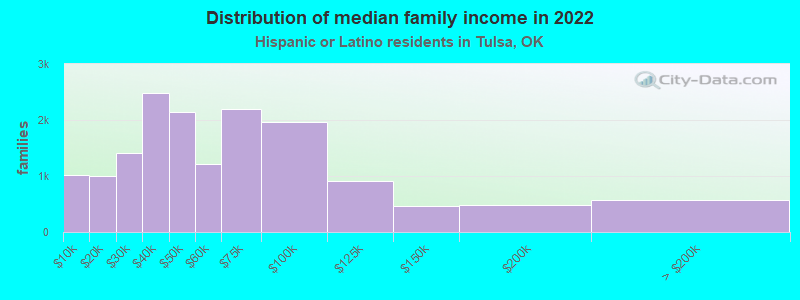
Median family income in Tulsa in 2022:
Tulsa:
$49,368
State:
$55,896
Number of families with income < $10k:
Tulsa:
6.4% (1,020)
State:
5.1% (5,166)
Number of families with income $10k - 20k:
Tulsa:
6.3% (1,006)
State:
6.4% (6,492)
Number of families with income $20k - 30k:
Tulsa:
8.8% (1,406)
State:
8.4% (8,466)
Number of families with income $30k - 40k:
Tulsa:
15.7% (2,491)
State:
12.3% (12,391)
Number of families with income $40k - 50k:
Tulsa:
13.5% (2,148)
State:
11.7% (11,827)
Number of families with income $50k - 60k:
Tulsa:
7.7% (1,223)
Oklahoma:
9.7% (9,746)
Number of families with income $60k - 75k:
Tulsa:
13.8% (2,201)
State:
12.9% (13,025)
Number of families with income $75k - 100k:
Tulsa:
12.4% (1,966)
State:
13.1% (13,152)
Number of families with income $100k - 125k:
Tulsa:
5.7% (912)
State:
8.2% (8,262)
Number of families with income $125k - 150k:
Tulsa:
2.9% (468)
Oklahoma:
4.6% (4,629)
Number of families with income $150k - 200k:
Tulsa:
3.0% (484)
State:
3.9% (3,936)
Number of families with income > $200k:
Tulsa:
3.6% (580)
State:
3.6% (3,637)
Median non-family income in Tulsa in 2022:
Tulsa:
$36,225
State:
$33,093
Change in median non-family income between 2000 and 2022:
Tulsa, Oklahoma:
+48.6%
State:
+64.0%
Median per capita income in Tulsa in 2022:
Tulsa:
$17,087
Oklahoma:
$19,473
Change in median per capita income between 2000 and 2022:
Tulsa, Oklahoma:
+62.9%
State:
+97.3%
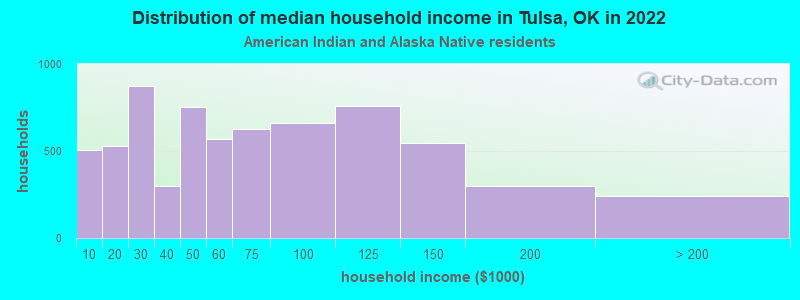
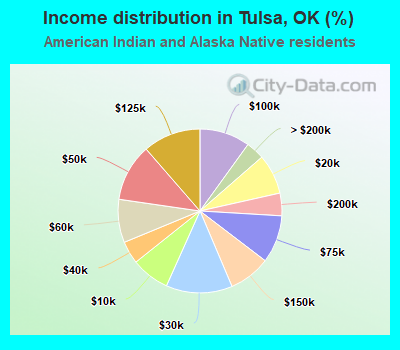
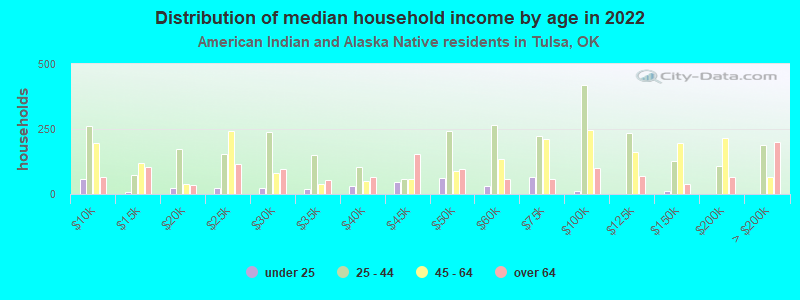
Income statistics for American Indian and Alaska Native residents
Median household income in Tulsa, OK in 2022:
Tulsa:
$55,880
State:
$53,261
Change in median household income between 2000 and 2022:
Tulsa, Oklahoma:
+88.7%
Oklahoma:
+94.7%
Number of households with income < $10k:
Tulsa:
7.6% (505)
State:
8.0% (7,959)
Number of households with income $10k - 20k:
Tulsa:
7.9% (526)
Oklahoma:
11.2% (11,175)
Number of households with income $20k - 30k:
Tulsa:
13.1% (872)
State:
9.7% (9,654)
Number of households with income $30k - 40k:
Tulsa:
4.5% (297)
State:
9.1% (9,092)
Number of households with income $40k - 50k:
Tulsa:
11.3% (753)
State:
9.1% (9,020)
Number of households with income $50k - 60k:
Tulsa:
8.5% (568)
State:
8.8% (8,714)
Number of households with income $60k - 75k:
Tulsa:
9.4% (627)
Oklahoma:
10.7% (10,616)
Number of households with income $75k - 100k:
Tulsa:
10.0% (663)
State:
11.5% (11,402)
Number of households with income $100k - 125k:
Tulsa:
11.4% (758)
State:
8.8% (8,769)
Number of households with income $125k - 150k:
Tulsa:
8.2% (548)
Oklahoma:
5.0% (4,965)
Number of households with income $150k - 200k:
Tulsa:
4.5% (297)
State:
4.5% (4,512)
Number of households with income > $200k:
Tulsa:
3.6% (242)
Oklahoma:
3.6% (3,569)
Aggregate household income in Tulsa in 2022: $491,388,600
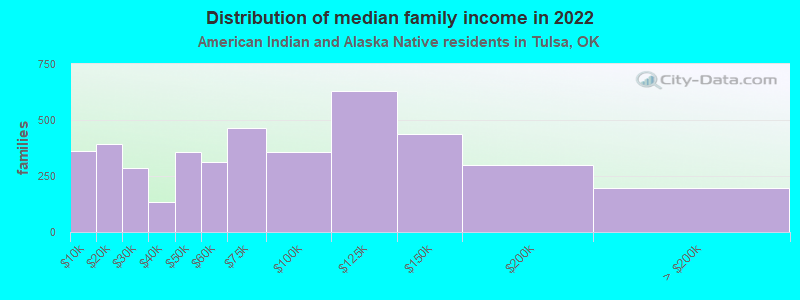
Median family income in Tulsa in 2022:
Tulsa:
$70,384
Oklahoma:
$61,590
Number of families with income < $10k:
Tulsa:
8.5% (360)
Oklahoma:
7.2% (4,788)
Number of families with income $10k - 20k:
Tulsa:
9.3% (393)
Oklahoma:
6.3% (4,189)
Number of families with income $20k - 30k:
Tulsa:
6.8% (287)
State:
7.3% (4,840)
Number of families with income $30k - 40k:
Tulsa:
3.1% (132)
Oklahoma:
8.6% (5,712)
Number of families with income $40k - 50k:
Tulsa:
8.5% (358)
State:
9.6% (6,398)
Number of families with income $50k - 60k:
Tulsa:
7.4% (314)
State:
9.9% (6,556)
Number of families with income $60k - 75k:
Tulsa:
11.0% (464)
State:
10.8% (7,198)
Number of families with income $75k - 100k:
Tulsa:
8.5% (358)
Oklahoma:
12.8% (8,500)
Number of families with income $100k - 125k:
Tulsa:
14.9% (630)
Oklahoma:
10.6% (7,043)
Number of families with income $125k - 150k:
Tulsa:
10.4% (439)
Oklahoma:
6.5% (4,331)
Number of families with income $150k - 200k:
Tulsa:
7.0% (297)
State:
5.9% (3,955)
Number of families with income > $200k:
Tulsa:
4.6% (195)
State:
4.5% (3,014)
Median non-family income in Tulsa in 2022:
Tulsa:
$40,488
State:
$30,288
Change in median non-family income between 2000 and 2022:
Tulsa, Oklahoma:
+81.6%
Oklahoma:
+92.2%
Median per capita income in Tulsa in 2022:
Tulsa:
$27,514
State:
$25,549
Change in median per capita income between 2000 and 2022:
Tulsa, Oklahoma:
+83.0%
Oklahoma:
+118.7%
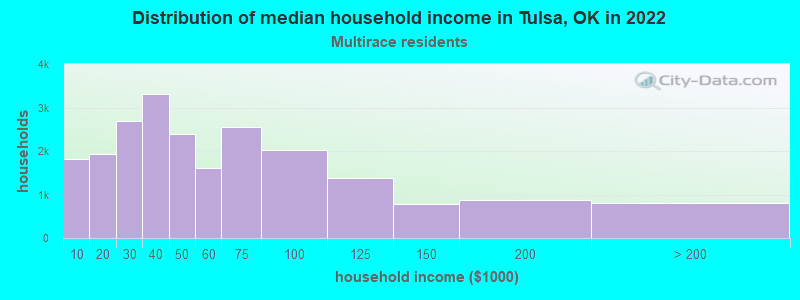
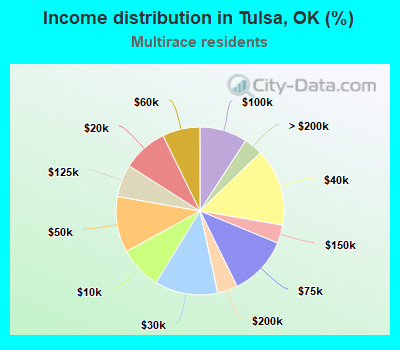
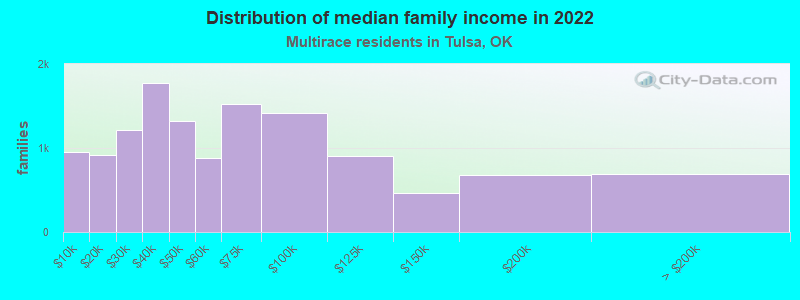
Income statistics for Multirace residents
Median household income in Tulsa, OK in 2022:
Tulsa:
$44,320
State:
$53,626
Change in median household income between 2000 and 2022:
Tulsa, Oklahoma:
+50.6%
Oklahoma:
+81.7%
Number of households with income < $10k:
Tulsa:
8.2% (1,827)
State:
6.8% (11,975)
Number of households with income $10k - 20k:
Tulsa:
8.7% (1,930)
State:
8.9% (15,797)
Number of households with income $20k - 30k:
Tulsa:
12.1% (2,689)
State:
10.2% (18,071)
Number of households with income $30k - 40k:
Tulsa:
14.9% (3,310)
State:
11.0% (19,477)
Number of households with income $40k - 50k:
Tulsa:
10.8% (2,387)
State:
9.3% (16,501)
Number of households with income $50k - 60k:
Tulsa:
7.2% (1,605)
State:
8.9% (15,635)
Number of households with income $60k - 75k:
Tulsa:
11.5% (2,547)
Oklahoma:
10.9% (19,250)
Number of households with income $75k - 100k:
Tulsa:
9.2% (2,029)
Oklahoma:
11.5% (20,279)
Number of households with income $100k - 125k:
Tulsa:
6.3% (1,387)
State:
8.0% (14,067)
Number of households with income $125k - 150k:
Tulsa:
3.5% (778)
State:
4.9% (8,612)
Number of households with income $150k - 200k:
Tulsa:
3.9% (865)
State:
5.0% (8,897)
Number of households with income > $200k:
Tulsa:
3.6% (805)
State:
4.5% (7,970)
Aggregate household income in Tulsa in 2022: $1,476,199,700
Median family income in Tulsa in 2022:
Tulsa:
$51,532
State:
$62,946
Number of families with income < $10k:
Tulsa:
7.5% (957)
State:
5.1% (6,084)
Number of families with income $10k - 20k:
Tulsa:
7.2% (919)
State:
6.9% (8,220)
Number of families with income $20k - 30k:
Tulsa:
9.6% (1,219)
Oklahoma:
7.7% (9,202)
Number of families with income $30k - 40k:
Tulsa:
13.9% (1,779)
State:
10.8% (12,890)
Number of families with income $40k - 50k:
Tulsa:
10.4% (1,323)
Oklahoma:
9.6% (11,468)
Number of families with income $50k - 60k:
Tulsa:
6.9% (879)
State:
7.7% (9,220)
Number of families with income $60k - 75k:
Tulsa:
11.9% (1,519)
Oklahoma:
11.3% (13,582)
Number of families with income $75k - 100k:
Tulsa:
11.1% (1,420)
State:
13.1% (15,759)
Number of families with income $100k - 125k:
Tulsa:
7.1% (906)
State:
10.2% (12,250)
Number of families with income $125k - 150k:
Tulsa:
3.6% (464)
Oklahoma:
5.7% (6,776)
Number of families with income $150k - 200k:
Tulsa:
5.3% (674)
State:
6.3% (7,594)
Number of families with income > $200k:
Tulsa:
5.4% (694)
Oklahoma:
5.7% (6,851)
Median non-family income in Tulsa in 2022:
Tulsa:
$37,803
Oklahoma:
$34,773
Change in median non-family income between 2000 and 2022:
Tulsa, Oklahoma:
+80.0%
Oklahoma:
+103.1%
Median per capita income in Tulsa in 2022:
Tulsa:
$22,265
State:
$23,085
Change in median per capita income between 2000 and 2022:
Tulsa, Oklahoma:
+71.3%
State:
+93.8%
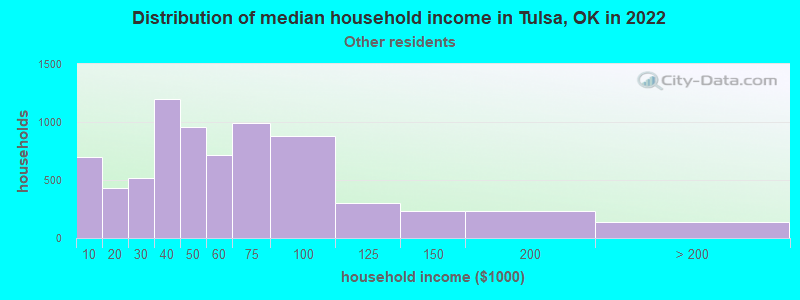
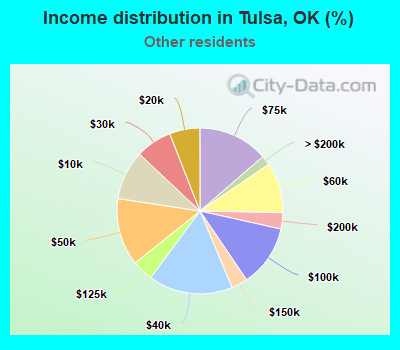
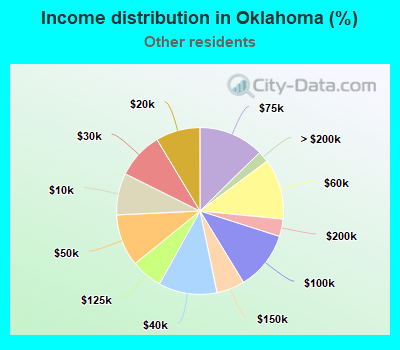
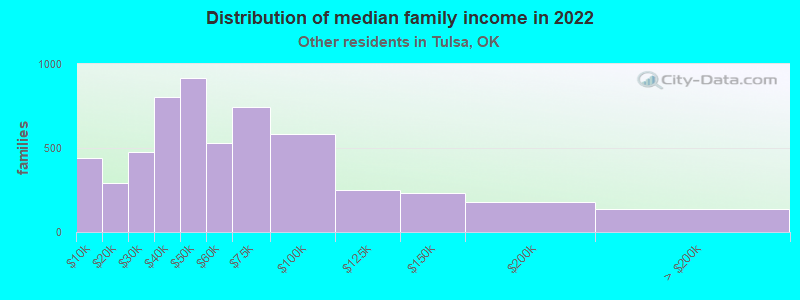
Income statistics for other residents
Median household income in Tulsa, OK in 2022:
Tulsa:
$48,968
State:
$52,612
Number of households with income < $10k:
Tulsa:
9.6% (701)
State:
8.1% (3,420)
Number of households with income $10k - 20k:
Tulsa:
5.9% (432)
State:
8.6% (3,635)
Number of households with income $20k - 30k:
Tulsa:
7.1% (514)
State:
9.0% (3,808)
Number of households with income $30k - 40k:
Tulsa:
16.4% (1,197)
State:
11.4% (4,791)
Number of households with income $40k - 50k:
Tulsa:
13.1% (957)
State:
10.1% (4,256)
Number of households with income $50k - 60k:
Tulsa:
9.8% (716)
Oklahoma:
11.7% (4,946)
Number of households with income $60k - 75k:
Tulsa:
13.7% (995)
Oklahoma:
12.7% (5,342)
Number of households with income $75k - 100k:
Tulsa:
12.0% (877)
Oklahoma:
11.4% (4,792)
Number of households with income $100k - 125k:
Tulsa:
4.2% (303)
State:
6.1% (2,568)
Number of households with income $125k - 150k:
Tulsa:
3.2% (230)
State:
5.4% (2,298)
Number of households with income $150k - 200k:
Tulsa:
3.2% (231)
State:
3.4% (1,427)
Number of households with income > $200k:
Tulsa:
1.9% (136)
State:
2.2% (918)
Aggregate household income in Tulsa in 2022: $419,771,000
Median family income in Tulsa in 2022:
Tulsa:
$48,816
State:
$55,625
Number of families with income < $10k:
Tulsa:
7.9% (438)
State:
5.7% (1,864)
Number of families with income $10k - 20k:
Tulsa:
5.2% (289)
State:
6.8% (2,219)
Number of families with income $20k - 30k:
Tulsa:
8.5% (476)
State:
8.5% (2,761)
Number of families with income $30k - 40k:
Tulsa:
14.4% (804)
Oklahoma:
11.1% (3,618)
Number of families with income $40k - 50k:
Tulsa:
16.4% (914)
Oklahoma:
11.6% (3,768)
Number of families with income $50k - 60k:
Tulsa:
9.5% (530)
Oklahoma:
12.4% (4,039)
Number of families with income $60k - 75k:
Tulsa:
13.4% (746)
State:
13.0% (4,231)
Number of families with income $75k - 100k:
Tulsa:
10.4% (581)
State:
11.5% (3,726)
Number of families with income $100k - 125k:
Tulsa:
4.5% (252)
Oklahoma:
6.3% (2,046)
Number of families with income $125k - 150k:
Tulsa:
4.1% (230)
State:
6.4% (2,088)
Number of families with income $150k - 200k:
Tulsa:
3.2% (177)
Oklahoma:
3.9% (1,276)
Number of families with income > $200k:
Tulsa:
2.4% (136)
State:
2.7% (894)
Median non-family income in Tulsa in 2022:
Tulsa:
$29,091
Oklahoma:
$28,279
Change in median non-family income between 2000 and 2022:
Tulsa, Oklahoma:
+33.3%
State:
+38.2%
Median per capita income in Tulsa in 2022:
Tulsa:
$17,630
State:
$21,007
Change in median per capita income between 2000 and 2022:
Tulsa, Oklahoma:
+76.4%
Oklahoma:
+119.2%
Discuss Tulsa, Oklahoma (OK) on our hugely popular Oklahoma forum.