Terre Haute, IN (Indiana) Houses and Residents
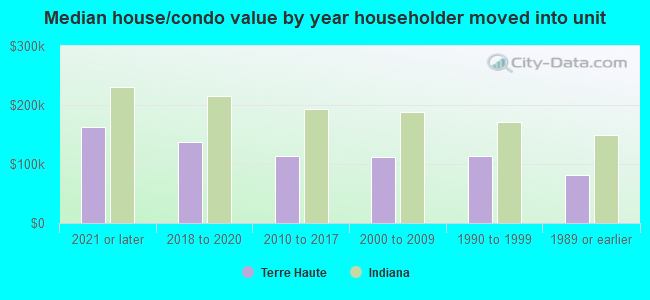
| Terre Haute: | $111,524 |
| Indiana: | $208,700 |
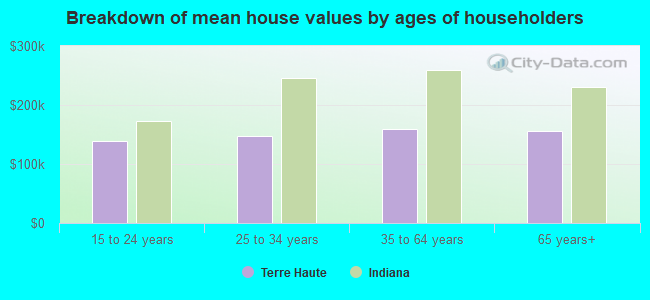
Mean price in 2022:
Detached houses: $160,494
Here: $160,494 State: $257,916 Townhouses or other attached units: $106,183
Here: $106,183 State: $224,114 In 2-unit structures: $120,869
Here: $120,869 State: $175,375 In 3-to-4-unit structures: $100,581
Here: $100,581 State: $151,116 In 5-or-more-unit structures: $65,418
Here: $65,418 State: $200,844 Mobile homes: $183,147
Here: $183,147 State: $67,116
Total population: 60,956 (Urban population: 59,286, Rural population: 277 (all nonfarm))
Houses: 26,220 (23,059 occupied: 12,280 owner occupied, 10,876 renter occupied)
| % of renters here: | 47% |
| State: | 29% |
Housing density: 839 houses/condos per square mile
Median price asked for vacant for-sale houses and condos in 2022: $109,368.
Median contract rent in 2022: $654 (lower quartile is $498, upper quartile is $840)
Median rent asked for vacant for-rent units in 2022: $816
Median gross rent in Terre Haute, IN in 2022: $870
Housing units in Terre Haute with a mortgage: 7,111 (755 second mortgage, 23 home equity loan, 611 both second mortgage and home equity loan)
Houses without a mortgage: 388
Median household income for houses/condos with a mortgage: $73,201
Median household income for apartments without a mortgage: $33,017
Median monthly housing costs: $832
Compare current foreclosures in Terre Haute, IN:
| Photo | Address | Area | Beds / Baths | Price | Details |
|---|---|---|---|---|---|

|
#1
N 10th St
Terre Haute, IN 47804
|
1,052 sq. feet
|
1 baths 3 beds |
$118,900
|
show details |

|
#2
Adams Blvd
Terre Haute, IN 47803
|
1,766 sq. feet
|
2 baths 3 beds |
$169,900
|
show details |

|
#3
N 27th St
Terre Haute, IN 47803
|
2,232 sq. feet
|
2 baths 3 beds |
$59,900
|
show details |

|
#4
S 16th St
Terre Haute, IN 47807
|
- sq. feet
|
1 baths 3 beds |
$49,900
|
show details |

|
#5
Eagle St
Terre Haute, IN 47807
|
1,189 sq. feet
|
1 baths 2 beds |
$39,900
|
show details |

|
#6
E Sandalwood Ave
Terre Haute, IN 47805
|
1,850 sq. feet
|
2 baths 4 beds |
show details | |

|
#7
E Springhill Dr
Terre Haute, IN 47802
|
1,260 sq. feet
|
1 baths 3 beds |
show details | |

|
#8
N 13th St
Terre Haute, IN 47804
|
1,609 sq. feet
|
1 baths 3 beds |
show details | |

|
#9
E Phylbeck Ave
Terre Haute, IN 47805
|
2,028 sq. feet
|
1 baths 3 beds |
show details | |

|
#10
N 11th St
Terre Haute, IN 47804
|
2,096 sq. feet
|
3 baths - beds |
show details |
| Photo | Address | Area | Beds / Baths | Price | Details |
|---|---|---|---|---|---|

|
#11
S 20th St
Terre Haute, IN 47802
|
1,096 sq. feet
|
2 baths 3 beds |
show details | |

|
#12
N 11th St
Terre Haute, IN 47804
|
1,950 sq. feet
|
3 baths 3 beds |
show details | |

|
#13
E Woodburn Dr
Terre Haute, IN 47802
|
1,357 sq. feet
|
1 baths 3 beds |
show details | |

|
#14
Spruce St
Terre Haute, IN 47807
|
2,079 sq. feet
|
1 baths 4 beds |
show details | |

|
#15
Clay Ave
Terre Haute, IN 47805
|
1,024 sq. feet
|
1 baths 2 beds |
show details | |

|
#16
1st Ave
Terre Haute, IN 47807
|
1,596 sq. feet
|
1 baths 4 beds |
show details | |

|
#17
S State Road 46
Terre Haute, IN 47802
|
1,670 sq. feet
|
2 baths 4 beds |
show details | |

|
#18
Aikman Pl
Terre Haute, IN 47803
|
800 sq. feet
|
1 baths 2 beds |
show details | |

|
#19
Willkie Rd
Terre Haute, IN 47802
|
1,618 sq. feet
|
2 baths 3 beds |
show details | |

|
#20
E Devonald Ave
Terre Haute, IN 47805
|
1,457 sq. feet
|
2 baths 3 beds |
show details |
| Photo | Address | Area | Beds / Baths | Price | Details |
|---|---|---|---|---|---|

|
#21
Clay Ave
Terre Haute, IN 47805
|
1,305 sq. feet
|
1 baths 3 beds |
show details | |

|
#22
N Robertson St
Terre Haute, IN 47805
|
1,404 sq. feet
|
2 baths 3 beds |
show details | |

|
#23
College Ave
Terre Haute, IN 47803
|
2,222 sq. feet
|
1 baths 3 beds |
show details | |

|
#24
Terre Vista Dr
Terre Haute, IN 47803
|
1,568 sq. feet
|
2 baths 3 beds |
show details | |

|
#25
N 25th St
Terre Haute, IN 47805
|
2,028 sq. feet
|
2 baths 4 beds |
show details | |

|
#26
Fenwood Ave
Terre Haute, IN 47803
|
2,936 sq. feet
|
1 baths 3 beds |
show details | |

|
#27
Cox Rd
Terre Haute, IN 47802
|
1,715 sq. feet
|
1 baths 3 beds |
show details | |

|
#28
Washington Ave
Terre Haute, IN 47803
|
1,302 sq. feet
|
1 baths 2 beds |
show details | |

|
#29
E Chandler Ave
Terre Haute, IN 47803
|
1,012 sq. feet
|
1 baths 2 beds |
show details | |

|
#30
N 11th St
Terre Haute, IN 47804
|
2,748 sq. feet
|
2 baths 4 beds |
show details |
| Photo | Address | Area | Beds / Baths | Price | Details |
|---|---|---|---|---|---|

|
#31
W Henry Dr
Terre Haute, IN 47802
|
2,004 sq. feet
|
2 baths 3 beds |
show details | |

|
#32
S 27th St
Terre Haute, IN 47803
|
925 sq. feet
|
1 baths 2 beds |
show details | |

|
#33
S 8th St
Terre Haute, IN 47802
|
1,344 sq. feet
|
1 baths 3 beds |
show details | |

|
#34
4th Ave
Terre Haute, IN 47807
|
1,554 sq. feet
|
2 baths 3 beds |
show details | |

|
#35
S 22nd St
Terre Haute, IN 47803
|
2,068 sq. feet
|
1 baths 3 beds |
show details | |

|
#36
S 18th St
Terre Haute, IN 47803
|
1,122 sq. feet
|
1 baths 2 beds |
show details | |

|
#37
Kings Ct
Terre Haute, IN 47802
|
1,212 sq. feet
|
2 baths 3 beds |
show details | |

|
#38
E Broadlands Ave
Terre Haute, IN 47805
|
1,232 sq. feet
|
1 baths 2 beds |
show details | |

|
#39
Linden St
Terre Haute, IN 47804
|
1,438 sq. feet
|
1 baths 3 beds |
show details | |

|
#40
8th Ave
Terre Haute, IN 47804
|
2,142 sq. feet
|
1 baths 2 beds |
show details |
| Photo | Address | Area | Beds / Baths | Price | Details |
|---|---|---|---|---|---|

|
#41
S 8th St
Terre Haute, IN 47802
|
1,824 sq. feet
|
1 baths 3 beds |
show details | |

|
#42
Cruft St
Terre Haute, IN 47803
|
1,728 sq. feet
|
1 baths 4 beds |
show details | |

|
#43
S 23rd St
Terre Haute, IN 47803
|
1,246 sq. feet
|
1 baths 2 beds |
show details | |

|
#44
W Evans Dr
Terre Haute, IN 47802
|
1,680 sq. feet
|
2 baths 3 beds |
show details | |

|
#45
2nd Ave
Terre Haute, IN 47807
|
1,372 sq. feet
|
1 baths 3 beds |
show details | |

|
#46
8th Ave
Terre Haute, IN 47804
|
1,147 sq. feet
|
1 baths 2 beds |
show details | |

|
#47
S Belmar Pl
Terre Haute, IN 47802
|
1,608 sq. feet
|
2 baths 3 beds |
show details | |

|
#48
Clay Ave
Terre Haute, IN 47805
|
1,624 sq. feet
|
1 baths 3 beds |
show details | |

|
#49
Wabash Ave
Terre Haute, IN 47803
|
1,869 sq. feet
|
2 baths 3 beds |
show details | |

|
Check over 1 million property listings on Foreclosure.com!
|
browse all offers | |||


 | Current articles on US growth trends and how it relates to Indianapolis (37 replies) |
| Indiana living is my kind of heaven.. (44 replies) |
| Ranking Indy's mid sized satellite cities: Terre Haute, Lafayette, Kokomo, Marion, Muncie, Anderson, Richmond (49 replies) |
| Paris, IL or Terre Haute? (10 replies) |
| Terre Haute area (1 reply) |
| How Hoosiers pronounce certain words (60 replies) |
Median year apartment built: 1975
Household type by relationship:
Households: 58,406- Male householders: 10,651 (3,882 living alone), Female householders: 12,360 (5,068 living alone)
7,479 spouses (7,384 opposite-sex spouses), 2,007 unmarried partners, (1,996 opposite-sex unmarried partners), 13,050 children (12,102 natural, 440 adopted, 507 stepchildren), 1,313 grandchildren, 402 brothers or sisters, 423 parents, 26 foster children, 858 other relatives, 3,240 non-relatives
- In group quarters: 6,592
Size of family households: 5,865 2-persons, 2,105 3-persons, 2,203 4-persons, 848 5-persons, 396 6-persons, 300 7-or-more-persons.
Size of nonfamily households: 9,316 1-person, 1,920 2-persons, 459 3-persons, 101 4-persons, 99 5-persons.
5,963 married couples with children.
3,984 single-parent households (1,455 men, 2,529 women).
93.0% of residents of Terre Haute speak English at home.
3.2% of residents speak Spanish at home (67% speak English very well, 9% speak English well, 12% speak English not well, 12% don't speak English at all).
1.1% of residents speak other Indo-European language at home (85% speak English very well, 14% speak English well, 2% speak English not well).
1.6% of residents speak Asian or Pacific Island language at home (71% speak English very well, 20% speak English well, 9% speak English not well, 1% don't speak English at all).
0.8% of residents speak other language at home (73% speak English very well, 23% speak English well, 3% speak English not well).
Foreign born population: 1,612 (2.8%)
(40.7% of them are naturalized citizens)
| Here: | 6.0 |
| State: | 6.6 |
| Here: | 4.3 |
| State: | 4.3 |
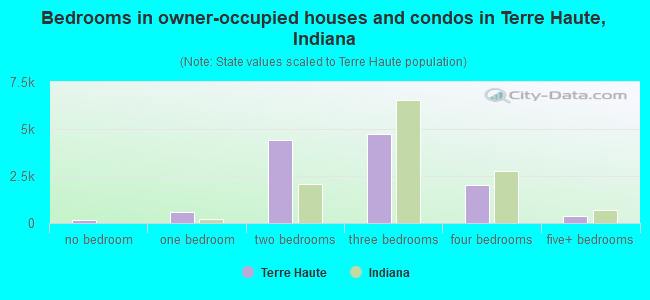
- Bedrooms in owner-occupied houses and condos in Terre Haute, Indiana
- 146no bedroom
- 5831 bedroom
- 4,4262 bedrooms
- 4,7363 bedrooms
- 1,9984 bedrooms
- 3915+ bedrooms
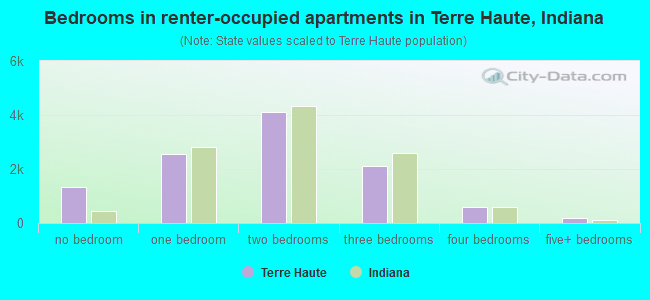
- Bedrooms in renter-occupied apartments in Terre Haute, Indiana
- 1,343no bedroom
- 2,5471 bedroom
- 4,1262 bedrooms
- 2,1153 bedrooms
- 5764 bedrooms
- 1705+ bedrooms
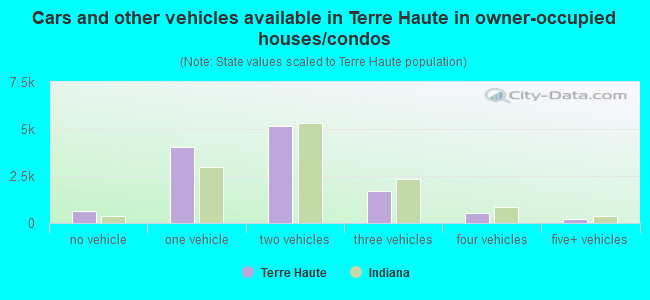
- Cars and other vehicles available in Terre Haute in owner-occupied houses/condos
- 623no vehicle
- 4,0461 vehicle
- 5,1752 vehicles
- 1,7113 vehicles
- 5244 vehicles
- 2025+ vehicles
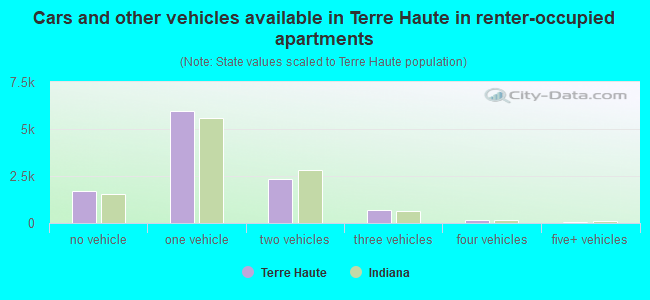
- Cars and other vehicles available in Terre Haute in renter-occupied apartments
- 1,701no vehicle
- 5,9541 vehicle
- 2,3452 vehicles
- 6753 vehicles
- 1454 vehicles
- 565+ vehicles
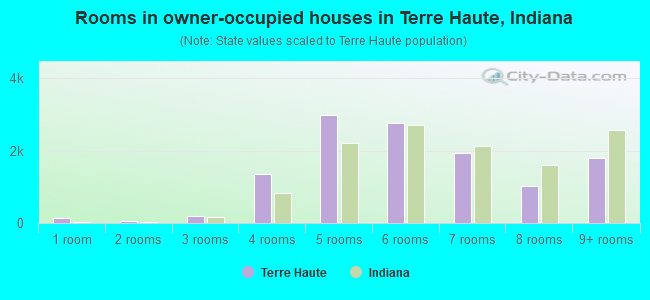
- Rooms in owner-occupied houses in Terre Haute, Indiana
- 1251 room
- 472 rooms
- 1953 rooms
- 1,3594 rooms
- 2,9905 rooms
- 2,7806 rooms
- 1,9467 rooms
- 1,0358 rooms
- 1,8039+ rooms
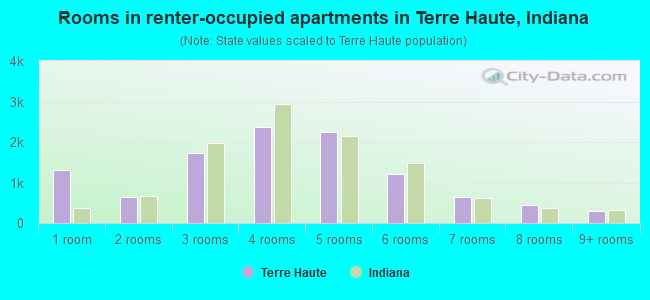
- Rooms in renter-occupied apartments in Terre Haute, Indiana
- 1,3181 room
- 6532 rooms
- 1,7173 rooms
- 2,3694 rooms
- 2,2485 rooms
- 1,2066 rooms
- 6497 rooms
- 4338 rooms
- 2849+ rooms
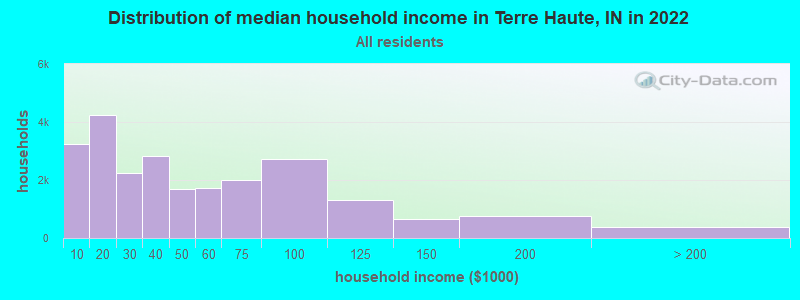
Terre Haute, IN household income distribution

- 3,247Less than $10,000
- 4,253$10,000 to $19,999
- 2,246$20,000 to $29,999
- 2,836$30,000 to $39,999
- 1,698$40,000 to $49,999
- 1,732$50,000 to $59,999
- 1,984$60,000 to $74,999
- 2,721$75,000 to $99,999
- 1,324$100,000 to $124,999
- 638$125,000 to $149,999
- 766$150,000 to $199,999
- 386$200,000 or more
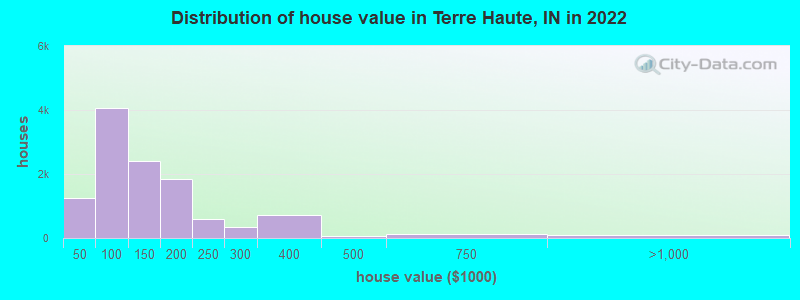
Home value of owner - occupied houses in 2022 in Terre Haute, IN
-
- 169Less than $10,000
- 105$10,000 to $14,999
- 54$15,000 to $19,999
- 221$20,000 to $24,999
- 151$25,000 to $29,999
- 133$30,000 to $34,999
- 126$35,000 to $39,999
- 276$40,000 to $49,999
- 455$50,000 to $59,999
- 463$60,000 to $69,999
- 1,523$70,000 to $79,999
- 731$80,000 to $89,999
- 604$90,000 to $99,999
- 1,356$100,000 to $124,999
- 1,039$125,000 to $149,999
- 1,294$150,000 to $174,999
- 564$175,000 to $199,999
- 596$200,000 to $249,999
- 339$250,000 to $299,999
- 728$300,000 to $399,999
- 72$400,000 to $499,999
- 133$500,000 to $749,999
- 48$750,000 to $999,999
- 12$1,000,000 to $1,499,999
- 12$1,500,000 to $1,999,999
- 18$2,000,000 or more
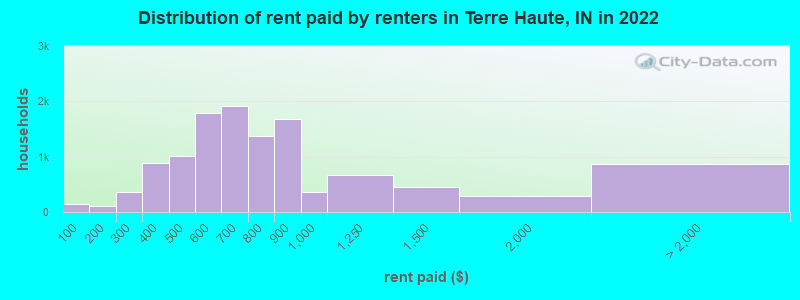
Rent paid by renters in 2022 in Terre Haute, IN
-
- 152Less than $100
- 104$100 to $149
- 10$150 to $199
- 155$200 to $249
- 205$250 to $299
- 514$300 to $349
- 378$350 to $399
- 490$400 to $449
- 529$450 to $499
- 1,077$500 to $549
- 716$550 to $599
- 991$600 to $649
- 932$650 to $699
- 752$700 to $749
- 621$750 to $799
- 1,678$800 to $899
- 362$900 to $999
- 668$1,000 to $1,249
- 443$1,250 to $1,499
- 286$1,500 to $1,999
- 208$2,000 to $2,499
- 103$2,500 to $2,999
- 88$3,000 to $3,499
- 12$3,500 or more
- 461No cash rent
Percentage of workers working in this county: 90.3%
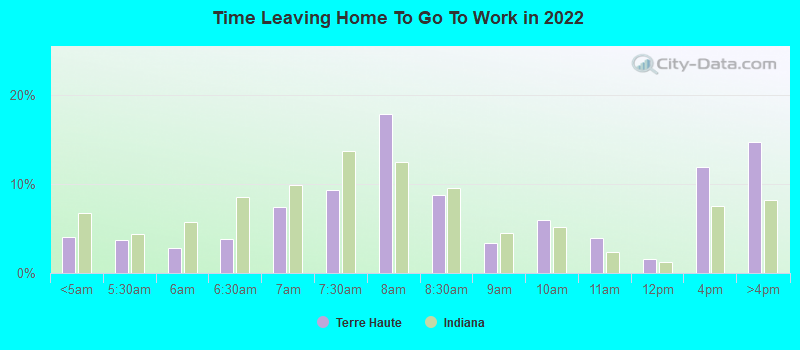
Number of people working at home: 1,251 (5.2% of all workers)
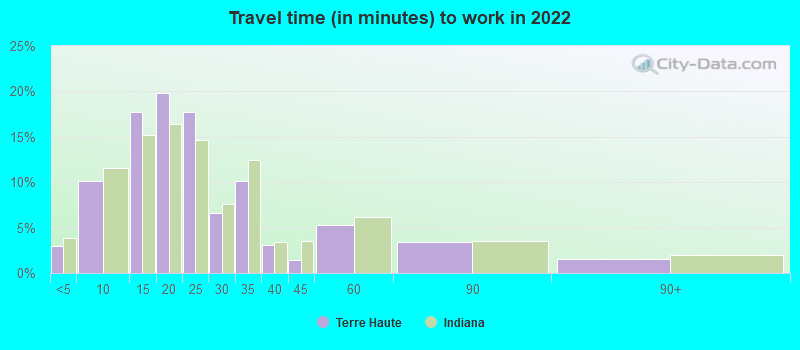
Travel time to work (commute)
- Less than 5 minutes: 1,014
- 5 to 9 minutes: 3,061
- 10 to 14 minutes: 5,068
- 15 to 19 minutes: 4,562
- 20 to 24 minutes: 3,024
- 25 to 29 minutes: 695
- 30 to 34 minutes: 1,239
- 35 to 39 minutes: 329
- 40 to 44 minutes: 143
- 45 to 59 minutes: 433
- 60 to 89 minutes: 616
- 90 or more minutes: 314
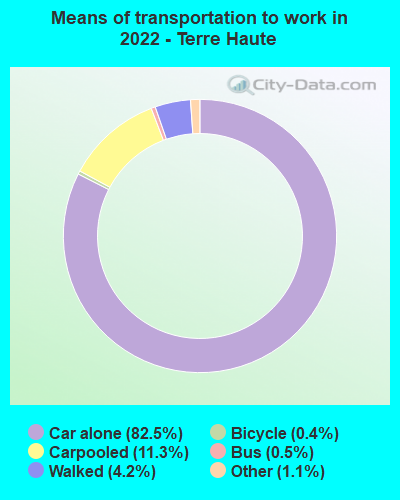
Means of transportation to work:
- Drove a car alone: 32,041 (77.5%)
- Carpooled: 4,854 (11.7%)
- Bus: 188 (0.5%)
- Taxi: 511 (1.2%)
- Bicycle: 188 (0.5%)
- Walked: 1,629 (3.9%)
- Worked at home: 1,251 (3.0%)
- Unemployment by race in 2022
- Unemployment rate for White non-Hispanic residents
- 6.8%Males
- 3.6%Females
- Unemployment rate for Black residents
- 5.5%Males
- 2.9%Females
- Unemployment rate for Asian residents
- 3.8%Females
- Unemployment rate for other race residents
- 0.2%Males
- 1.0%Females
- Unemployment rate for two or more race residents
- 13.0%Males
- 16.0%Females
- Unemployment rate for Hispanic or Latino residents
- 6.3%Males
- 10.5%Females
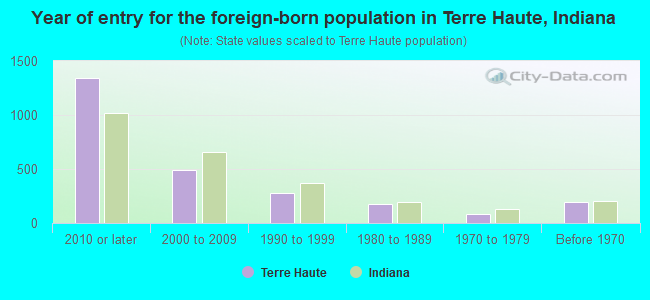
- Year of entry for the foreign-born population in Terre Haute, Indiana
- 1,3392010 or later
- 4882000 to 2009
- 2801990 to 1999
- 1791980 to 1989
- 811970 to 1979
- 195Before 1970
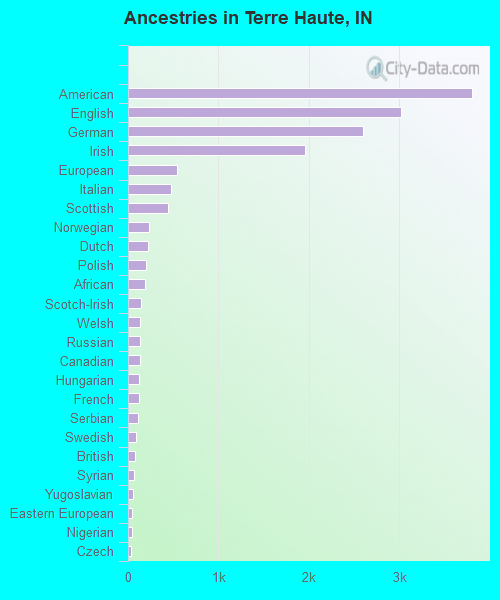
First ancestries reported:
- American: 3,803 (16.1%)
- English: 3,015 (12.7%)
- German: 2,602 (11.0%)
- Irish: 1,953 (8.3%)
- European: 544 (2.3%)
- Italian: 478 (2.0%)
- Scottish: 442 (1.9%)
- Norwegian: 237 (1.0%)
- Dutch: 224 (0.9%)
- Polish: 200 (0.8%)
- African: 185 (0.8%)
- Scotch-Irish: 144 (0.6%)
- Welsh: 136 (0.6%)
- Russian: 135 (0.6%)
- Canadian: 133 (0.6%)
- Hungarian: 118 (0.5%)
- French: 117 (0.5%)
- Serbian: 108 (0.5%)
- Swedish: 93 (0.4%)
- British: 82 (0.3%)
- Syrian: 61 (0.3%)
- Yugoslavian: 50 (0.2%)
- Eastern European: 45 (0.2%)
- Nigerian: 39 (0.2%)
- Czech: 36 (0.2%)
- Scandinavian: 36 (0.2%)
- Israeli: 32 (0.1%)
- Greek: 28 (0.1%)
- Lithuanian: 27 (0.1%)
- Kenyan: 26 (0.1%)
- Ghanaian: 22 (0.09%)
- Danish: 22 (0.09%)
- Ukrainian: 21 (0.09%)
- Romanian: 19 (0.08%)
- Czechoslovakian: 19 (0.08%)
- French Canadian: 18 (0.08%)
- Northern European: 16 (0.07%)
- Portuguese: 14 (0.06%)
- Iranian: 14 (0.06%)
- Australian: 14 (0.06%)
- Pennsylvania German: 12 (0.05%)
- Austrian: 9 (0.04%)
- Swiss: 5 (0.02%)
- Moroccan: 5 (0.02%)
Most common places of birth for foreign-born residents (%):
| Terre Haute: | 15.0% (373) |
| Indiana: | 8.5% (32,127) |
| Terre Haute: | 12.7% (315) |
| Indiana: | 27.0% (101,996) |
| Terre Haute: | 11.3% (281) |
| Indiana: | 5.3% (19,877) |
| Terre Haute: | 7.6% (188) |
| Indiana: | 2.1% (7,834) |
| Terre Haute: | 7.2% (178) |
| Indiana: | 3.1% (11,851) |
| Terre Haute: | 4.8% (119) |
| Indiana: | 1.7% (6,439) |
| Terre Haute: | 3.8% (94) |
| Indiana: | 0.6% (2,272) |
| Terre Haute: | 3.6% (89) |
| Indiana: | 0.3% (978) |
| Terre Haute: | 2.5% (62) |
| Indiana: | 0.4% (1,600) |
| Terre Haute: | 2.3% (57) |
| Indiana: | 1.6% (5,892) |
| Terre Haute: | 2.1% (51) |
| Indiana: | 0.9% (3,307) |
| Terre Haute: | 1.9% (47) |
| Indiana: | 0.4% (1,465) |
| Terre Haute: | 1.6% (40) |
| Indiana: | 0.5% (1,776) |
Place of birth for U.S.-born residents:
- This state: 39,935
- Other state: 16,507
- Northeast: 2,220
- Midwest: 7,785
- South: 4,837
- West: 1,577
79.0% of Terre Haute residents lived in the same house 1 years ago.
Out of people who lived in different houses, 36.1% lived in this county.
Out of people who lived in different counties, 65.0% lived in Indiana.
| Terre Haute: | 79.0% |
| State average: | 87.1% |
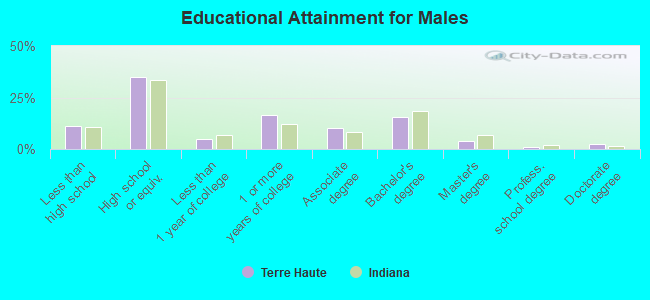
Education attainment for males 25 years and older:
- No schooling: 284
- Nursery to 4th grade: 35
- 5th and 6th grade: 64
- 7th and 8th grade: 227
- 9th grade: 365
- 10th grade: 343
- 11th grade: 397
- 12th grade, no diploma: 220
- High school graduate (or equivalency): 6,005
- Less than 1 year of college: 812
- Some college more than 1 year, no degree: 2,828
- Associate degree: 1,733
- Bachelor's degree: 2,680
- Master's degree: 632
- Professional school degree: 148
- Doctorate degree: 453
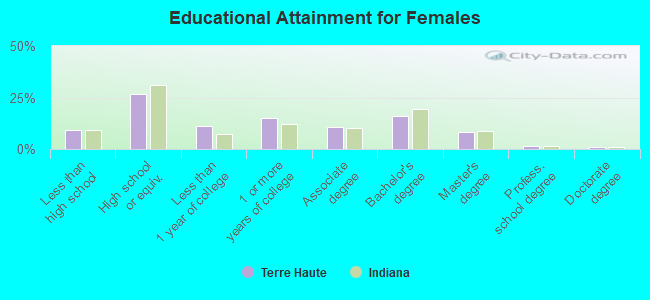
Education attainment for females 25 years and older:
- No schooling: 190
- Nursery to 4th grade: 6
- 5th and 6th grade: 7
- 7th and 8th grade: 161
- 9th grade: 325
- 10th grade: 336
- 11th grade: 344
- 12th grade, no diploma: 204
- High school graduate (or equivalency): 4,612
- Less than 1 year of college: 1,943
- Some college more than 1 year, no degree: 2,621
- Associate degree: 1,818
- Bachelor's degree: 2,788
- Master's degree: 1,461
- Professional school degree: 230
- Doctorate degree: 175
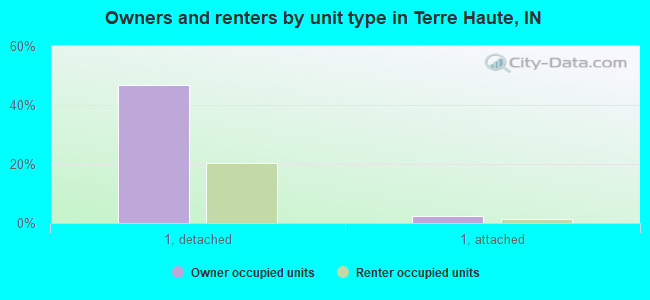
Housing units in structures:
- One, detached: 17,678
- One, attached: 630
- Two: 1,092
- 3 or 4: 2,234
- 5 to 9: 1,569
- 10 to 19: 660
- 20 to 49: 504
- 50 or more: 1,629
- Mobile homes: 192
- Boats, RVs, vans, etc.: 28
Median worth of mobile homes: $76,479
Housing units lacking complete kitchen facilities in 2022: 4.5%
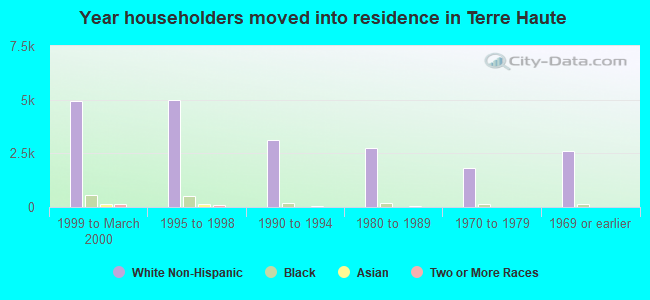
House/condo owner moved in on average 9 years ago
Renter moved in on average 3 years ago
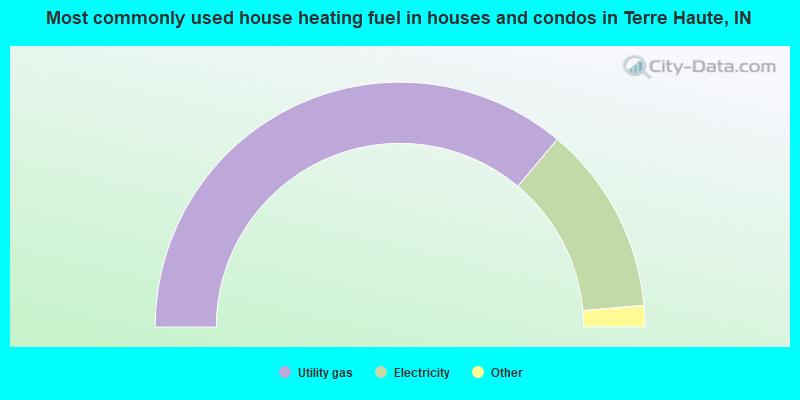
- 72.2%Utility gas
- 25.0%Electricity
- 1.3%Fuel oil, kerosene, etc.
- 1.0%Bottled, tank, or LP gas
- 0.2%Wood
- 0.2%No fuel used
- 0.1%Other fuel
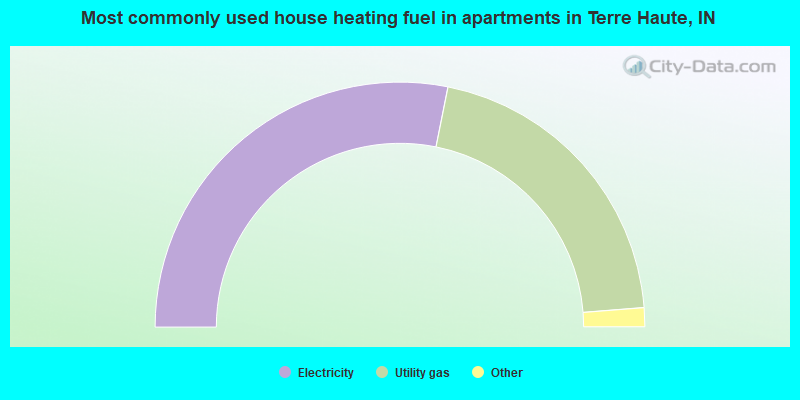
- 56.3%Electricity
- 41.2%Utility gas
- 0.7%Bottled, tank, or LP gas
- 0.6%Solar energy
- 0.6%Other fuel
- 0.2%No fuel used
- 0.2%Wood
- 0.1%Fuel oil, kerosene, etc.
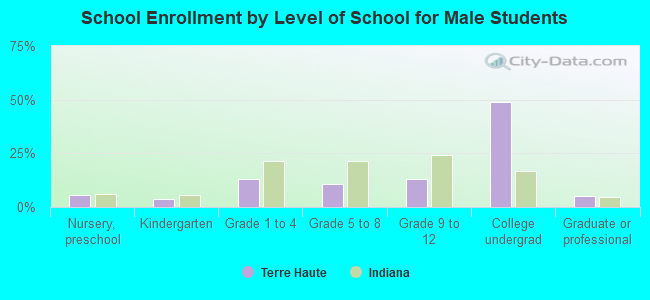
Private vs. public school enrollment:
| Here: | 9.8% |
| Indiana: | 14.9% |
| Here: | 8.4% |
| Indiana: | 11.4% |
| Here: | 22.2% |
| Indiana: | 22.3% |