Races in Terre Haute, Indiana (IN) Detailed Stats
Data:
Races - White alone (%)
Races - White alone (% change since 2000)
Races - Black alone (%)
Races - Black alone (% change since 2000)
Races - American Indian alone (%)
Races - American Indian alone (% change since 2000)
Races - Asian alone (%)
Races - Asian alone (% change since 2000)
Races - Hispanic (%)
Races - Hispanic (% change since 2000)
Races - Native Hawaiian and Other Pacific Islander alone (%)
Races - Native Hawaiian and Other Pacific Islander alone (% change since 2000)
Races - Two or more races(%)
Races - Two or more races(% change since 2000)
Races - Other race alone (%)
Races - Other race alone (% change since 2000)
Racial diversity
Place of birth - Born in state of residence (%)
Place of birth - Born in state of residence (%) - White
Place of birth - Born in state of residence (%) - Black or African American
Place of birth - Born in state of residence (%) - Asian
Place of birth - Born in state of residence (%) - Hispanic or Latino
Place of birth - Born in state of residence (%) - American Indian and Alaska Native
Place of birth - Born in state of residence (%) - Multirace
Place of birth - Born in state of residence (%) - Other Race
Place of birth - Born in other state (%)
Place of birth - Born in other state (%) - White
Place of birth - Born in other state (%) - Black or African American
Place of birth - Born in other state (%) - Asian
Place of birth - Born in other state (%) - Hispanic or Latino
Place of birth - Born in other state (%) - American Indian and Alaska Native
Place of birth - Born in other state (%) - Multirace
Place of birth - Born in other state (%) - Other Race
Place of birth - Native, outside of US (%)
Place of birth - Native, outside of US (%) - White
Place of birth - Native, outside of US (%) - Black or African American
Place of birth - Native, outside of US (%) - Asian
Place of birth - Native, outside of US (%) - Hispanic or Latino
Place of birth - Native, outside of US (%) - American Indian and Alaska Native
Place of birth - Native, outside of US (%) - Multirace
Place of birth - Native, outside of US (%) - Other Race
Place of birth - Foreign born (%)
Place of birth - Foreign born (%) - White
Place of birth - Foreign born (%) - Black or African American
Place of birth - Foreign born (%) - Asian
Place of birth - Foreign born (%) - Hispanic or Latino
Place of birth - Foreign born (%) - American Indian and Alaska Native
Place of birth - Foreign born (%) - Multirace
Place of birth - Foreign born (%) - Other Race
Residents speaking English at home (%)
Residents speaking English at home - Born in the United States (%)
Residents speaking English at home - Native, born elsewhere (%)
Residents speaking English at home - Foreign born (%)
Residents speaking Spanish at home (%)
Residents speaking Spanish at home - Born in the United States (%)
Residents speaking Spanish at home - Native, born elsewhere (%)
Residents speaking Spanish at home - Foreign born (%)
Residents speaking other language at home (%)
Residents speaking other language at home - Born in the United States (%)
Residents speaking other language at home - Native, born elsewhere (%)
Residents speaking other language at home - Foreign born (%)
Marital status - Never married (%)
Marital status - Now married (%)
Marital status - Separated (%)
Marital status - Widowed (%)
Marital status - Divorced (%)
Ancestries Reported - Arab (%)
Ancestries Reported - Czech (%)
Ancestries Reported - Danish (%)
Ancestries Reported - Dutch (%)
Ancestries Reported - English (%)
Ancestries Reported - French (%)
Ancestries Reported - French Canadian (%)
Ancestries Reported - German (%)
Ancestries Reported - Greek (%)
Ancestries Reported - Hungarian (%)
Ancestries Reported - Irish (%)
Ancestries Reported - Italian (%)
Ancestries Reported - Lithuanian (%)
Ancestries Reported - Norwegian (%)
Ancestries Reported - Polish (%)
Ancestries Reported - Portuguese (%)
Ancestries Reported - Russian (%)
Ancestries Reported - Scotch-Irish (%)
Ancestries Reported - Scottish (%)
Ancestries Reported - Slovak (%)
Ancestries Reported - Subsaharan African (%)
Ancestries Reported - Swedish (%)
Ancestries Reported - Swiss (%)
Ancestries Reported - Ukrainian (%)
Ancestries Reported - United States (%)
Ancestries Reported - Welsh (%)
Ancestries Reported - West Indian (%)
Ancestries Reported - Other (%)
Geographical mobility - Same house 1 year ago (%)
Geographical mobility - Same house 1 year ago (%) - White
Geographical mobility - Same house 1 year ago (%) - Black or African American
Geographical mobility - Same house 1 year ago (%) - Asian
Geographical mobility - Same house 1 year ago (%) - Hispanic or Latino
Geographical mobility - Same house 1 year ago (%) - American Indian and Alaska Native
Geographical mobility - Same house 1 year ago (%) - Multirace
Geographical mobility - Same house 1 year ago (%) - Other Race
Geographical mobility - Moved within same county (%)
Geographical mobility - Moved within same county (%) - White
Geographical mobility - Moved within same county (%) - Black or African American
Geographical mobility - Moved within same county (%) - Asian
Geographical mobility - Moved within same county (%) - Hispanic or Latino
Geographical mobility - Moved within same county (%) - American Indian and Alaska Native
Geographical mobility - Moved within same county (%) - Multirace
Geographical mobility - Moved within same county (%) - Other Race
Geographical mobility - Moved from different county within same state (%)
Geographical mobility - Moved from different county within same state (%) - White
Geographical mobility - Moved from different county within same state (%) - Black or African American
Geographical mobility - Moved from different county within same state (%) - Asian
Geographical mobility - Moved from different county within same state (%) - Hispanic or Latino
Geographical mobility - Moved from different county within same state (%) - American Indian and Alaska Native
Geographical mobility - Moved from different county within same state (%) - Multirace
Geographical mobility - Moved from different county within same state (%) - Other Race
Geographical mobility - Moved from different state (%)
Geographical mobility - Moved from different state (%) - White
Geographical mobility - Moved from different state (%) - Black or African American
Geographical mobility - Moved from different state (%) - Asian
Geographical mobility - Moved from different state (%) - Hispanic or Latino
Geographical mobility - Moved from different state (%) - American Indian and Alaska Native
Geographical mobility - Moved from different state (%) - Multirace
Geographical mobility - Moved from different state (%) - Other Race
Geographical mobility - Moved from abroad (%)
Geographical mobility - Moved from abroad (%) - White
Geographical mobility - Moved from abroad (%) - Black or African American
Geographical mobility - Moved from abroad (%) - Asian
Geographical mobility - Moved from abroad (%) - Hispanic or Latino
Geographical mobility - Moved from abroad (%) - American Indian and Alaska Native
Geographical mobility - Moved from abroad (%) - Multirace
Geographical mobility - Moved from abroad (%) - Other Race
Place of birth for the foreign-born population - Ireland (%)
Place of birth for the foreign-born population - Denmark (%)
Place of birth for the foreign-born population - Norway (%)
Place of birth for the foreign-born population - Sweden (%)
Place of birth for the foreign-born population - United Kingdom (%)
Place of birth for the foreign-born population - England (%)
Place of birth for the foreign-born population - Scotland (%)
Place of birth for the foreign-born population - Other Northern Europe (%)
Place of birth for the foreign-born population - Austria (%)
Place of birth for the foreign-born population - Belgium (%)
Place of birth for the foreign-born population - France (%)
Place of birth for the foreign-born population - Germany (%)
Place of birth for the foreign-born population - Netherlands (%)
Place of birth for the foreign-born population - Switzerland (%)
Place of birth for the foreign-born population - Other Western Europe (%)
Place of birth for the foreign-born population - Greece (%)
Place of birth for the foreign-born population - Italy (%)
Place of birth for the foreign-born population - Portugal (%)
Place of birth for the foreign-born population - Spain (%)
Place of birth for the foreign-born population - Other Southern Europe (%)
Place of birth for the foreign-born population - Albania (%)
Place of birth for the foreign-born population - Belarus (%)
Place of birth for the foreign-born population - Bosnia and Herzegovina (%)
Place of birth for the foreign-born population - Bulgaria (%)
Place of birth for the foreign-born population - Croatia (%)
Place of birth for the foreign-born population - Czechoslovakia (%)
Place of birth for the foreign-born population - Hungary (%)
Place of birth for the foreign-born population - Latvia (%)
Place of birth for the foreign-born population - Lithuania (%)
Place of birth for the foreign-born population - North Macedonia (Macedonia) (%)
Place of birth for the foreign-born population - Moldova (%)
Place of birth for the foreign-born population - Poland (%)
Place of birth for the foreign-born population - Romania (%)
Place of birth for the foreign-born population - Russia (%)
Place of birth for the foreign-born population - Serbia (%)
Place of birth for the foreign-born population - Ukraine (%)
Place of birth for the foreign-born population - Other Eastern Europe (%)
Place of birth for the foreign-born population - China (%)
Place of birth for the foreign-born population - Hong Kong (%)
Place of birth for the foreign-born population - Taiwan (%)
Place of birth for the foreign-born population - Japan (%)
Place of birth for the foreign-born population - Korea (%)
Place of birth for the foreign-born population - Other Eastern Asia (%)
Place of birth for the foreign-born population - Afghanistan (%)
Place of birth for the foreign-born population - Bangladesh (%)
Place of birth for the foreign-born population - India (%)
Place of birth for the foreign-born population - Iran (%)
Place of birth for the foreign-born population - Kazakhstan (%)
Place of birth for the foreign-born population - Nepal (%)
Place of birth for the foreign-born population - Pakistan (%)
Place of birth for the foreign-born population - Sri Lanka (%)
Place of birth for the foreign-born population - Uzbekistan (%)
Place of birth for the foreign-born population - Other South Central Asia (%)
Place of birth for the foreign-born population - Burma (%)
Place of birth for the foreign-born population - Cambodia (%)
Place of birth for the foreign-born population - Indonesia (%)
Place of birth for the foreign-born population - Laos (%)
Place of birth for the foreign-born population - Malaysia (%)
Place of birth for the foreign-born population - Philippines (%)
Place of birth for the foreign-born population - Singapore (%)
Place of birth for the foreign-born population - Thailand (%)
Place of birth for the foreign-born population - Vietnam (%)
Place of birth for the foreign-born population - Other South Eastern Asia (%)
Place of birth for the foreign-born population - Armenia (%)
Place of birth for the foreign-born population - Iraq (%)
Place of birth for the foreign-born population - Israel (%)
Place of birth for the foreign-born population - Jordan (%)
Place of birth for the foreign-born population - Kuwait (%)
Place of birth for the foreign-born population - Lebanon (%)
Place of birth for the foreign-born population - Saudi Arabia (%)
Place of birth for the foreign-born population - Syria (%)
Place of birth for the foreign-born population - Turkey (%)
Place of birth for the foreign-born population - Yemen (%)
Place of birth for the foreign-born population - Other Western Asia (%)
Place of birth for the foreign-born population - Eritrea (%)
Place of birth for the foreign-born population - Ethiopia (%)
Place of birth for the foreign-born population - Kenya (%)
Place of birth for the foreign-born population - Somalia (%)
Place of birth for the foreign-born population - Uganda (%)
Place of birth for the foreign-born population - Zimbabwe (%)
Place of birth for the foreign-born population - Other Eastern Africa (%)
Place of birth for the foreign-born population - Cameroon (%)
Place of birth for the foreign-born population - Congo (%)
Place of birth for the foreign-born population - Democratic Republic of Congo (Zaire) (%)
Place of birth for the foreign-born population - Other Middle Africa (%)
Place of birth for the foreign-born population - Egypt (%)
Place of birth for the foreign-born population - Morocco (%)
Place of birth for the foreign-born population - Sudan (%)
Place of birth for the foreign-born population - Other Northern Africa (%)
Place of birth for the foreign-born population - South Africa (%)
Place of birth for the foreign-born population - Other Southern Africa (%)
Place of birth for the foreign-born population - Cabo Verde (%)
Place of birth for the foreign-born population - Ghana (%)
Place of birth for the foreign-born population - Liberia (%)
Place of birth for the foreign-born population - Nigeria (%)
Place of birth for the foreign-born population - Senegal (%)
Place of birth for the foreign-born population - Sierra Leone (%)
Place of birth for the foreign-born population - Other Western Africa (%)
Place of birth for the foreign-born population - Australia (%)
Place of birth for the foreign-born population - New Zealand (%)
Place of birth for the foreign-born population - Fiji (%)
Place of birth for the foreign-born population - Micronesia (%)
Place of birth for the foreign-born population - Bahamas (%)
Place of birth for the foreign-born population - Barbados (%)
Place of birth for the foreign-born population - Cuba (%)
Place of birth for the foreign-born population - Dominica (%)
Place of birth for the foreign-born population - Dominican Republic (%)
Place of birth for the foreign-born population - Grenada (%)
Place of birth for the foreign-born population - Haiti (%)
Place of birth for the foreign-born population - Jamaica (%)
Place of birth for the foreign-born population - St. Vincent and the Grenadines (%)
Place of birth for the foreign-born population - Trinidad and Tobago (%)
Place of birth for the foreign-born population - West Indies (%)
Place of birth for the foreign-born population - Other Caribbean (%)
Place of birth for the foreign-born population - Belize (%)
Place of birth for the foreign-born population - Costa Rica (%)
Place of birth for the foreign-born population - El Salvador (%)
Place of birth for the foreign-born population - Guatemala (%)
Place of birth for the foreign-born population - Honduras (%)
Place of birth for the foreign-born population - Mexico (%)
Place of birth for the foreign-born population - Nicaragua (%)
Place of birth for the foreign-born population - Panama (%)
Place of birth for the foreign-born population - Other Central America (%)
Place of birth for the foreign-born population - Argentina (%)
Place of birth for the foreign-born population - Bolivia (%)
Place of birth for the foreign-born population - Brazil (%)
Place of birth for the foreign-born population - Chile (%)
Place of birth for the foreign-born population - Colombia (%)
Place of birth for the foreign-born population - Ecuador (%)
Place of birth for the foreign-born population - Guyana (%)
Place of birth for the foreign-born population - Peru (%)
Place of birth for the foreign-born population - Uruguay (%)
Place of birth for the foreign-born population - Venezuela (%)
Place of birth for the foreign-born population - Other South America (%)
Place of birth for the foreign-born population - Canada (%)
Place of birth for the foreign-born population - Other Northern America (%)
Place of birth for the foreign-born population - Other (%)
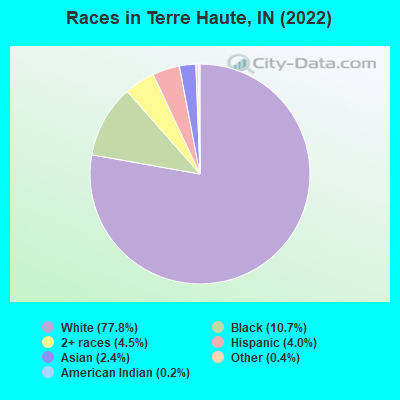
According to 2022 data, the most numerous races in Terre Haute, IN are White alone (45,890 residents), Black alone (6,339 residents), and Hispanic (2,358 residents). 93.0% of Terre Haute residents speak English at home. 4.2% of Terre Haute, IN residents are foreign-born (1.9% born in Asia, 0.8% born in Latin America, 0.6% born in Europe), which is 41.2% less than the foreign-born rate of 6.0% across the entire state of Indiana.
Race distribution in Terre Haute
2000 2022
5,219,373 85.8% White alone 505,462 8.3% Black alone 214,536 3.5% Hispanic 61,115 1.0% Two or more races 58,424 1.0% Asian alone 13,654 0.2% American Indian alone 6,348 0.1% Other race alone 1,573 0.03% Native Hawaiian and Other
5,192,455 76.0% White alone 628,054 9.2% Black alone 534,528 7.8% Hispanic 263,242 3.9% Two or more races 172,880 2.5% Asian alone 33,467 0.5% Other race alone 5,866 0.09% American Indian alone 2,545 0.04% Native Hawaiian and Other
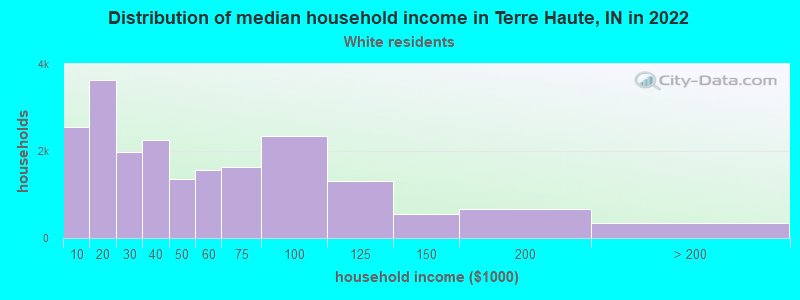
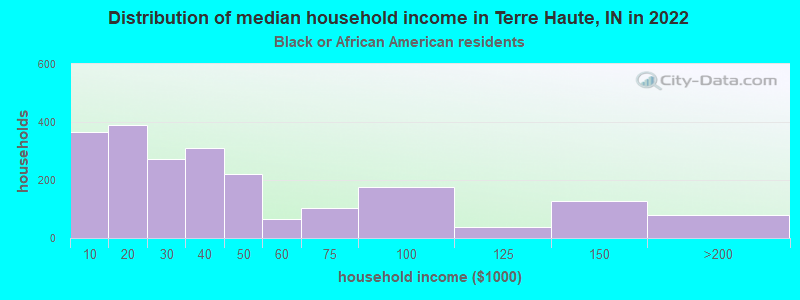
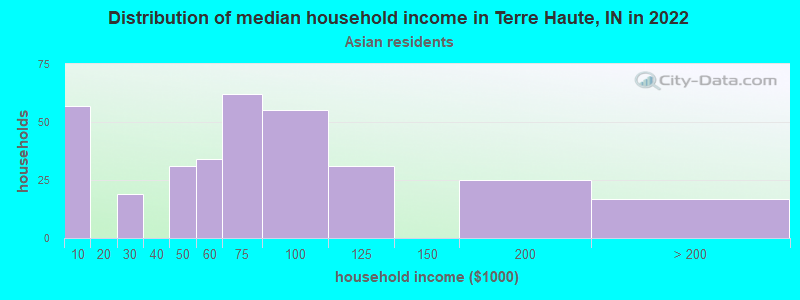
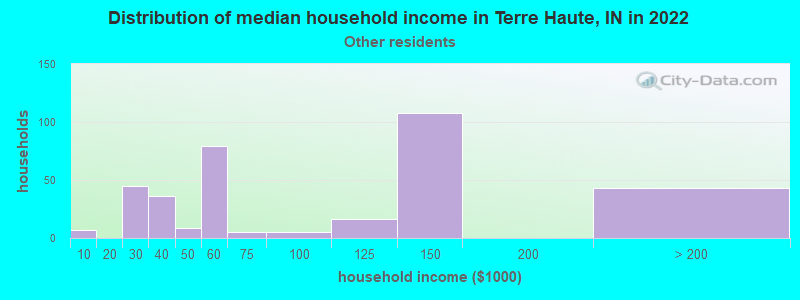
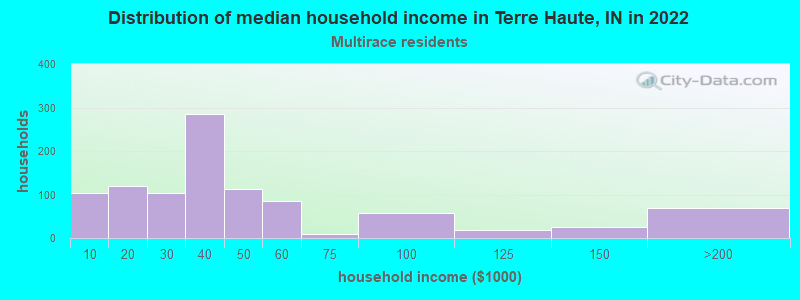
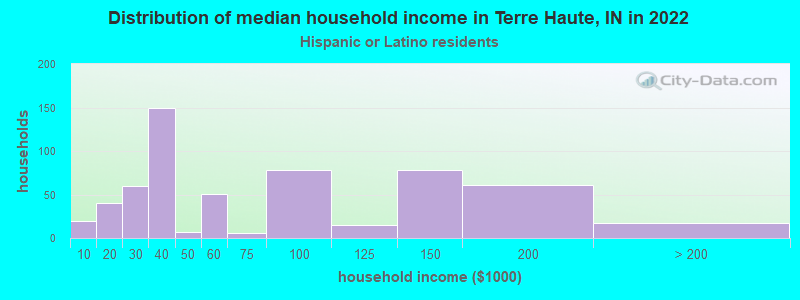
Income and house value in Terre Haute Median household income in 2022 $40,731 White non-Hispanic householders$31,737 Black householders$65,399 Asian householders$27,794 Two or more races householders$56,233 Hispanic or Latino race householdersMedian 2022 house value $113,565 White Non-Hispanic householders$79,607 Black or African American householders$284,099 American Indian or Alaska Native householders $403,789 Asian householders$120,617 Some other race householders$105,215 Two or more races householders$150,121 Hispanic or Latino householders
Median age by race in Terre Haute
33.7 Median age for White residents32.9 35.3 29.8 Median age for Black or African American residents33.5 28.1 20.9 Median age for American Indian / Alaska Native residents22.3 -491,600,353.2 23.1 Median age for Asian residents25.4 18.9 -666,666,666.0 Median age for Native Hawaiian / Pacific Islander residents-666,666,666.0 -666,666,666.0 28.5 Median age for Other race residents28.1 24.8 23.1 Median age for Two or more races residents24.4 17.2 33.7 Median age for White alone residents32.9 35.0 22.6 Median age for Hispanic or Latino residents19.7 43.9
Owner/renter occupied households by race in Terre Haute
House owners and renters - White residents 10,382 52.1% Owner occupied9,548 47.9% Renter occupiedHouse owners and renters - Black or African American residents 765 35.6% Owner occupied1,386 64.4% Renter occupiedHouse owners and renters - American Indian / Alaska Native residents 15 100.0% Owner occupiedHouse owners and renters - Asian residents 100 25.2% Owner occupied297 74.8% Renter occupiedHouse owners and renters - Other race residents 136 42.3% Owner occupied186 57.7% Renter occupiedHouse owners and renters - Two or more races residents 228 25.2% Owner occupied674 74.8% Renter occupiedHouse owners and renters - White alone residents 10,239 51.8% Owner occupied9,521 48.2% Renter occupiedHouse owners and renters - Hispanic or Latino residents 257 43.4% Owner occupied336 56.6% Renter occupied
Language usage in Terre Haute
English speakers - Total 93.0% of residents of Terre Haute speak English at home.
3.1% of residents speak Spanish at home 1,170 66.8% Speak English very well582 33.2% Speak English less than very well3.6% of residents speak other language at home 1,497 75.3% Speak English very well491 24.7% Speak English less than very well
English speakers - Born in the United States 93.3% of residents of Terre Haute speak English at home.
4.2% of residents speak Spanish at home 475 74.0% Speak English very well167 26.0% Speak English less than very well2.6% of residents speak other language at home 389 99.2% Speak English very well3 0.8% Speak English less than very well
English speakers - Native, born elsewhere 61.0% of residents of Terre Haute speak English at home.
27.7% of residents speak Spanish at home 24 25.0% Speak English very well72 75.0% Speak English less than very well13.0% of residents speak other language at home 45 100.0% Speak English very well
English speakers - Foreign-born 26.4% of residents of Terre Haute speak English at home.
16.6% of residents speak Spanish at home 170 41.4% Speak English very well241 58.6% Speak English less than very well56.8% of residents speak other language at home 921 65.5% Speak English very well485 34.5% Speak English less than very well
White (Caucasian) - Speak only English Native:
98.2% (42,398)Foreign-born:
58.9% (304)
White (Caucasian) - Speak another language Native:
1.9% (819)Foreign-born:
46.0% (237)
Black or African American - Speak another language Native:
1.7% (98)Foreign-born:
100.0% (164)
Asian - Speak only English Native:
60.5% (285)Foreign-born:
16.2% (154)
Asian - Speak another language Native:
38.0% (179)Foreign-born:
83.8% (794)
Other race - Speak only English Native:
37.8% (260)Foreign-born:
23.9% (107)
Other race - Speak another language Native:
59.9% (412)Foreign-born:
78.5% (352)
Two or more races - Speak only English Native:
84.3% (2,338)Foreign-born:
42.4% (82)
Two or more races - Speak another language Native:
15.2% (421)Foreign-born:
59.9% (116)
White alone - Speak only English Native:
98.3% (42,180)Foreign-born:
51.1% (323)
White alone - Speak another language Native:
1.7% (726)Foreign-born:
47.5% (300)
Hispanic or Latino - Speak only English Native:
47.5% (786)Foreign-born:
21.3% (117)
Hispanic or Latino - Speak another language Native:
53.0% (877)Foreign-born:
79.1% (433)
Foreign-born residents in Terre Haute 2,482 residents are foreign born (1.9% Asia , 0.8% Latin America , 0.6% Europe ).
This city:
4.2%Indiana:
5.6%
Marital status for residents in Terre Haute Marital status - White (Caucasian) population 15 years and over
Males 46.1% Never married34.9% Now married0.8% Separated3.0% Widowed15.1% DivorcedFemales 39.1% Never married35.4% Now married0.7% Separated8.4% Widowed16.4% DivorcedWomen who gave birth in the past 12 months Now married:
42.2% (232)Unmarried:
57.8% (318)
Women who did not give birth in the past 12 months Now married:
28.8% (3,269)Unmarried:
71.2% (8,063)
Marital status - Black or African American population 15 years and over
Males 60.1% Never married24.5% Now married0.5% Separated1.1% Widowed13.9% DivorcedFemales 61.5% Never married19.7% Now married0.0% Separated5.6% Widowed13.2% DivorcedWomen who gave birth in the past 12 months Now married:
0.0% (0)Unmarried:
100.0% (40)
Women who did not give birth in the past 12 months Now married:
15.3% (261)Unmarried:
84.7% (1,446)
Marital status - Asian population 15 years and over
Males 65.1% Never married29.0% Now married0.0% Separated3.2% Widowed2.7% DivorcedFemales 48.9% Never married48.5% Now married0.0% Separated2.6% Widowed0.0% DivorcedWomen who gave birth in the past 12 months Now married:
100.0% (7)Unmarried:
0.0% (0)
Women who did not give birth in the past 12 months Now married:
46.7% (191)Unmarried:
53.3% (218)
Marital status - Other race population 15 years and over
Males 51.0% Never married44.3% Now married1.4% Separated0.0% Widowed3.3% DivorcedFemales 76.3% Never married23.3% Now married0.0% Separated0.4% Widowed0.0% DivorcedWomen who gave birth in the past 12 months Now married:
0.0% (0)Unmarried:
100.0% (4)
Women who did not give birth in the past 12 months Now married:
19.0% (61)Unmarried:
81.0% (259)
Marital status - Two or more races population 15 years and over
Males 55.2% Never married35.6% Now married0.0% Separated2.0% Widowed7.2% DivorcedFemales 57.2% Never married24.4% Now married0.0% Separated3.3% Widowed15.1% DivorcedWomen who gave birth in the past 12 months Now married:
0.0% (0)Unmarried:
100.0% (11)
Women who did not give birth in the past 12 months Now married:
21.9% (181)Unmarried:
78.1% (643)
Marital status - White alone, not Hispanic / Latino population 15 years and over
Males 45.7% Never married35.2% Now married0.8% Separated3.0% Widowed15.2% DivorcedFemales 39.2% Never married35.2% Now married0.7% Separated8.4% Widowed16.5% DivorcedWomen who gave birth in the past 12 months Now married:
42.2% (230)Unmarried:
57.8% (315)
Women who did not give birth in the past 12 months Now married:
28.5% (3,166)Unmarried:
71.5% (7,938)
Marital status - Hispanic or Latino population 15 years and over
Males 60.2% Never married28.4% Now married0.6% Separated2.9% Widowed8.0% DivorcedFemales 48.4% Never married37.3% Now married0.0% Separated1.7% Widowed12.6% DivorcedWomen who gave birth in the past 12 months Now married:
0.0% (0)Unmarried:
100.0% (12)
Women who did not give birth in the past 12 months Now married:
33.1% (173)Unmarried:
66.9% (349)
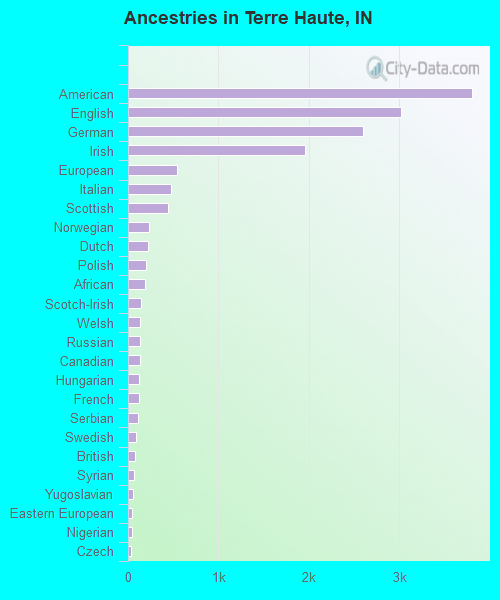
Ancestries in Terre Haute
3,803 16.1% American3,015 12.7% English2,602 11.0% German1,953 8.3% Irish544 2.3% European478 2.0% Italian442 1.9% Scottish237 1.0% Norwegian224 0.9% Dutch200 0.8% Polish185 0.8% African144 0.6% Scotch-Irish136 0.6% Welsh135 0.6% Russian133 0.6% Canadian118 0.5% Hungarian117 0.5% French108 0.5% Serbian93 0.4% Swedish82 0.3% British61 0.3% Syrian50 0.2% Yugoslavian45 0.2% Eastern European39 0.2% Nigerian36 0.2% Czech36 0.2% Scandinavian32 0.1% Israeli28 0.1% Greek27 0.1% Lithuanian26 0.1% Kenyan22 0.09% Ghanaian22 0.09% Danish21 0.09% Ukrainian19 0.08% Romanian19 0.08% Czechoslovakian18 0.08% French Canadian16 0.07% Northern European14 0.06% Portuguese14 0.06% Iranian14 0.06% Australian12 0.05% Pennsylvania German9 0.04% Austrian5 0.02% Swiss5 0.02% Moroccan
Geographical mobility in Terre Haute Same house 1 year ago 37,071 79.7% White (Caucasian)4,165 65.2% Black or African American104 61.4% American Indian / Alaska Native1,143 81.0% Asian840 69.1% Other race2,893 83.0% Two or more races36,355 79.7% White alone, not Hispanic / Latino1,647 70.3% Hispanic or LatinoMoved within same county 4,543 9.8% White / Caucasian976 15.3% Black or African American101 7.1% Asian58 4.8% Other race314 9.0% Two or more races4,472 9.8% White alone, not Hispanic / Latino151 6.4% Hispanic or LatinoMoved within same state 2,343 5.0% White / Caucasian1,182 18.5% Black or African American47 27.9% American Indian / Alaska Native57 4.0% Asian49 4.0% Other race87 2.5% Two or more races2,322 5.1% White alone, not Hispanic / Latino209 8.9% Hispanic or LatinoMoved from different state 1,698 3.7% White / Caucasian162 2.5% Black or African American1 0.6% American Indian / Alaska Native52 3.7% Asian140 4.0% Two or more races1,741 3.8% White alone, not Hispanic / Latino74 3.2% Hispanic or LatinoMoved from abroad 390 0.8% White10 0.2% Black or African American47 3.3% Asian286 23.5% Other race62 1.8% Two or more races390 0.9% White alone, not Hispanic / Latino308 13.2% Hispanic or Latino
Children Nativity (place of birth) in Terre Haute
Children under 6 years - Living with two parents Both parents native 1,839 100.0% NativeBoth parents foreign-born 33 74.4% Native12 25.6% Foreign-bornOne native, one foreign-born parent 47 100.0% NativeChildren under 6 years - Living with one parent Native parent 1,696 100.0% NativeForeign-born parent 57 100.0% NativeChildren 6 to 17 years - Living with two parents Both parents native 3,204 100.0% NativeBoth parents foreign-born 417 85.0% Native74 15.0% Foreign-bornOne native, one foreign-born parent 69 100.0% NativeChildren 6 to 17 years - Living with one parent Native parent 3,016 100.0% NativeForeign-born parent 116 52.0% Native107 48.0% Foreign-born
Grandparents responsible for own grandchildren in Terre Haute
Grandparents (30 to 59 years) White / Caucasian 100 29.8% Responsible for grandchildren236 70.2% Not responsible for grandchildrenBlack or African American 68 60.8% Responsible for grandchildren44 39.2% Not responsible for grandchildrenWhite alone, not Hispanic / Latino 103 29.3% Responsible for grandchildren249 70.7% Not responsible for grandchildrenGrandparents (60 years and over) White / Caucasian 219 57.8% Responsible for grandchildren160 42.2% Not responsible for grandchildrenBlack or African American 63 78.5% Responsible for grandchildren17 21.5% Not responsible for grandchildrenWhite alone, not Hispanic / Latino 222 57.7% Responsible for grandchildren163 42.3% Not responsible for grandchildren