Table Rock, MO (Missouri) Houses and Residents
| Table Rock: | $187,769 |
| Missouri: | $221,200 |
Total population: 263 (Urban population: 180 (all inside urban clusters), Rural population: 48 (all nonfarm))
Houses: 114 (97 occupied: 70 owner occupied, 27 renter occupied)
| % of renters here: | 28% |
| State: | 32% |
Housing density: 545 houses/condos per square mile
Median price asked for vacant for-sale houses and condos in 2022 in this county: $151,610.
Median contract rent in 2022: $1,032 (lower quartile is $898, upper quartile is $1,337)
Median rent asked for vacant for-rent units in 2022: $524
Median gross rent in Table Rock, MO in 2022: $1,126
Housing units in Table Rock with a mortgage: 26 (1 second mortgage, 4 home equity loan, 0 both second mortgage and home equity loan)
Houses without a mortgage: 4


 | Red Rock Bluff (outside Gage's marina) condos/patio homes? (2 replies) |
| houses on bull shoals lake (2 replies) |
| Branson is slowly dying!!! (242 replies) |
| Lake Taneycomo or Table Rock? (3 replies) |
| Rental homes in Springfield area (3 replies) |
| Need rent house in/near Branson (4 replies) |

Household type by relationship:
Households: 49,931- In family households: 41,302 (10,103 male householders, 3,794 female householders)
10,724 spouses, 12,820 children (11,603 natural, 383 adopted, 834 stepchildren), 1,057 grandchildren, 381 brothers or sisters, 374 parents, foster children, 438 other relatives, 1,290 non-relatives
- In nonfamily households: 8,629 (3,156 male householders (2,374 living alone)), 3,702 female householders (3,071 living alone)), 1,771 nonrelatives
- In group quarters: 1,744 (388 institutionalized population)
6,075 married couples with children.
1,969 single-parent households (477 men, 1,492 women).
94.4% of residents of Table Rock speak English at home.
2.3% of residents speak Spanish at home (20% speak English very well, 40% speak English well, 40% speak English not well).
3.2% of residents speak other Indo-European language at home (29% speak English very well, 29% speak English well, 43% speak English not well).
| Here: | 5.7 |
| State: | 6.4 |
| Here: | 5.6 |
| State: | 4.4 |

- Bedrooms in owner-occupied houses and condos in Table Rock, Missouri
- 0no bedroom
- 71 bedroom
- 132 bedrooms
- 463 bedrooms
- 44 bedrooms
- 05+ bedrooms

- Bedrooms in renter-occupied apartments in Table Rock, Missouri
- 0no bedroom
- 71 bedroom
- 52 bedrooms
- 153 bedrooms
- 04 bedrooms
- 05+ bedrooms

- Cars and other vehicles available in Table Rock in owner-occupied houses/condos
- 3no vehicle
- 191 vehicle
- 432 vehicles
- 33 vehicles
- 24 vehicles
- 05+ vehicles

- Cars and other vehicles available in Table Rock in renter-occupied apartments
- 2no vehicle
- 21 vehicle
- 102 vehicles
- 133 vehicles
- 04 vehicles
- 05+ vehicles

- Rooms in owner-occupied houses in Table Rock, Missouri
- 01 room
- 22 rooms
- 23 rooms
- 124 rooms
- 265 rooms
- 196 rooms
- 17 rooms
- 48 rooms
- 49+ rooms

- Rooms in renter-occupied apartments in Table Rock, Missouri
- 01 room
- 72 rooms
- 03 rooms
- 54 rooms
- 35 rooms
- 86 rooms
- 27 rooms
- 08 rooms
- 29+ rooms


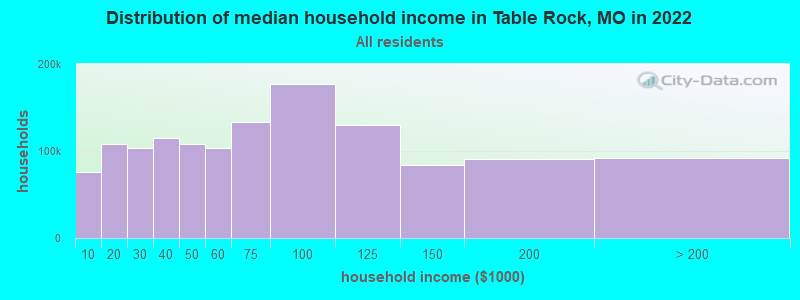
Table Rock, MO household income distribution

- 89,441Less than $10,000
- 123,791$10,000 to $19,999
- 119,245$20,000 to $29,999
- 134,492$30,000 to $39,999
- 126,077$40,000 to $49,999
- 120,106$50,000 to $59,999
- 154,372$60,000 to $74,999
- 200,571$75,000 to $99,999
- 150,242$100,000 to $124,999
- 97,731$125,000 to $149,999
- 110,064$150,000 to $199,999
- 114,202$200,000 or more
Percentage of workers working in this county: 84.8%
Number of people working at home: 19 (12.6% of all workers)
Travel time to work (commute)
- Less than 5 minutes: 15
- 5 to 9 minutes: 11
- 10 to 14 minutes: 22
- 15 to 19 minutes: 45
- 20 to 24 minutes: 24
- 25 to 29 minutes: 0
- 30 to 34 minutes: 3
- 35 to 39 minutes: 1
- 40 to 44 minutes: 0
- 45 to 59 minutes: 4
- 60 to 89 minutes: 3
- 90 or more minutes: 7
Means of transportation to work:
- Drove a car alone: 97 (71.9%)
- Carpooled: 29 (21.5%)
- Taxi: 4 (3.0%)
- Walked: 5 (3.7%)


First ancestries reported:
- German: 65 (27.5%)
- Irish: 35 (14.8%)
- English: 34 (14.4%)
- Other: 27 (11.4%)
- United States: 17 (7.2%)
- French: 10 (4.2%)
- French Canadian: 8 (3.4%)
- Norwegian: 8 (3.4%)
- Polish: 7 (3.0%)
- Scotch-Irish: 6 (2.5%)
- Swedish: 6 (2.5%)
- Dutch: 3 (1.3%)
- Hungarian: 3 (1.3%)
- Italian: 3 (1.3%)
- Welsh: 2 (0.8%)
- Russian: 1 (0.4%)
- Scottish: 1 (0.4%)
Place of birth for U.S.-born residents:
- This state: 75
- Other state: 151
- Northeast: 6
- Midwest: 85
- South: 36
- West: 24
32% of Table Rock residents lived in the same house 5 years ago.
Out of people who lived in different houses, 46% lived in this county.
Out of people who lived in different counties, 25% lived in Missouri.
Education attainment for males 25 years and older:
- No schooling: 0
- Nursery to 4th grade: 2
- 5th and 6th grade: 0
- 7th and 8th grade: 5
- 9th grade: 0
- 10th grade: 2
- 11th grade: 2
- 12th grade, no diploma: 2
- High school graduate (or equivalency): 26
- Less than 1 year of college: 5
- Some college more than 1 year, no degree: 29
- Associate degree: 2
- Bachelor's degree: 9
- Master's degree: 2
- Professional school degree: 0
- Doctorate degree: 0

Education attainment for females 25 years and older:
- No schooling: 0
- Nursery to 4th grade: 1
- 5th and 6th grade: 0
- 7th and 8th grade: 0
- 9th grade: 0
- 10th grade: 6
- 11th grade: 1
- 12th grade, no diploma: 5
- High school graduate (or equivalency): 21
- Less than 1 year of college: 12
- Some college more than 1 year, no degree: 17
- Associate degree: 8
- Bachelor's degree: 9
- Master's degree: 5
- Professional school degree: 0
- Doctorate degree: 0


Housing units in structures:
- One, detached: 64
- 20 to 49: 7
- 50 or more: 2
- Mobile homes: 39
- Boats, RVs, vans, etc.: 2
Median worth of mobile homes: $68,680

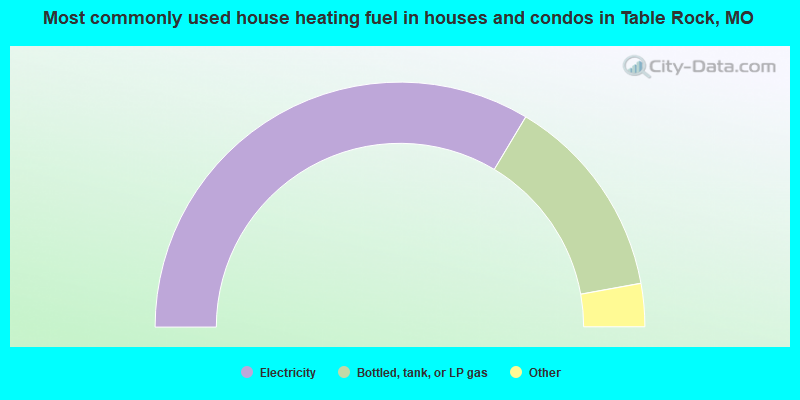
- 67.1%Electricity
- 27.1%Bottled, tank, or LP gas
- 2.9%Utility gas
- 2.9%Wood
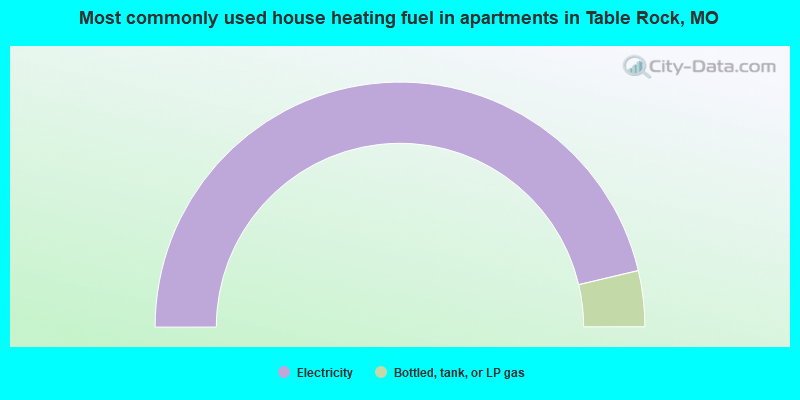
- 92.6%Electricity
- 7.4%Bottled, tank, or LP gas
Private vs. public school enrollment:
| Here: | 12.5% |
| Missouri: | 13.7% |
| Here: | 15.4% |
| Missouri: | 11.6% |
| Here: | 0.0% |
| Missouri: | 24.9% |


