Table Rock, Missouri
Submit your own pictures of this village and show them to the world
- OSM Map
- General Map
- Google Map
- MSN Map
| Males: 124 | |
| Females: 139 |
| Median resident age: | 40.8 years |
| Missouri median age: | 36.1 years |
Zip codes: 65616.
| Table Rock: | $69,326 |
| MO: | $64,811 |
Estimated per capita income in 2022: $34,020 (it was $20,846 in 2000)
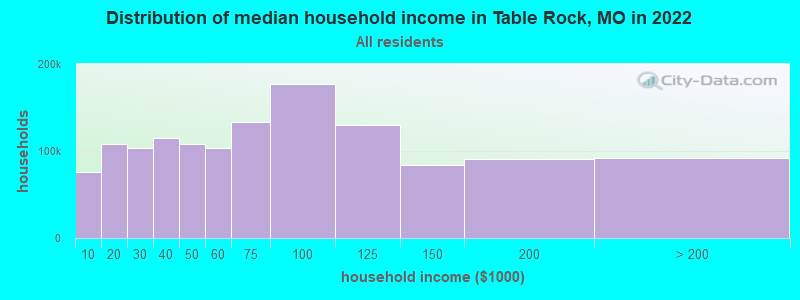
Table Rock village income, earnings, and wages data
Estimated median house or condo value in 2022: $187,769 (it was $78,300 in 2000)
| Table Rock: | $187,769 |
| MO: | $221,200 |
Detailed information about poverty and poor residents in Table Rock, MO
Compare current foreclosures near Table Rock, MO:
| Photo | Address | Area | Beds / Baths | Price | Details |
|---|---|---|---|---|---|

|
#1
State Highway Vv
Powersite, MO 65731
|
1,144 sq. feet
|
2 baths 3 beds |
$115,000
|
show details |

|
#2
Mark Twain Dr
Reeds Spring, MO 65737
|
5,540 sq. feet
|
5 baths 5 beds |
$625,000
|
show details |

|
#3
Main St
Reeds Spring, MO 65737
|
1,890 sq. feet
|
2 baths 3 beds |
$79,900
|
show details |

|
#4
Bluejay Rd
Blue Eye, MO 65611
|
- sq. feet
|
2 baths 4 beds |
$109,200
|
show details |

|
#5
Deckard Ln
Kimberling City, MO 65686
|
- sq. feet
|
2 baths 5 beds |
$64,500
|
show details |

|
#6
Fritts Way
Reeds Spring, MO 65737
|
1,252 sq. feet
|
- baths - beds |
show details | |

|
#7
Highway 103 N
Green Forest, AR 72638
|
1,368 sq. feet
|
2 baths - beds |
show details | |

|
#8
Baker St
Forsyth, MO 65653
|
1,919 sq. feet
|
- baths 2 beds |
show details | |

|
#9
Pine St
Omaha, AR 72662
|
1,728 sq. feet
|
2 baths - beds |
show details | |

|
#10
College Rd
Omaha, AR 72662
|
3,840 sq. feet
|
4 baths - beds |
show details |
| Photo | Address | Area | Beds / Baths | Price | Details |
|---|---|---|---|---|---|

|
#11
Everest Cir Apt 6
Branson, MO 65616
|
- sq. feet
|
- baths - beds |
show details | |

|
#12
Golfshores Dr # 4
Branson, MO 65616
|
- sq. feet
|
- baths - beds |
show details | |

|
#13
State Highway 176
Rockaway Beach, MO 65740
|
- sq. feet
|
- baths - beds |
show details | |

|
#14
Fritts Way
Reeds Spring, MO 65737
|
- sq. feet
|
- baths - beds |
show details | |

|
#15
Clay St
Branson, MO 65616
|
- sq. feet
|
- baths - beds |
show details | |

|
#16
Candle Dr
Branson, MO 65616
|
- sq. feet
|
- baths - beds |
show details | |

|
#17
Buzz St Unit 22
Branson, MO 65616
|
- sq. feet
|
- baths - beds |
show details | |

|
#18
Highway 21 N
Oak Grove, AR 72660
|
- sq. feet
|
- baths - beds |
show details | |

|
#19
Driftwood Road
Rockaway Beach, MO 65740
|
- sq. feet
|
- baths - beds |
show details | |

|
#20
Sweet Gum
Kirbyville, MO 65679
|
- sq. feet
|
- baths - beds |
show details |
| Photo | Address | Area | Beds / Baths | Price | Details |
|---|---|---|---|---|---|

|
#21
Laughing Ln
Rockaway Beach, MO 65740
|
- sq. feet
|
- baths - beds |
show details | |

|
#22
Sandhills Ct
Branson, MO 65616
|
- sq. feet
|
- baths - beds |
show details | |

|
#23
Goldfish Dr
Forsyth, MO 65653
|
- sq. feet
|
- baths - beds |
show details | |

|
#24
Richard Rd
Rockaway Beach, MO 65740
|
- sq. feet
|
- baths - beds |
show details | |

|
#25
County Road 614
Green Forest, AR 72638
|
- sq. feet
|
- baths - beds |
show details | |

|
#26
Grant St
Forsyth, MO 65653
|
- sq. feet
|
- baths - beds |
show details | |

|
#27
Davidson Run
Kissee Mills, MO 65680
|
- sq. feet
|
- baths - beds |
show details | |

|
#28
Battersea Park Ln
Cape Fair, MO 65624
|
- sq. feet
|
- baths - beds |
show details | |

|
#29
Charles St
Taneyville, MO 65759
|
- sq. feet
|
- baths - beds |
show details | |

|
#30
S Main St
Galena, MO 65656
|
- sq. feet
|
- baths - beds |
show details |
| Photo | Address | Area | Beds / Baths | Price | Details |
|---|---|---|---|---|---|

|
#31
Bumblebee St # 22
Branson, MO 65616
|
- sq. feet
|
- baths - beds |
show details | |

|
#32
Cactus Ln
Reeds Spring, MO 65737
|
- sq. feet
|
- baths - beds |
show details | |

|
#33
Westlake Ct
Branson, MO 65616
|
- sq. feet
|
- baths - beds |
show details | |

|
#34
Ns-18-7.0-36-003-007-040.000
Hollister, MO 65672
|
- sq. feet
|
- baths - beds |
show details | |

|
#35
Falls Pkwy # 302
Branson, MO 65616
|
- sq. feet
|
- baths - beds |
show details | |

|
#36
River Point Rd Unit 5
Hollister, MO 65672
|
- sq. feet
|
- baths - beds |
show details | |

|
#37
Aberdeen Ln, Apt 4
Branson, MO 65616
|
- sq. feet
|
- baths - beds |
show details | |

|
#38
Colleen St Apt 2107
Branson, MO 65616
|
- sq. feet
|
- baths - beds |
show details | |

|
#39
Keeter St # 4125
Branson, MO 65616
|
- sq. feet
|
- baths - beds |
show details | |

|
#40
S Wildwood Dr Apt 12-3
Branson, MO 65616
|
- sq. feet
|
- baths - beds |
show details |
| Photo | Address | Area | Beds / Baths | Price | Details |
|---|---|---|---|---|---|

|
#41
Francis St # 383
Branson, MO 65616
|
- sq. feet
|
- baths - beds |
show details | |

|
#42
Eagle Crst
Hollister, MO 65672
|
- sq. feet
|
- baths - beds |
show details | |

|
#43
Shepherd Of The Hills Expy # 107
Branson, MO 65616
|
- sq. feet
|
- baths - beds |
show details | |

|
#44
Boo Boo Blvd # 347
Hollister, MO 65672
|
- sq. feet
|
- baths - beds |
show details | |

|
#45
Crescent Dr
Hollister, MO 65672
|
- sq. feet
|
- baths - beds |
show details | |

|
#46
Timberland Ln # 309
Hollister, MO 65672
|
- sq. feet
|
- baths - beds |
show details | |

|
#47
Berry Dr Apt A10
Branson, MO 65616
|
- sq. feet
|
- baths - beds |
show details | |

|
#48
Rock Ridge Rd
Reeds Spring, MO 65737
|
- sq. feet
|
- baths - beds |
show details | |

|
#49
Bird Rd Apt 308
Branson, MO 65616
|
- sq. feet
|
- baths - beds |
show details | |

|
Check over 1 million property listings on Foreclosure.com!
|
browse all offers | |||

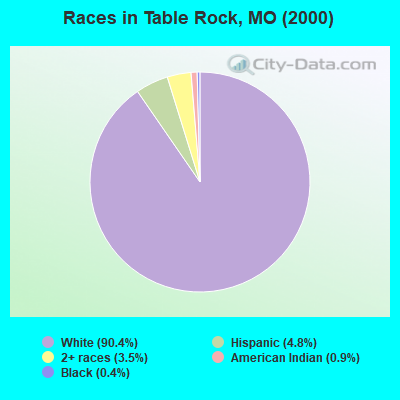
- 20790.4%White alone
- 114.8%Hispanic
- 83.5%Two or more races
- 20.9%American Indian alone
- 10.4%Black alone
Races in Table Rock detailed stats: ancestries, foreign born residents, place of birth
 Recent articles from our blog. Our writers, many of them Ph.D. graduates or candidates, create easy-to-read articles on a wide variety of topics.

 | Lake Taneycomo or Table Rock? (3 replies) |
| Branson and Table Rock Lake (2 replies) |
| fishing on Table Rock Lake (1 reply) |
| table rock vs loto (5 replies) |
| Branson a nice place to retire? (16 replies) |
| From Florida to Missouri (8 replies) |
Latest news from Table Rock, MO collected exclusively by city-data.com from local newspapers, TV, and radio stations
Ancestries: German (28.4%), Irish (15.3%), English (14.8%), United States (7.4%), French (4.4%), French Canadian (3.5%).
Current Local Time: CST time zone
Incorporated in 1968
Elevation: 900 feet
Land area: 0.21 square miles.
Population density: 1,257 people per square mile (low).
| Table Rock village: | 0.9% ($667) |
| Missouri: | 1.0% ($851) |
Nearest city with pop. 50,000+: Springfield, MO  (40.8 miles , pop. 151,580).
Nearest city with pop. 200,000+: Tulsa, OK (150.6 miles , pop. 393,049).
Nearest city with pop. 1,000,000+: Dallas, TX (329.6 miles , pop. 1,188,580).
Nearest cities:
), ), ), Latitude: 36.61 N, Longitude: 93.30 W
Area code commonly used in this area: 417
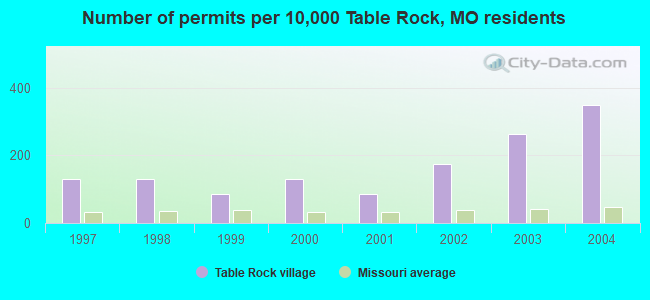
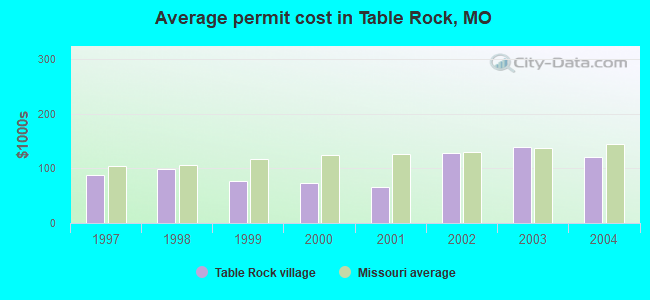
Single-family new house construction building permits:
- 2004: 8 buildings, average cost: $121,100
- 2003: 6 buildings, average cost: $140,000
- 2002: 4 buildings, average cost: $127,500
- 2001: 2 buildings, average cost: $65,000
- 2000: 3 buildings, average cost: $73,300
- 1999: 2 buildings, average cost: $76,500
- 1998: 3 buildings, average cost: $98,700
- 1997: 3 buildings, average cost: $88,300
| Here: | 3.5% |
| Missouri: | 2.8% |
- Arts, entertainment, recreation (23.0%)
- Accommodation & food services (17.0%)
- Administrative & support & waste management services (9.6%)
- Health care (5.2%)
- Construction (4.4%)
- Real estate & rental & leasing (3.7%)
- Repair & maintenance (3.7%)
- Arts, entertainment, recreation (30.4%)
- Accommodation & food services (14.5%)
- Administrative & support & waste management services (11.6%)
- Construction (8.7%)
- Real estate & rental & leasing (7.2%)
- Public administration (5.8%)
- Repair & maintenance (4.3%)
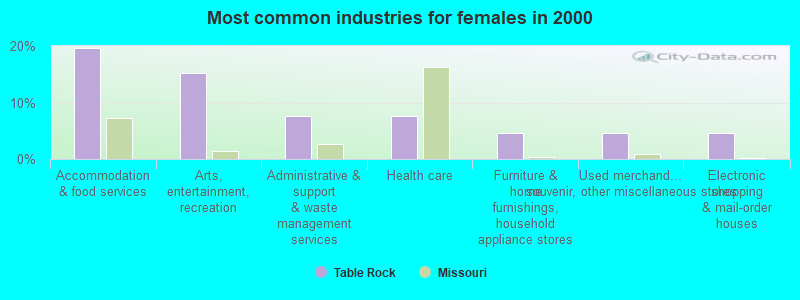
- Accommodation & food services (19.7%)
- Arts, entertainment, recreation (15.2%)
- Administrative & support & waste management services (7.6%)
- Health care (7.6%)
- Furniture & home furnishings, household appliance stores (4.5%)
- Used merchandise, gift, novelty, souvenir, other miscellaneous stores (4.5%)
- Electronic shopping & mail-order houses (4.5%)
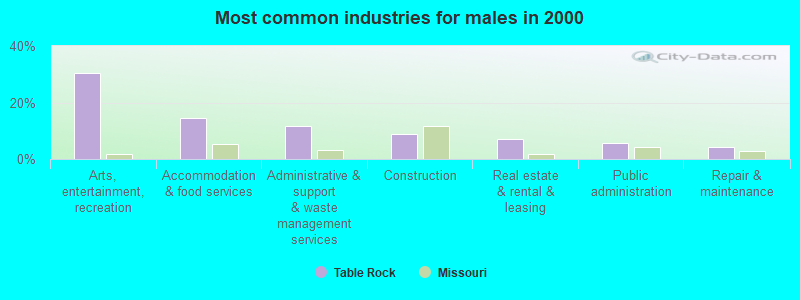
- Entertainers and performers, sports, and related workers (18.5%)
- Other sales and related occupations, including supervisors (9.6%)
- Other management occupations, except farmers and farm managers (6.7%)
- Building and grounds cleaning and maintenance occupations (6.7%)
- Material recording, scheduling, dispatching, and distributing workers (6.7%)
- Advertising, marketing, promotions, public relations, and sales managers (5.9%)
- Information and record clerks, except customer service representatives (5.2%)
- Entertainers and performers, sports, and related workers (27.5%)
- Other sales and related occupations, including supervisors (10.1%)
- Advertising, marketing, promotions, public relations, and sales managers (8.7%)
- Building and grounds cleaning and maintenance occupations (7.2%)
- Material recording, scheduling, dispatching, and distributing workers (7.2%)
- Other management occupations, except farmers and farm managers (5.8%)
- Information and record clerks, except customer service representatives (5.8%)
- Entertainers and performers, sports, and related workers (9.1%)
- Other sales and related occupations, including supervisors (9.1%)
- Other management occupations, except farmers and farm managers (7.6%)
- Building and grounds cleaning and maintenance occupations (6.1%)
- Other food preparation and serving workers, including supervisors (6.1%)
- Material recording, scheduling, dispatching, and distributing workers (6.1%)
- Information and record clerks, except customer service representatives (4.5%)
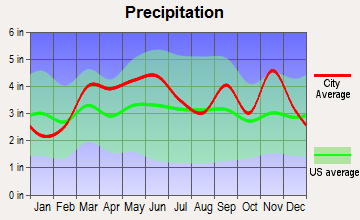
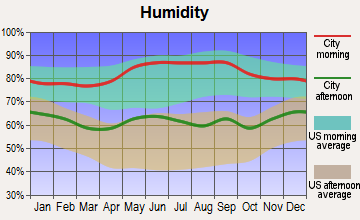
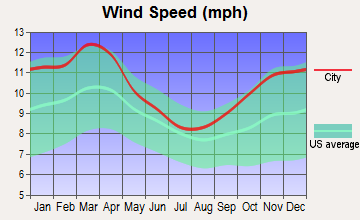
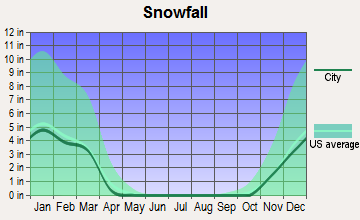
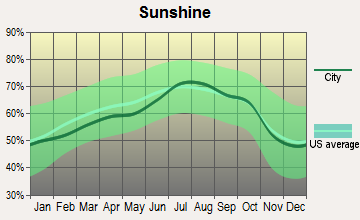
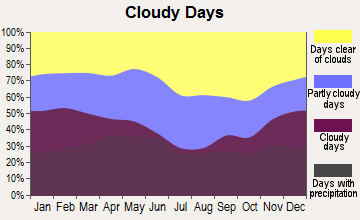
Average climate in Table Rock, Missouri
Based on data reported by over 4,000 weather stations
Tornado activity:
Table Rock-area historical tornado activity is slightly below Missouri state average. It is 44% greater than the overall U.S. average.
On 11/29/1991, a category F4 (max. wind speeds 207-260 mph) tornado 34.2 miles away from the Table Rock village center killed 2 people and injured 64 people and caused between $5,000,000 and $50,000,000 in damages.
On 3/24/1954, a category F3 (max. wind speeds 158-206 mph) tornado 22.1 miles away from the village center injured 2 people and caused between $5000 and $50,000 in damages.
Earthquake activity:
Table Rock-area historical earthquake activity is significantly above Missouri state average. It is 577% greater than the overall U.S. average.On 9/3/2016 at 12:02:44, a magnitude 5.8 (5.8 MW, Depth: 3.5 mi, Class: Moderate, Intensity: VI - VII) earthquake occurred 202.2 miles away from Table Rock center
On 11/6/2011 at 03:53:10, a magnitude 5.7 (5.7 MW, Depth: 3.2 mi) earthquake occurred 207.5 miles away from Table Rock center
On 2/28/2011 at 05:00:50, a magnitude 4.7 (4.7 MW, Depth: 2.0 mi, Class: Light, Intensity: IV - V) earthquake occurred 106.5 miles away from the city center
On 5/4/2001 at 06:42:12, a magnitude 4.7 (4.2 MB, 4.7 LG, 4.5 LG) earthquake occurred 114.9 miles away from Table Rock center
On 1/21/1982 at 00:33:54, a magnitude 4.7 (4.5 MB, 4.7 LG, 4.5 LG) earthquake occurred 116.6 miles away from Table Rock center
On 3/25/1976 at 00:41:20, a magnitude 5.0 (4.9 MB, 5.0 LG) earthquake occurred 179.0 miles away from the city center
Magnitude types: regional Lg-wave magnitude (LG), body-wave magnitude (MB), moment magnitude (MW)
Natural disasters:
The number of natural disasters in Taney County (21) is greater than the US average (15).Major Disasters (Presidential) Declared: 12
Emergencies Declared: 6
Causes of natural disasters: Storms: 14, Floods: 13, Tornadoes: 10, Winds: 5, Winter Storms: 4, Drought: 1, Hurricane: 1, Other: 1 (Note: some incidents may be assigned to more than one category).

Hospitals and medical centers near Table Rock:
- HEALING HANDS HEALTH CARE, LLC (Home Health Center, about 3 miles away; BRANSON, MO)
- BRANSON DIALYSIS, LLC (Dialysis Facility, about 6 miles away; BRANSON, MO)
- GOLDEN LIVINGCENTER-BRANSON (Nursing Home, about 6 miles away; BRANSON, MO)
- COMMUNITY HOSPICES OF AMERICA (Hospital, about 8 miles away; BRANSON, MO)
- TABLEROCK HEALTHCARE (Nursing Home, about 9 miles away; KIMBERLING CITY, MO)
- FORSYTH CARE CENTER (Nursing Home, about 12 miles away; FORSYTH, MO)
Colleges/universities with over 2000 students nearest to Table Rock:
- Missouri State University-Springfield (about 42 miles; Springfield, MO; Full-time enrollment: 16,660)
- Ozarks Technical Community College (about 43 miles; Springfield, MO; FT enrollment: 10,356)
- Drury University (about 43 miles; Springfield, MO; FT enrollment: 3,902)
- Evangel University (about 43 miles; Springfield, MO; FT enrollment: 2,036)
- NorthWest Arkansas Community College (about 52 miles; Bentonville, AR; FT enrollment: 5,634)
- Crowder College (about 61 miles; Neosho, MO; FT enrollment: 3,675)
- University of Arkansas (about 62 miles; Fayetteville, AR; FT enrollment: 22,163)
Points of interest:
| This village: | 2.4 people |
| Missouri: | 2.5 people |
| This village: | 71.9% |
| Whole state: | 67.7% |
| This village: | 6.2% |
| Whole state: | 5.1% |
Likely homosexual households (counted as self-reported same-sex unmarried-partner households)
- Lesbian couples: 1.0% of all households
- Gay men: 0.0% of all households
| This village: | 5.7% |
| Whole state: | 11.7% |
| This village: | 2.6% |
| Whole state: | 5.1% |
For population 15 years and over in Table Rock:
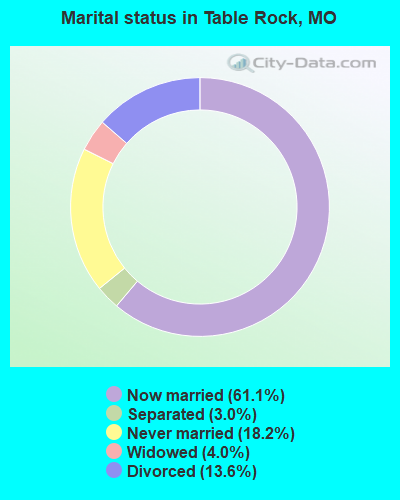
- Never married: 18.2%
- Now married: 61.1%
- Separated: 3.0%
- Widowed: 4.0%
- Divorced: 13.6%
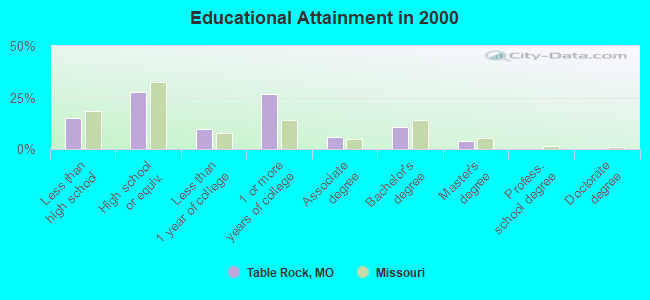
For population 25 years and over in Table Rock:
- High school or higher: 84.8%
- Bachelor's degree or higher: 14.6%
- Graduate or professional degree: 4.1%
- Unemployed: 14.6%
- Mean travel time to work (commute): 22.2 minutes
| Here: | 9.2 |
| Missouri average: | 11.7 |

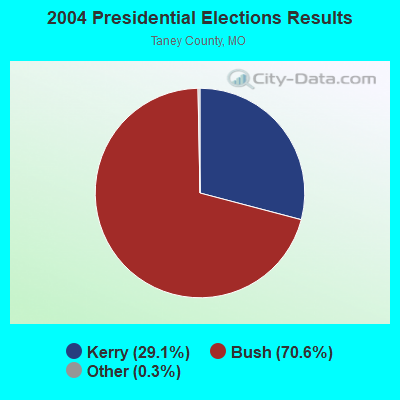

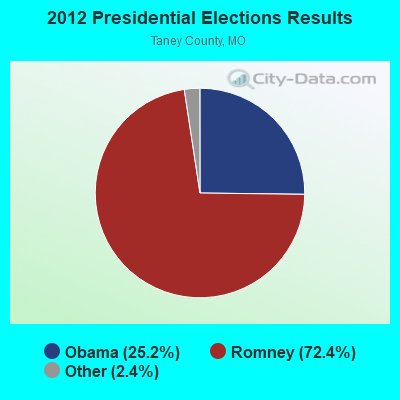
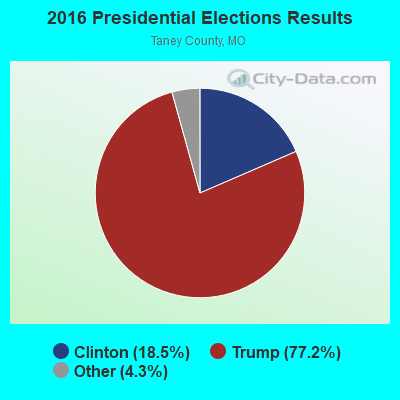
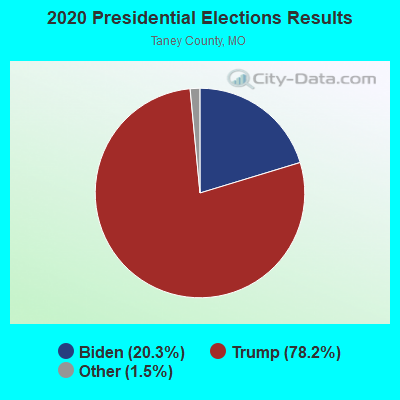
Graphs represent county-level data. Detailed 2008 Election Results
Religion statistics for Table Rock, MO (based on Taney County data)
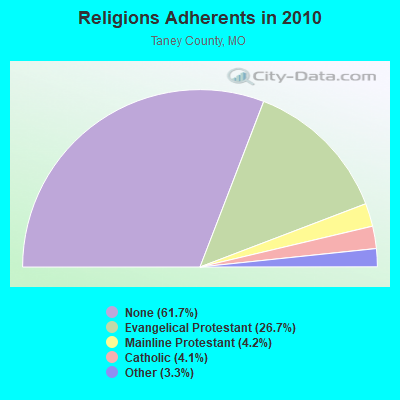
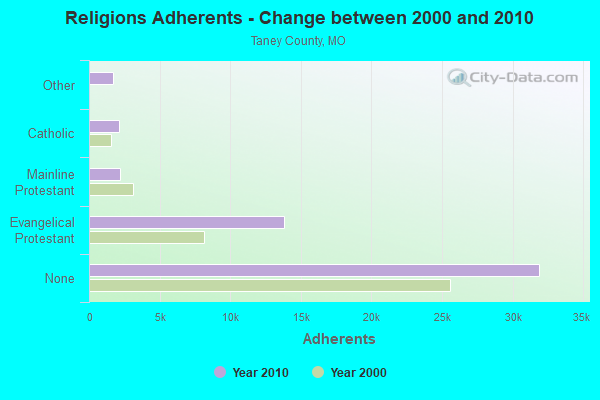
| Religion | Adherents | Congregations |
|---|---|---|
| Evangelical Protestant | 13,797 | 59 |
| Mainline Protestant | 2,161 | 10 |
| Catholic | 2,135 | 2 |
| Other | 1,689 | 10 |
| None | 31,893 | - |
Food Environment Statistics:
| Here: | 2.19 / 10,000 pop. |
| State: | 1.88 / 10,000 pop. |
| Taney County: | 0.66 / 10,000 pop. |
| Missouri: | 0.60 / 10,000 pop. |
| This county: | 8.10 / 10,000 pop. |
| Missouri: | 4.34 / 10,000 pop. |
| Taney County: | 16.42 / 10,000 pop. |
| Missouri: | 7.37 / 10,000 pop. |
| Taney County: | 9.2% |
| Missouri: | 8.8% |
| This county: | 29.7% |
| Missouri: | 29.6% |
| Taney County: | 12.2% |
| State: | 13.5% |
| Local government employment and payroll (March 2002) | |||||
| Function | Full-time employees | Monthly full-time payroll | Average yearly full-time wage | Part-time employees | Monthly part-time payroll |
|---|---|---|---|---|---|
| Financial Administration | 0 | $0 | 1 | $800 | |
| Totals for Government | 0 | $0 | 1 | $800 | |
Table Rock government finances - Expenditure in 2002 (per resident):
- Construction - Sewerage: $468,000 ($1779.47)
Regular Highways: $22,000 ($83.65)
- Current Operations - General - Other: $3,000 ($11.41)
Solid Waste Management: $2,000 ($7.60)
Regular Highways: $2,000 ($7.60)
Central Staff Services: $2,000 ($7.60)
Sewerage: $1,000 ($3.80)
Financial Administration: $1,000 ($3.80)
- Total Salaries and Wages: $6,000 ($22.81)
Table Rock government finances - Revenue in 2002 (per resident):
- Charges - Other: $5,000 ($19.01)
- Local Intergovernmental - Other: $189,000 ($718.63)
- Miscellaneous - General Revenue - Other: $88,000 ($334.60)
Interest Earnings: $7,000 ($26.62)
- Revenue - Water Utilities: $0 ($0.00)
- State Intergovernmental - Other: $38,000 ($144.49)
Highways: $4,000 ($15.21)
- Tax - Total General Sales: $12,000 ($45.63)
Property: $9,000 ($34.22)
Other: $1,000 ($3.80)
Table Rock government finances - Cash and Securities in 2002 (per resident):
- Other Funds - Cash and Deposits: $106,000 ($403.04)
Strongest AM radio stations in Table Rock:
- KOMC (1220 AM; 1 kW; BRANSON, MO; Owner: TURTLE BROADCASTING CO. OF BRANSON, L.P.)
- KWTO (560 AM; 5 kW; SPRINGFIELD, MO; Owner: KWTO, INC.)
- KTHS (1480 AM; 5 kW; BERRYVILLE, AR; Owner: KTHS/KSCC, INC.)
- KNWA (1600 AM; 5 kW; BELLEFONTE, AR; Owner: HARRISON RADIO STATIONS, INC.)
- KGHT (880 AM; 50 kW; SHERIDAN, AR; Owner: METROPOLITAN RADIO GROUP, INC.)
- KFAY (1030 AM; 10 kW; FARMINGTON, AR; Owner: CUMULUS LICENSING CORP)
- KURM (790 AM; 5 kW; ROGERS, AR; Owner: KERM, INC)
- KRMG (740 AM; 50 kW; TULSA, OK; Owner: CXR HOLDINGS, INC.)
- KFAQ (1170 AM; 50 kW; TULSA, OK; Owner: JOURNAL BROADCAST CORPORATION)
- KBTN (1420 AM; 10 kW; NEOSHO, MO; Owner: PETRACOM OF JOPLIN, L.L.C.)
- KAAY (1090 AM; 50 kW; LITTLE ROCK, AR; Owner: CITADEL BROADCASTING COMPANY)
- KLFJ (1550 AM; 5 kW; SPRINGFIELD, MO; Owner: 127, INC.)
- KSGF (1260 AM; 5 kW; SPRINGFIELD, MO; Owner: JOURNAL BROADCAST CORPORATION)
Strongest FM radio stations in Table Rock:
- KLFC (88.1 FM; BRANSON, MO; Owner: MOUNTAINTOP BROADCASTING, INC.)
- KSMS-FM (90.5 FM; POINT LOOKOUT, MO; Owner: SOUTHWEST MISSOURI STATE UINIVERSITY)
- K204CN (88.7 FM; BRANSON, MO; Owner: CALVARY CHAPEL OF TWIN FALLS, INC.)
- KOZO (89.7 FM; BRANSON, MO; Owner: CREATIVE EDUCATIONAL MEDIA CORP, INC)
- KCOZ (91.7 FM; POINT LOOKOUT, MO; Owner: COLLEGE OF THE OZARKS)
- KHOZ-FM (102.9 FM; HARRISON, AR; Owner: HARRISON BROADCASTING CORPORATION)
- KOMC-FM (100.1 FM; KIMBERLING CITY, MO; Owner: TURTLE BROADCASTING COMPANY, L.P.)
- KRZK (106.3 FM; BRANSON, MO; Owner: TURTLE BROADCASTING CO. OF BRANSON)
- KTHS-FM (107.1 FM; BERRYVILLE, AR; Owner: KTHS/KSCC, INC.)
- KCWD (96.1 FM; HARRISON, AR; Owner: HARRISON RADIO STATIONS, INC.)
- KTXR (101.3 FM; SPRINGFIELD, MO; Owner: STEREO BROADCASTING, INC.)
- KQMO (97.7 FM; SHELL KNOB, MO; Owner: MAGIC CIRCLE RADIO, INC.)
- KTTS-FM (94.7 FM; SPRINGFIELD, MO; Owner: JOURNAL BROADCAST CORPORATION)
- KWFC (89.1 FM; SPRINGFIELD, MO; Owner: BAPTIST BIBLE COLLEGE, INC.)
- KXUS (97.3 FM; SPRINGFIELD, MO; Owner: CLEAR CHANNEL BROADCASTING LICENSES, INC.)
- KOMG (92.9 FM; OZARK, MO; Owner: MW SPRINGMO, INC.)
- KTCN (100.9 FM; EUREKA SPRINGS, AR; Owner: NEW LIFE EVANGELISTIC CENTER, INC.)
- KAMO-FM (94.3 FM; ROGERS, AR; Owner: CUMULUS LICENSING CORP.)
- KWTO-FM (98.7 FM; SPRINGFIELD, MO; Owner: KWTO, INC.)
- KBPB (91.9 FM; HARRISON, MO; Owner: NEW LIFE EVANGELISTIC CENTER, INC.)
TV broadcast stations around Table Rock:
- K17DL (Channel 17; BRANSON, MO; Owner: KY3, INC.)
- K05JQ (Channel 5; BRANSON, MO; Owner: MILLER FAMILY BROADCASTING, L.L.C.)
- K25BD (Channel 25; BRANSON, MO; Owner: CHRISTIANS INCORPORATED FOR CHRIST)
- KWBM (Channel 31; HARRISON, AR; Owner: R.S. COMMUNICATIONS LTD. PARTNERSHIP)
- KYTV (Channel 3; SPRINGFIELD, MO; Owner: KY3, INC.)
- KBNS-CA (Channel 38; BRANSON, MO; Owner: THE VACATION CHANNEL, INC.)
- KOZK (Channel 21; SPRINGFIELD, MO; Owner: BD. OF GOVERNORS OF SW MISSOURI STATE UNIVERSITY)
- KSPR (Channel 33; SPRINGFIELD, MO; Owner: PIEDMONT TELEVISION OF SPRINGFIELD LICENSE LLC)
- KOLR (Channel 10; SPRINGFIELD, MO; Owner: VHR SPRINGFIELD LICENSE, INC.)
- KDEB-TV (Channel 27; SPRINGFIELD, MO; Owner: QUORUM OF MISSOURI LICENSE, LLC)
- KNJD-LP (Channel 59; BRANSON, MO; Owner: NEW LIFE EVANGELISTIC CENTER, INC.)
- K41FQ (Channel 41; SPRINGFIELD, MO; Owner: TRINITY BROADCASTING NETWORK)
- K54FH (Channel 54; GREEN FOREST, AR; Owner: NEW LIFE EVANGELISTIC CENTER, INC)
- K08GN (Channel 8; KIMBERLING CITY, MO; Owner: QUORUM OF MISSOURI LICENSE, LLC)
- National Bridge Inventory (NBI) Statistics
- 13Number of bridges
- 312ft / 95.5mTotal length
- $12,173,000Total costs
- 173,947Total average daily traffic
- 24,789Total average daily truck traffic
- 258,531Total future (year 2041) average daily traffic
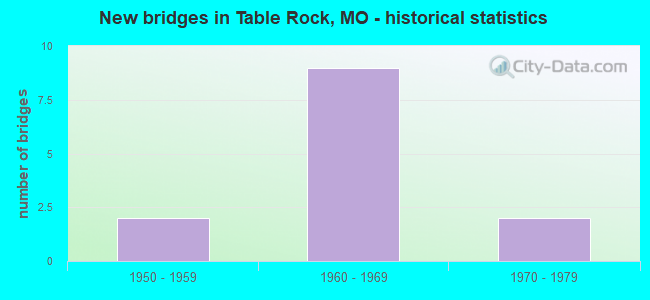
- New bridges - historical statistics
- 21950-1959
- 91960-1969
- 21970-1979
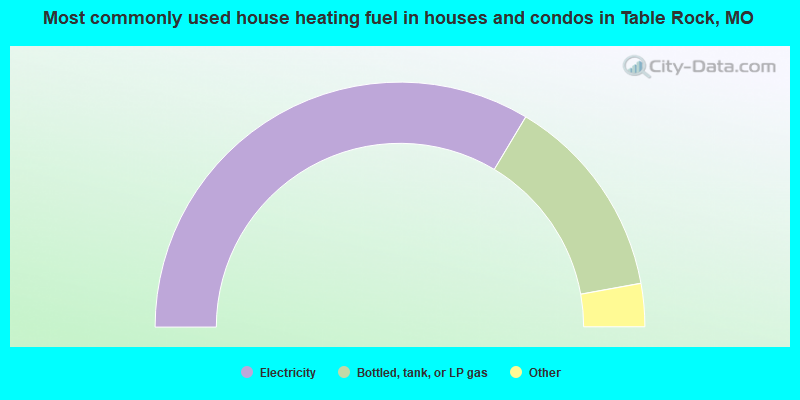
- 67.1%Electricity
- 27.1%Bottled, tank, or LP gas
- 2.9%Utility gas
- 2.9%Wood
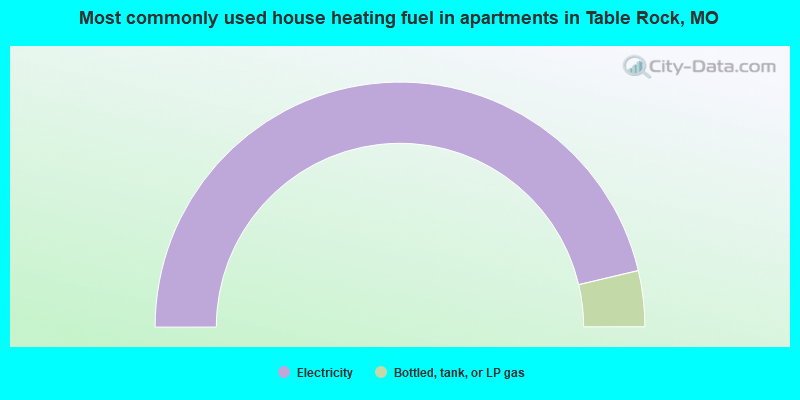
- 92.6%Electricity
- 7.4%Bottled, tank, or LP gas
Table Rock compared to Missouri state average:
- Black race population percentage significantly below state average.
- Median age above state average.
- Foreign-born population percentage significantly below state average.
- Renting percentage significantly below state average.
- Length of stay since moving in significantly above state average.
- Number of rooms per house significantly below state average.
- House age significantly below state average.
- Number of college students below state average.
- Percentage of population with a bachelor's degree or higher below state average.
Table Rock on our top lists:
- #61 on the list of "Top 100 cities with strongest arts, entertainment, recreation, accommodation and food services industries"
- #3 (65616) on the list of "Top 101 zip codes with the most hotels or motels in 2005"
- #56 (65616) on the list of "Top 101 zip codes with the most museums in 2005"