Table Land, CO (Colorado) Houses and Residents
| Table Land: | $199,549 |
| Colorado: | $531,100 |
Total population: 367 (Urban population: 0, Rural population: 419 (176 farm, 243 nonfarm))
Houses: 231 (182 occupied: 128 owner occupied, 54 renter occupied)
| % of renters here: | 30% |
| State: | 34% |
Housing density: 1 houses/condos per square mile
Median price asked for vacant for-sale houses and condos in 2022 in this state: $752,348.
Median contract rent in 2022: $641 (lower quartile is $698, upper quartile is $690)
Median rent asked for vacant for-rent units in 2022: $334
Median gross rent in Table Land, CO in 2022: $712
Housing units in Table Land with a mortgage: 17 (0 second mortgage, 0 home equity loan, 0 both second mortgage and home equity loan)
Houses without a mortgage: 17
Compare current foreclosures near Table Land, CO:
| Photo | Address | Area | Beds / Baths | Price | Details |
|---|---|---|---|---|---|

|
#1
Columbia Dr
Julesburg, CO 80737
|
1,872 sq. feet
|
1 baths 3 beds |
show details | |

|
Check over 1 million property listings on Foreclosure.com!
|
browse all offers | |||

Household type by relationship:
Households: 2,344- In family households: 1,876 (523 male householders, 148 female householders)
561 spouses, 526 children (473 natural, 19 adopted, 34 stepchildren), 47 grandchildren, 11 brothers or sisters, 10 parents, foster children, 9 other relatives, 27 non-relatives
- In nonfamily households: 468 (213 male householders (187 living alone)), 209 female householders (197 living alone)), 46 nonrelatives
- In group quarters: 35 (27 institutionalized population)
485 married couples with children.
104 single-parent households (24 men, 80 women).
96.0% of residents of Table Land speak English at home.
2.2% of residents speak Spanish at home (44% speak English very well, 33% speak English well, 22% don't speak English at all).
1.7% of residents speak other Indo-European language at home (71% speak English very well, 29% speak English not well).
Foreign born population: 1 (0.2%)
(200.0% of them are naturalized citizens)
| Here: | 7.7 |
| State: | 6.8 |
| Here: | 7.2 |
| State: | 4.0 |

- Bedrooms in owner-occupied houses and condos in Table Land, Colorado
- 2no bedroom
- 21 bedroom
- 282 bedrooms
- 523 bedrooms
- 324 bedrooms
- 125+ bedrooms

- Bedrooms in renter-occupied apartments in Table Land, Colorado
- 0no bedroom
- 11 bedroom
- 182 bedrooms
- 193 bedrooms
- 54 bedrooms
- 115+ bedrooms

- Cars and other vehicles available in Table Land in owner-occupied houses/condos
- 0no vehicle
- 81 vehicle
- 502 vehicles
- 473 vehicles
- 134 vehicles
- 105+ vehicles

- Cars and other vehicles available in Table Land in renter-occupied apartments
- 0no vehicle
- 171 vehicle
- 222 vehicles
- 153 vehicles
- 04 vehicles
- 05+ vehicles

- Rooms in owner-occupied houses in Table Land, Colorado
- 01 room
- 22 rooms
- 23 rooms
- 44 rooms
- 195 rooms
- 226 rooms
- 197 rooms
- 288 rooms
- 329+ rooms

- Rooms in renter-occupied apartments in Table Land, Colorado
- 01 room
- 02 rooms
- 13 rooms
- 44 rooms
- 135 rooms
- 136 rooms
- 07 rooms
- 148 rooms
- 99+ rooms


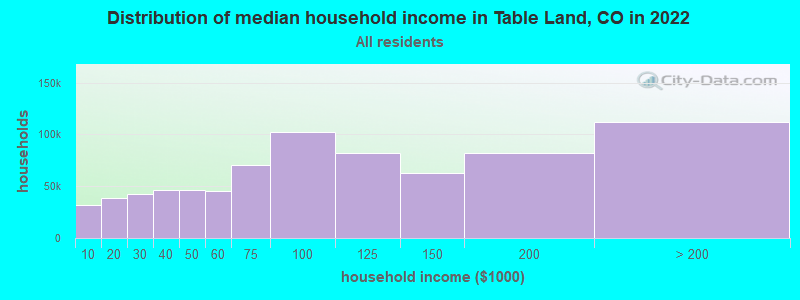
Table Land, CO household income distribution

- 7,480Less than $10,000
- 11,954$10,000 to $19,999
- 12,109$20,000 to $29,999
- 12,592$30,000 to $39,999
- 12,435$40,000 to $49,999
- 12,615$50,000 to $59,999
- 18,487$60,000 to $74,999
- 27,601$75,000 to $99,999
- 21,916$100,000 to $124,999
- 17,709$125,000 to $149,999
- 21,984$150,000 to $199,999
- 31,836$200,000 or more
Percentage of workers working in this county: 75.0%
Number of people working at home: 56 (19.2% of all workers)
Travel time to work (commute)
- Less than 5 minutes: 19
- 5 to 9 minutes: 26
- 10 to 14 minutes: 23
- 15 to 19 minutes: 32
- 20 to 24 minutes: 26
- 25 to 29 minutes: 9
- 30 to 34 minutes: 17
- 35 to 39 minutes: 0
- 40 to 44 minutes: 0
- 45 to 59 minutes: 11
- 60 to 89 minutes: 7
- 90 or more minutes: 1
Means of transportation to work:
- Drove a car alone: 146 (60.6%)
- Carpooled: 19 (7.9%)
- Walked: 4 (1.7%)
- Other means: 2 (0.8%)
- Worked at home: 70 (29.0%)


- Year of entry for the foreign-born population in Table Land, Colorado
- 01995 to March 2000
- 01990 to 1994
- 01985 to 1989
- 01980 to 1984
- 01975 to 1979
- 01970 to 1974
- 01965 to 1969
- 1Before 1965
Place of birth for U.S.-born residents:
- This state: 246
- Other state: 172
- Northeast: 1
- Midwest: 129
- South: 12
- West: 30
78% of Table Land residents lived in the same house 5 years ago.
Out of people who lived in different houses, 18% lived in this county.
Out of people who lived in different counties, 49% lived in Colorado.
Education attainment for males 25 years and older:
- No schooling: 0
- Nursery to 4th grade: 0
- 5th and 6th grade: 0
- 7th and 8th grade: 14
- 9th grade: 0
- 10th grade: 9
- 11th grade: 0
- 12th grade, no diploma: 6
- High school graduate (or equivalency): 46
- Less than 1 year of college: 14
- Some college more than 1 year, no degree: 25
- Associate degree: 12
- Bachelor's degree: 31
- Master's degree: 4
- Professional school degree: 0
- Doctorate degree: 4

Education attainment for females 25 years and older:
- No schooling: 0
- Nursery to 4th grade: 0
- 5th and 6th grade: 0
- 7th and 8th grade: 2
- 9th grade: 1
- 10th grade: 0
- 11th grade: 2
- 12th grade, no diploma: 2
- High school graduate (or equivalency): 56
- Less than 1 year of college: 25
- Some college more than 1 year, no degree: 28
- Associate degree: 9
- Bachelor's degree: 15
- Master's degree: 5
- Professional school degree: 0
- Doctorate degree: 0


Housing units in structures:
- One, detached: 202
- One, attached: 6
- Mobile homes: 23
Median worth of mobile homes: $122,294
Housing units lacking complete kitchen facilities: 3.5%

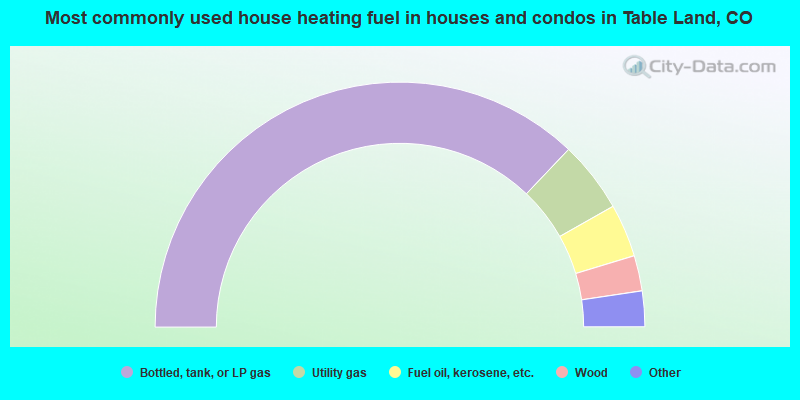
- 74.2%Bottled, tank, or LP gas
- 9.4%Utility gas
- 7.0%Fuel oil, kerosene, etc.
- 4.7%Wood
- 3.1%Electricity
- 1.6%Other fuel
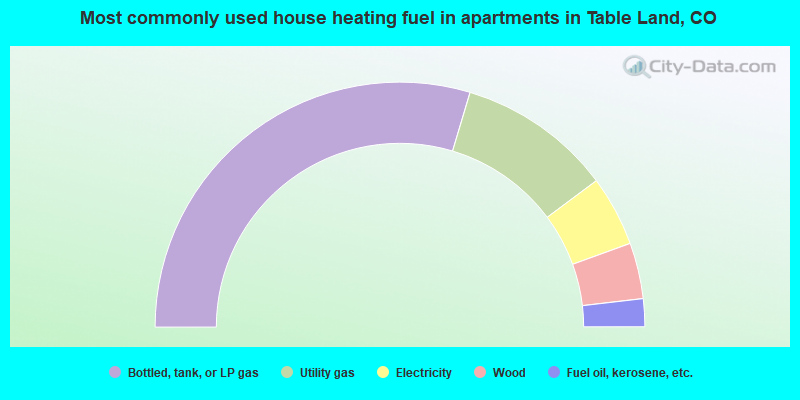
- 59.3%Bottled, tank, or LP gas
- 20.4%Utility gas
- 9.3%Electricity
- 7.4%Wood
- 3.7%Fuel oil, kerosene, etc.
Private vs. public school enrollment:
| Here: | 0.0% |
| Colorado: | 8.8% |
| Here: | 0.0% |
| Colorado: | 7.9% |
| Here: | 0.0% |
| Colorado: | 16.7% |


