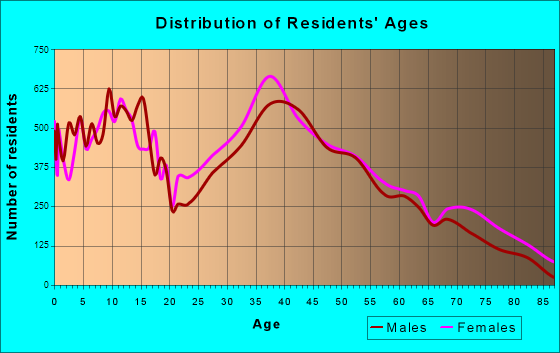
Suffolk, VA (Virginia) Houses and Residents
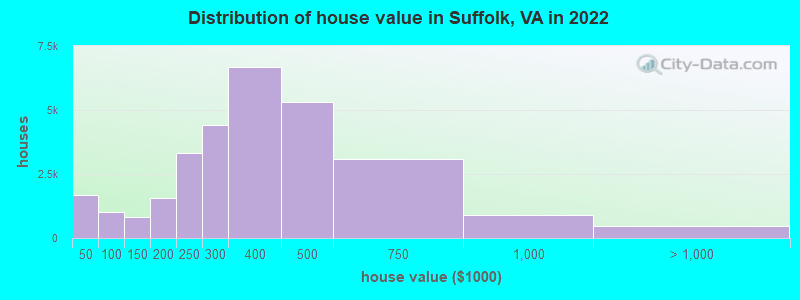
Estimated median house or condo value in 2022: $328,200 (it was $104,500 in 2000 )
Suffolk:
$328,200Virginia:
$365,700
Lower value quartile - upper value quartile: $235,200 - $446,900Mean price in 2022: Detached houses: $469,084 Here:
$469,084State:
$472,865
Townhouses or other attached units: $329,816 Here:
$329,816State:
$457,437
In 2-unit structures: $153,304 Here:
$153,304State:
$396,289
In 3-to-4-unit structures: $334,533 Here:
$334,533State:
$252,346
In 5-or-more-unit structures: $345,850 Here:
$345,850State:
$382,551
Mobile homes: $113,727 Here:
$113,727State:
$100,736
Total population: 86,806 (Urban population: 46,170 (15,130 inside urbanized areas, 31,040 inside urban clusters ), Rural population: 17,507 (445 farm, 17,062 nonfarm ))
Houses: 40,849 (38,713 occupied: 29,071 owner occupied, 9,642 renter occupied )
% of renters here:
25%State:
33%
Housing density: 102 houses/condos per square mile
Median price asked for vacant for-sale houses and condos in 2022: $213,496.
Median contract rent in 2022: $1,209 (lower quartile is $759, upper quartile is $1,728)
Median rent asked for vacant for-rent units in 2022: $896
Median gross rent in Suffolk, VA in 2022: $1,438
Housing units in Suffolk with a mortgage: 21,748 (1,511 second mortgage, 37 home equity loan, 1,161 both second mortgage and home equity loan )Houses without a mortgage: 348
Median household income for houses/condos with a mortgage: $107,029
Median household income for apartments without a mortgage: $76,226
Median monthly housing costs: $1,551
Data:
Median house or condo value ($)
Median house or condo value ($ change since 2000)
Median house or condo value ($) - White
Median house or condo value ($) - Black or African American
Median house or condo value ($) - Asian
Median house or condo value ($) - Hispanic or Latino
Median house or condo value ($) - American Indian and Alaska Native
Median house or condo value ($) - Multirace
Median house or condo value ($) - Other Race
Median price asked for mobile homes ($)
Household density (households per square mile)
Mean house or condo value by units in structure - 1, detached ($)
Mean house or condo value by units in structure - 1, attached ($)
Mean house or condo value by units in structure - 2 ($)
Mean house or condo value by units in structure by units in structure - 3 or 4 ($)
Mean house or condo value by units in structure - 5 or more ($)
Mean house or condo value by units in structure - Boat, RV, van, etc. ($)
Mean house or condo value by units in structure - Mobile home ($)
Median contract rent ($)
Median contract rent - Lower quartile ($)
Median contract rent - Upper quartile ($)
Median gross rent ($)
Urban houses (%)
Rural houses (%)
Houses occupied (%)
Houses occupied (% change since 2000)
Houses owner occupied (%)
Houses owner occupied (% change since 2000)
Houses renter occupied (%)
Houses renter occupied (% change since 2000)
Vacant housing units - For rent (%)
Vacant housing units - For rent (% change since 2000)
Vacant housing units - For sale only (%)
Vacant housing units - For sale only (% change since 2000)
Vacant housing units - Rented or sold, not occupied (%)
Vacant housing units - Rented or sold, not occupied (% change since 2000)
Vacant housing units - For seasonal, recreational, or occasional use (%)
Vacant housing units - For seasonal, recreational, or occasional use (% change since 2000)
Vacant housing units - For migrant workers (%)
Vacant housing units - For migrant workers (% change since 2000)
Vacant housing units - Other vacant (%)
Vacant housing units - Other vacant (% change since 2000)
Median monthly housing costs ($)
Median household income for houses/condos with a mortgage ($)
Median household income for houses/condos without a mortgage ($)
Median household income ($)
Median household income ($) - White
Median household income ($) - Black or African American
Median household income ($) - Asian
Median household income ($) - Hispanic or Latino
Median household income ($) - American Indian and Alaska Native
Median household income ($) - Multirace
Median household income ($) - Other Race
Mortgage status - with mortgage (%)
Mortgage status - with second mortgage (%)
Mortgage status - with home equity loan (%)
Mortgage status - with both second mortgage and home equity loan (%)
Mortgage status - without a mortgage (%)
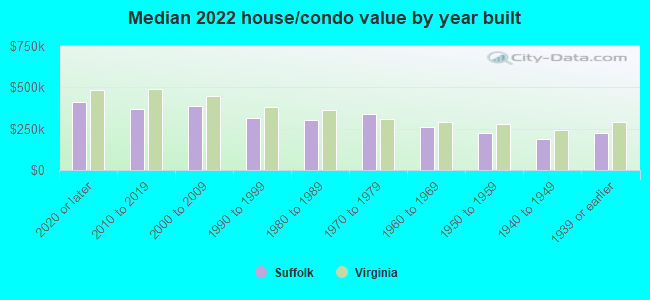
Median year house/condo built
Median year apartment built
Household type by relationship - Male householder living alone (%)
Household type by relationship - Male householder not living alone (%)
Household type by relationship - Female householder living alone (%)
Household type by relationship - Female householder not living alone (%)
Household type by relationship - Opposite-Sex spouse (%)
Household type by relationship - Same-Sex spouse (%)
Household type by relationship - Opposite-Sex unmarried partner (%)
Household type by relationship - Same-Sex unmarried partner (%)
Household type by relationship - In group quarters (%)
Size of family households - 2-person household (%)
Size of family households - 3-person household (%)
Size of family households - 4-person household (%)
Size of family households - 5-person household (%)
Size of family households - 6-person household (%)
Size of family households - 7-or-more-person household (%)
Size of nonfamily households - 1-person household (%)
Size of nonfamily households - 2-person household (%)
Size of nonfamily households - 3-person household (%)
Size of nonfamily households - 4-person household (%)
Size of nonfamily households - 5-person household (%)
Size of nonfamily households - 6-person household (%)
Size of nonfamily households - 7-or-moreperson household (%)
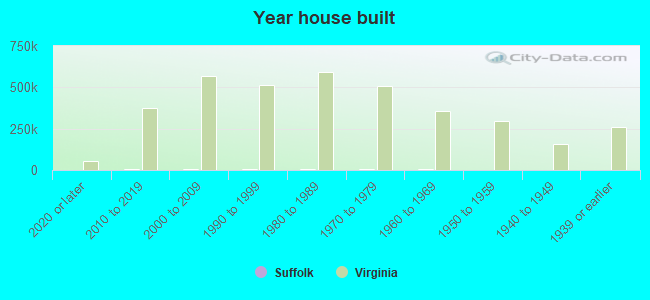
Year house built - Built 2010 or later (%)
Year house built - Built 2000 to 2009 (%)
Year house built - Built 1990 to 1999 (%)
Year house built - Built 1980 to 1989 (%)
Year house built - Built 1970 to 1979 (%)
Year house built - Built 1960 to 1969 (%)
Year house built - Built 1950 to 1959 (%)
Year house built - Built 1940 to 1949 (%)
Year house built - Built 1939 or earlier (%)
Median number of rooms in houses and condos
Median number of rooms in apartments
Median number of bedrooms in owner occupied houses
Mean number of bedrooms in owner occupied houses
Median number of bedrooms in renter occupied houses
Mean number of bedrooms in renter occupied houses
Median number of vehichles in owner occupied houses
Mean number of vehichles in owner occupied houses
Median number of vehichles in renter occupied houses
Mean number of vehichles in renter occupied houses
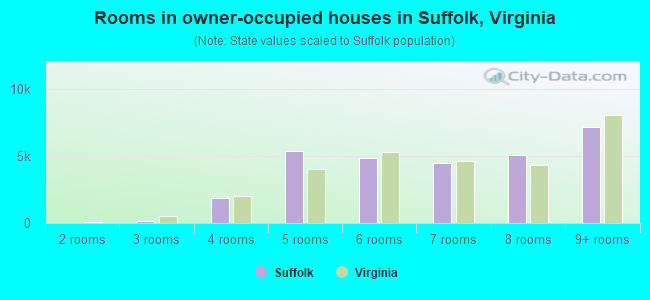
Rooms in owner-occupied houses - 1 room (%)
Rooms in owner-occupied houses - 2 rooms (%)
Rooms in owner-occupied houses - 3 rooms (%)
Rooms in owner-occupied houses - 4 rooms (%)
Rooms in owner-occupied houses - 5 rooms (%)
Rooms in owner-occupied houses - 6 rooms (%)
Rooms in owner-occupied houses - 7 rooms (%)
Rooms in owner-occupied houses - 8 rooms (%)
Rooms in owner-occupied houses - 9+ rooms (%)
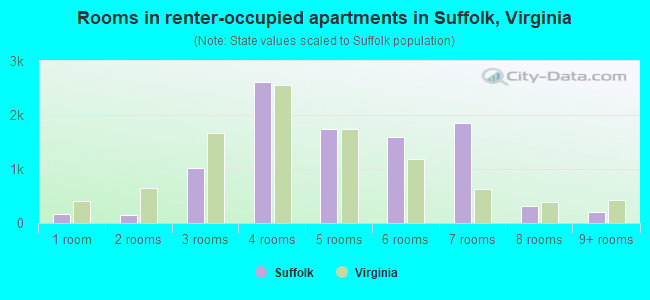
Rooms in renter-occupied houses - 1 room (%)
Rooms in renter-occupied houses - 2 rooms (%)
Rooms in renter-occupied houses - 3 rooms (%)
Rooms in renter-occupied houses - 4 rooms (%)
Rooms in renter-occupied houses - 5 rooms (%)
Rooms in renter-occupied houses - 6 rooms (%)
Rooms in renter-occupied houses - 7 rooms (%)
Rooms in renter-occupied houses - 8 rooms (%)
Rooms in renter-occupied houses - 9+ rooms (%)
Bedrooms in owner-occupied houses - no bedrooms (%)
Bedrooms in owner-occupied houses - 1 bedroom (%)
Bedrooms in owner-occupied houses - 2 bedrooms (%)
Bedrooms in owner-occupied houses - 3 bedrooms (%)
Bedrooms in owner-occupied houses - 4 bedrooms (%)
Bedrooms in owner-occupied houses - 5+ bedrooms (%)
Bedrooms in renter-occupied houses - no bedrooms (%)
Bedrooms in renter-occupied houses - 1 bedroom (%)
Bedrooms in renter-occupied houses - 2 bedrooms (%)
Bedrooms in renter-occupied houses - 3 bedrooms (%)
Bedrooms in renter-occupied houses - 4 bedrooms (%)
Bedrooms in renter-occupied houses - 5+ bedrooms (%)
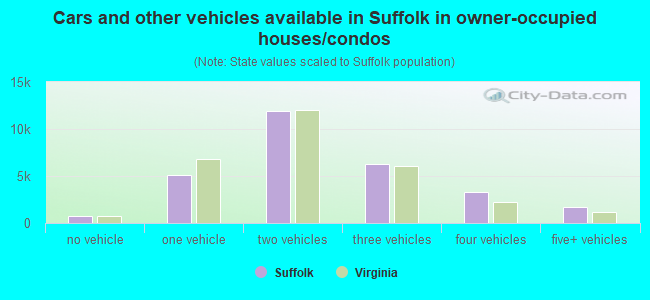
Vehicles available in owner-occupied houses - no vehicle available (%)
Vehicles available in owner-occupied houses - 1 vehicle available(%)
Vehicles available in owner-occupied houses - 2 Vehicles available (%)
Vehicles available in owner-occupied houses - 3 Vehicles available (%)
Vehicles available in owner-occupied houses - 4 Vehicles available (%)
Vehicles available in owner-occupied houses - 5+ Vehicles available (%)
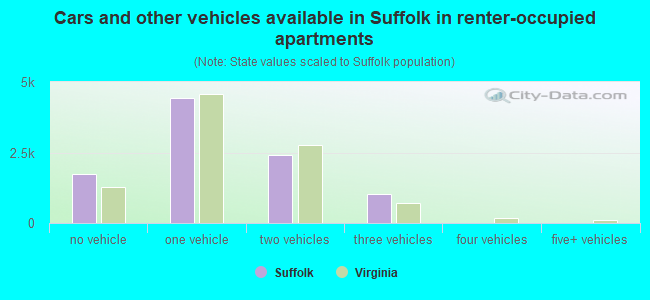
Vehicles available in renter-occupied houses - no vehicle available (%)
Vehicles available in renter-occupied houses - 1 vehicle available (%)
Vehicles available in renter-occupied houses - 2 Vehicles available (%)
Vehicles available in renter-occupied houses - 3 Vehicles available (%)
Vehicles available in renter-occupied houses - 4 Vehicles available (%)
Vehicles available in renter-occupied houses - 5+ Vehicles available (%)
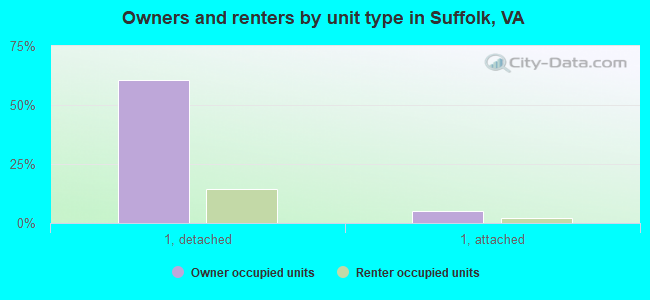
Housing units in structures - 1, detached (%)
Housing units in structures - 1, attached (%)
Housing units in structures - 2 (%)
Housing units in structures - 3 or 4 (%)
Housing units in structures - 5 to 9 (%)
Housing units in structures - 10 to 19 (%)
Housing units in structures - 20 to 49 (%)
Housing units in structures - 50 or more (%)
Housing units in structures - Mobile home (%)
Housing units in structures - Boat, RV, van, etc. (%)
Housing units in structures - Owners - 1, detached (%)
Housing units in structures - Owners - 1, attached (%)
Housing units in structures - Owners - 2 (%)
Housing units in structures - Owners - 3 or 4 (%)
Housing units in structures - Owners - 5 to 9 (%)
Housing units in structures - Owners - 10 to 19 (%)
Housing units in structures - Owners - 20 to 49 (%)
Housing units in structures - Owners - 50 or more (%)
Housing units in structures - Owners - Mobile home (%)
Housing units in structures - Owners - Boat, RV, van, etc. (%)
Housing units in structures - Renters - 1, detached (%)
Housing units in structures - Renters - 1, attached (%)
Housing units in structures - Renters - 2 (%)
Housing units in structures - Renters - 3 or 4 (%)
Housing units in structures - Renters - 5 to 9 (%)
Housing units in structures - Renters - 10 to 19 (%)
Housing units in structures - Renters - 20 to 49 (%)
Housing units in structures - Renters - 50 or more (%)
Housing units in structures - Renters - Mobile home (%)
Housing units in structures - Renters - Boat, RV, van, etc. (%)
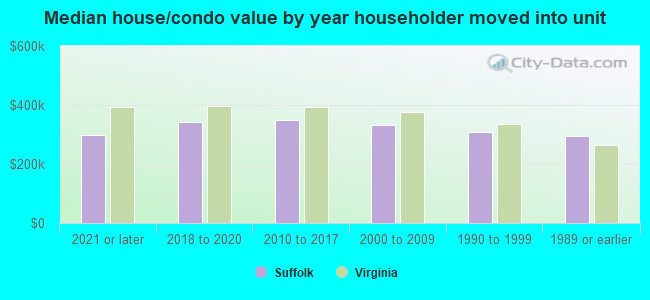
House/condo owner moved in on average (years ago)
Renter moved in on average (years ago)
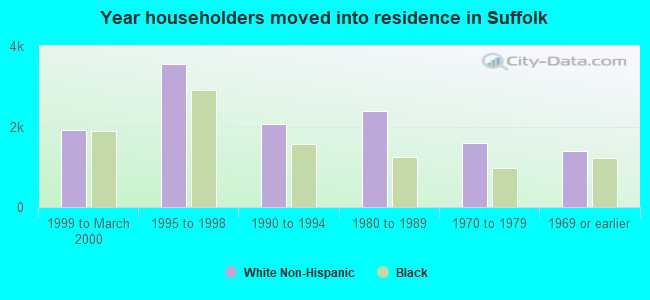
Year householder moved into unit - Moved in 1999 to March 2000 (%)
Year householder moved into unit - Moved in 1999 to March 2000 (%) - White
Year householder moved into unit - Moved in 1999 to March 2000 (%) - Black or African American
Year householder moved into unit - Moved in 1999 to March 2000 (%) - Asian
Year householder moved into unit - Moved in 1999 to March 2000 (%) - Hispanic or Latino
Year householder moved into unit - Moved in 1999 to March 2000 (%) - American Indian and Alaska Native
Year householder moved into unit - Moved in 1999 to March 2000 (%) - Multirace
Year householder moved into unit - Moved in 1999 to March 2000 (%) - Other Race
Year householder moved into unit - Moved in 1995 to 1998 (%)
Year householder moved into unit - Moved in 1995 to 1998 (%) - White
Year householder moved into unit - Moved in 1995 to 1998 (%) - Black or African American
Year householder moved into unit - Moved in 1995 to 1998 (%) - Asian
Year householder moved into unit - Moved in 1995 to 1998 (%) - Hispanic or Latino
Year householder moved into unit - Moved in 1995 to 1998 (%) - American Indian and Alaska Native
Year householder moved into unit - Moved in 1995 to 1998 (%) - Multirace
Year householder moved into unit - Moved in 1995 to 1998 (%) - Other Race
Year householder moved into unit - Moved in 1990 to 1994 (%)
Year householder moved into unit - Moved in 1990 to 1994 (%) - White
Year householder moved into unit - Moved in 1990 to 1994 (%) - Black or African American
Year householder moved into unit - Moved in 1990 to 1994 (%) - Asian
Year householder moved into unit - Moved in 1990 to 1994 (%) - Hispanic or Latino
Year householder moved into unit - Moved in 1990 to 1994 (%) - American Indian and Alaska Native
Year householder moved into unit - Moved in 1990 to 1994 (%) - Multirace
Year householder moved into unit - Moved in 1990 to 1994 (%) - Other Race
Year householder moved into unit - Moved in 1980 to 1989 (%)
Year householder moved into unit - Moved in 1980 to 1989 (%) - White
Year householder moved into unit - Moved in 1980 to 1989 (%) - Black or African American
Year householder moved into unit - Moved in 1980 to 1989 (%) - Asian
Year householder moved into unit - Moved in 1980 to 1989 (%) - Hispanic or Latino
Year householder moved into unit - Moved in 1980 to 1989 (%) - American Indian and Alaska Native
Year householder moved into unit - Moved in 1980 to 1989 (%) - Multirace
Year householder moved into unit - Moved in 1980 to 1989 (%) - Other Race
Year householder moved into unit - Moved in 1970 to 1979 (%)
Year householder moved into unit - Moved in 1970 to 1979 (%) - White
Year householder moved into unit - Moved in 1970 to 1979 (%) - Black or African American
Year householder moved into unit - Moved in 1970 to 1979 (%) - Asian
Year householder moved into unit - Moved in 1970 to 1979 (%) - Hispanic or Latino
Year householder moved into unit - Moved in 1970 to 1979 (%) - American Indian and Alaska Native
Year householder moved into unit - Moved in 1970 to 1979 (%) - Multirace
Year householder moved into unit - Moved in 1970 to 1979 (%) - Other Race
Year householder moved into unit - Moved in 1969 or earlier (%)
Year householder moved into unit - Moved in 1969 or earlier (%) - White
Year householder moved into unit - Moved in 1969 or earlier (%) - Black or African American
Year householder moved into unit - Moved in 1969 or earlier (%) - Asian
Year householder moved into unit - Moved in 1969 or earlier (%) - Hispanic or Latino
Year householder moved into unit - Moved in 1969 or earlier (%) - American Indian and Alaska Native
Year householder moved into unit - Moved in 1969 or earlier (%) - Multirace
Year householder moved into unit - Moved in 1969 or earlier (%) - Other Race
Housing units lacking complete plumbing facilities (%)
Housing units lacking complete kitchen facilities (%)
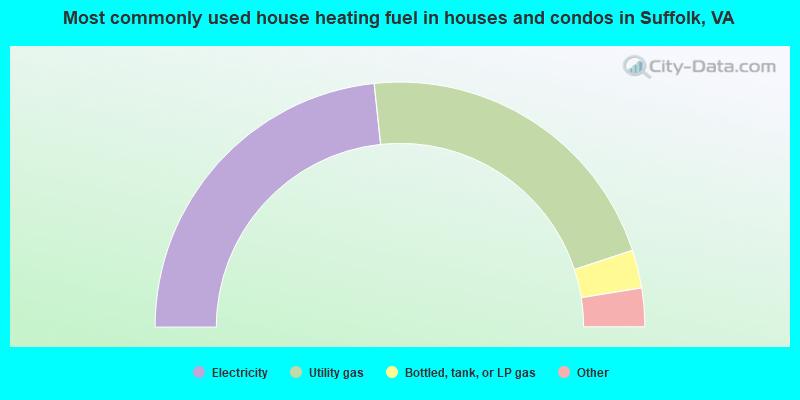
House heating fuel used in houses and condos - Utility gas (%)
House heating fuel used in houses and condos - Bottled, tank, or LP gas (%)
House heating fuel used in houses and condos - Electricity (%)
House heating fuel used in houses and condos - Fuel oil, kerosene, etc. (%)
House heating fuel used in houses and condos - Coal or coke (%)
House heating fuel used in houses and condos - Wood (%)
House heating fuel used in houses and condos - Solar energy (%)
House heating fuel used in houses and condos - Other fuel (%)
House heating fuel used in houses and condos - No fuel used (%)
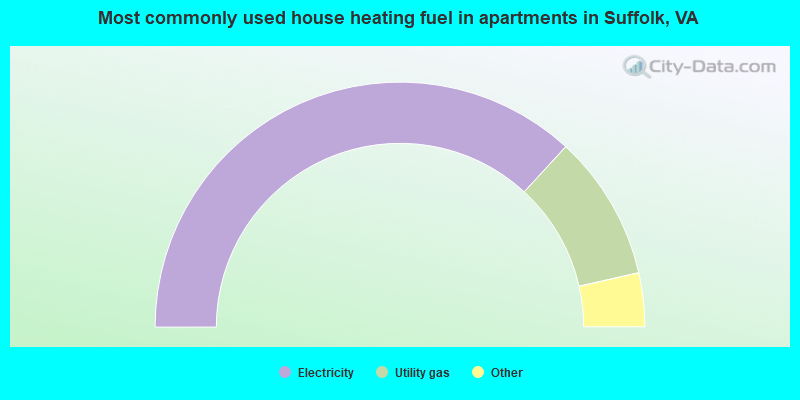
House heating fuel used in apartments - Utility gas (%)
House heating fuel used in apartments - Bottled, tank, or LP gas (%)
House heating fuel used in apartments - Electricity (%)
House heating fuel used in apartments - Fuel oil, kerosene, etc. (%)
House heating fuel used in apartments - Coal or coke (%)
House heating fuel used in apartments - Wood (%)
House heating fuel used in apartments - Solar energy (%)
House heating fuel used in apartments - Other fuel (%)
House heating fuel used in apartments - No fuel used (%)
Latest news about housing in Suffolk, VA collected exclusively by city-data.com from local newspapers, TV, and radio stations
Median year house/condo built: 1997Median year apartment built: 1988Household type by relationship:
Households: 98,537
Male householders: 19,242 (3,810 living alone ), Female householders: 19,471 (5,551 living alone )18,226 spouses (17,982 opposite-sex spouses ), 3,435 unmarried partners , (3,435 opposite-sex unmarried partners ), 29,467 children (26,628 natural , 966 adopted , 1,873 stepchildren ), 2,283 grandchildren , 1,184 brothers or sisters , 801 parents , 289 foster children , 1,032 other relatives , 1,895 non-relatives In group quarters: 1,212
Size of family households: 11,218 2-persons , 7,148 3-persons , 4,731 4-persons , 2,338 5-persons , 1,366 6-persons , 518 7-or-more-persons .
Size of nonfamily households: 9,361 1-person , 1,311 2-persons , 444 3-persons , 278 4-persons .
12,314 married couples with children. single-parent households (2,345 men , 5,448 women ).
93.8% of residents of Suffolk speak English at home. of residents speak Spanish at home (73% speak English very well , 19% speak English well , 7% speak English not well , 1% don't speak English at all ).of residents speak other Indo-European language at home (83% speak English very well , 11% speak English well , 5% speak English not well , 1% don't speak English at all ).of residents speak Asian or Pacific Island language at home (56% speak English very well , 17% speak English well , 16% speak English not well , 11% don't speak English at all ).of residents speak other language at home (31% speak English very well , 30% speak English well , 38% speak English not well ).
Foreign born population: 3,175 (3.2%)of them are naturalized citizens )
Median number of rooms in houses and condos:
Median number of rooms in apartments
Owner-occupied Renter-occupied
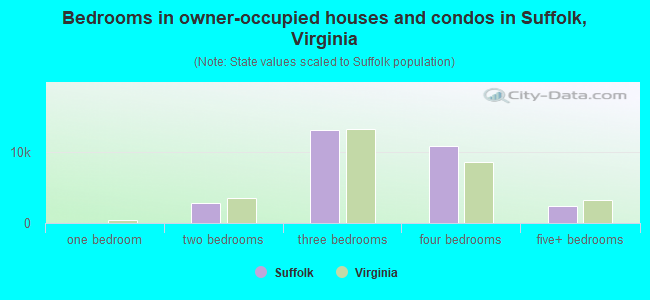
Bedrooms in owner-occupied houses and condos in Suffolk, Virginia
34 no bedroom 68 1 bedroom 2,741 2 bedrooms 13,056 3 bedrooms 10,815 4 bedrooms 2,357 5+ bedrooms
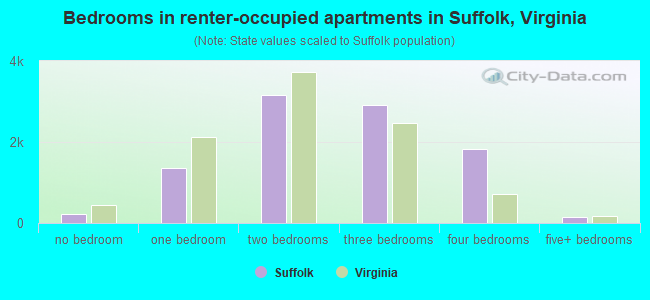
Bedrooms in renter-occupied apartments in Suffolk, Virginia
220 no bedroom 1,369 1 bedroom 3,159 2 bedrooms 2,915 3 bedrooms 1,822 4 bedrooms 157 5+ bedrooms
Owner-occupied Renter-occupied
Rooms in owner-occupied houses in Suffolk, Virginia
34 1 room 0 2 rooms 149 3 rooms 1,877 4 rooms 5,363 5 rooms 4,897 6 rooms 4,523 7 rooms 5,068 8 rooms 7,160 9+ rooms
Rooms in renter-occupied apartments in Suffolk, Virginia
164 1 room 141 2 rooms 1,016 3 rooms 2,616 4 rooms 1,745 5 rooms 1,596 6 rooms 1,848 7 rooms 312 8 rooms 204 9+ rooms
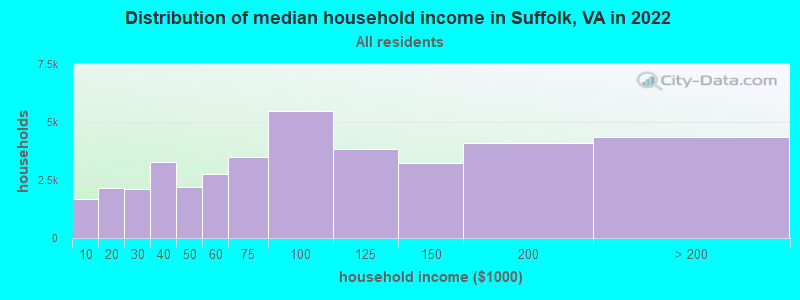
Suffolk, VA household income distribution 1,671 Less than $10,0002,141 $10,000 to $19,9992,094 $20,000 to $29,9993,286 $30,000 to $39,9992,180 $40,000 to $49,9992,759 $50,000 to $59,9993,512 $60,000 to $74,9995,493 $75,000 to $99,9993,850 $100,000 to $124,9993,252 $125,000 to $149,9994,114 $150,000 to $199,9994,361 $200,000 or more
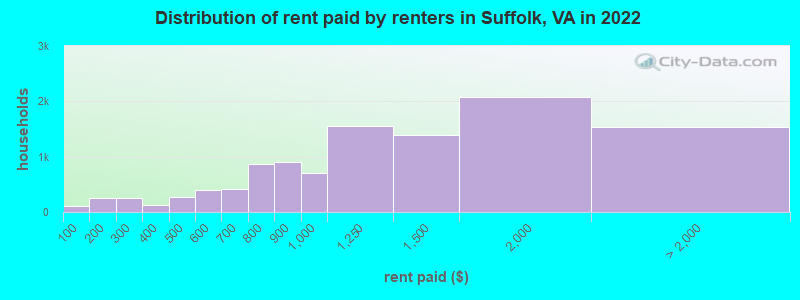
Home value of owner - occupied houses in 2022 in Suffolk, VA 764 Less than $10,000265 $15,000 to $19,99970 $20,000 to $24,999141 $25,000 to $29,999313 $30,000 to $34,999127 $40,000 to $49,99994 $50,000 to $59,999166 $60,000 to $69,99927 $70,000 to $79,999183 $80,000 to $89,999417 $90,000 to $99,999516 $100,000 to $124,999291 $125,000 to $149,999563 $150,000 to $174,999984 $175,000 to $199,9993,333 $200,000 to $249,9994,400 $250,000 to $299,9996,661 $300,000 to $399,9995,310 $400,000 to $499,9993,105 $500,000 to $749,999879 $750,000 to $999,999225 $1,000,000 to $1,499,999192 $1,500,000 to $1,999,99945 $2,000,000 or moreRent paid by renters in 2022 in Suffolk, VA 101 Less than $10098 $100 to $149151 $150 to $199218 $200 to $24940 $250 to $29971 $300 to $34958 $350 to $399147 $400 to $449130 $450 to $499232 $500 to $549166 $550 to $599206 $600 to $649202 $650 to $699339 $700 to $749533 $750 to $799904 $800 to $899699 $900 to $9991,550 $1,000 to $1,2491,400 $1,250 to $1,4992,085 $1,500 to $1,999525 $2,000 to $2,499175 $2,500 to $2,999141 $3,000 to $3,499110 $3,500 or more576 No cash rent
Percentage of workers working in this county: 35.2%Number of people working at home: 4,804 (10.3% of all workers )
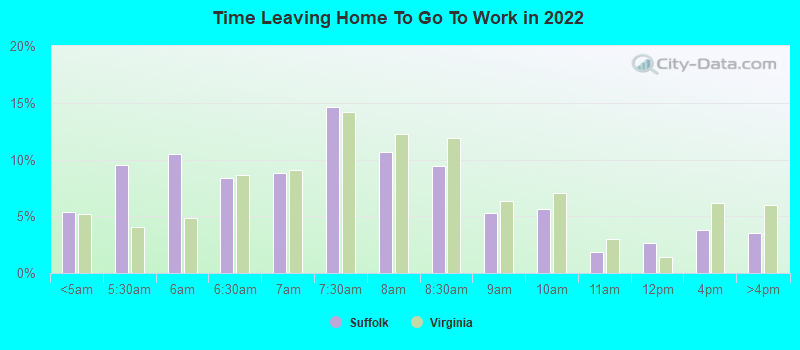
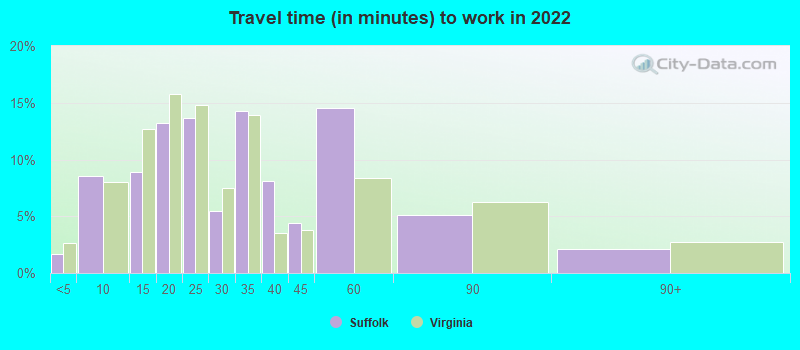
Travel time to work (commute)
Less than 5 minutes: 6025 to 9 minutes: 2,10310 to 14 minutes: 2,80615 to 19 minutes: 3,83420 to 24 minutes: 4,33825 to 29 minutes: 4,00330 to 34 minutes: 8,28735 to 39 minutes: 3,20140 to 44 minutes: 2,94245 to 59 minutes: 6,25760 to 89 minutes: 2,11190 or more minutes: 1,040
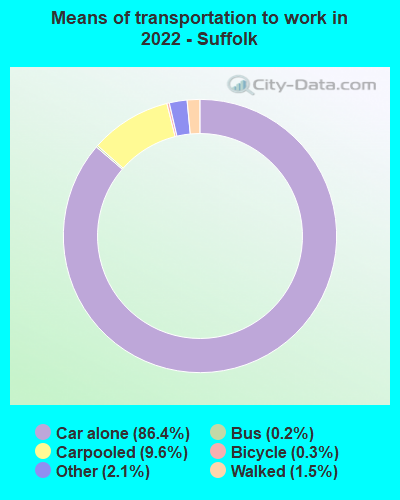
Means of transportation to work:
Drove a car alone: 29,966 (74.7%)Carpooled: 3,365 (8.4%)Bus : 43 (0.1%)Light rail, streetcar or trolley : 1 (0.0%)Taxi: 867 (2.2%)Bicycle: 111 (0.3%)Walked: 544 (1.4%)Worked at home: 4,804 (12.0%)
Unemployment by race in 2022
Unemployment rate for White non-Hispanic residents 3.9% Males2.9% FemalesUnemployment rate for Black residents 3.7% Males6.3% FemalesUnemployment rate for Asian residents 32.5% Males2.3% FemalesUnemployment rate for other race residents 8.9% Males10.6% FemalesUnemployment rate for two or more race residents 8.2% Males9.8% FemalesUnemployment rate for Hispanic or Latino residents 11.3% Males8.4% Females
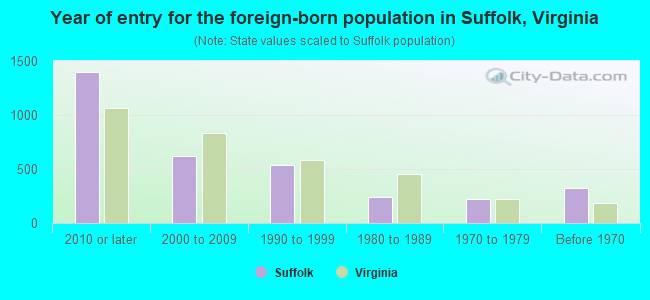
Year of entry for the foreign-born population in Suffolk, Virginia
1,400 2010 or later 625 2000 to 2009 534 1990 to 1999 243 1980 to 1989 224 1970 to 1979 326 Before 1970
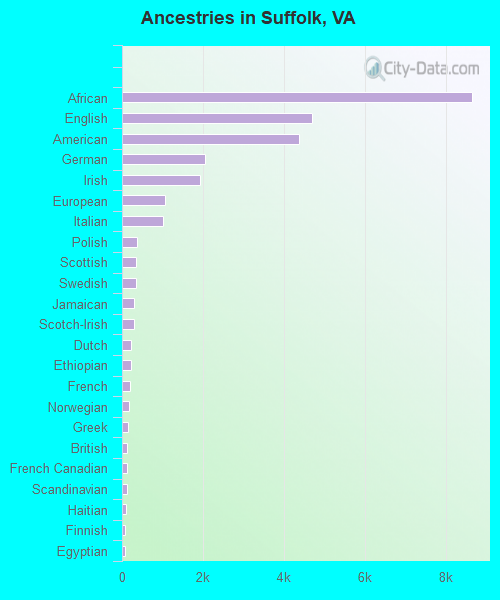
First ancestries reported:
African: 8,633 (17.2%)
English: 4,689 (9.3%)
American: 4,369 (8.7%)
German: 2,058 (4.1%)
Irish: 1,926 (3.8%)
European: 1,056 (2.1%)
Italian: 1,025 (2.0%)
Polish: 372 (0.7%)
Scottish: 358 (0.7%)
Swedish: 342 (0.7%)
Jamaican: 302 (0.6%)
Scotch-Irish: 294 (0.6%)
Dutch: 234 (0.5%)
Ethiopian: 213 (0.4%)
French: 196 (0.4%)
Norwegian: 173 (0.3%)
Greek: 138 (0.3%)
British: 123 (0.2%)
French Canadian: 121 (0.2%)
Scandinavian: 117 (0.2%)
Haitian: 111 (0.2%)
Finnish: 84 (0.2%)
Egyptian: 79 (0.2%)
Trinidadian and Tobagonian: 78 (0.2%)
Ghanaian: 75 (0.1%)
Danish: 73 (0.1%)
Ukrainian: 65 (0.1%)
Eastern European: 62 (0.1%)
Pennsylvania German: 47 (0.09%)
Portuguese: 46 (0.09%)
Canadian: 44 (0.09%)
Russian: 38 (0.08%)
Northern European: 36 (0.07%)
Welsh: 32 (0.06%)
Romanian: 29 (0.06%)
Czechoslovakian: 29 (0.06%)
West Indian: 27 (0.05%)
Swiss: 25 (0.05%)
Syrian: 24 (0.05%)
Belizean: 19 (0.04%)
Austrian: 17 (0.03%)
Hungarian: 17 (0.03%)
Lithuanian: 17 (0.03%)
Slovene: 13 (0.03%)
Barbadian: 12 (0.02%)
Iranian: 11 (0.02%)
Armenian: 10 (0.02%)
Guyanese: 10 (0.02%)
Brazilian: 9 (0.02%)
South African: 7 (0.01%)
Czech: 6 (0.01%)
Cajun: 3 (0.01%)
Slovak: 3 (0.01%)
Most common places of birth for foreign-born residents (%): Philippines Suffolk:
10.0% (369)Virginia:
4.8% (52,629)
Vietnam Suffolk:
8.2% (304)Virginia:
4.2% (45,750)
Dominican Republic Suffolk:
6.6% (246)Virginia:
0.6% (6,698)
Mexico Suffolk:
6.2% (228)Virginia:
5.3% (57,498)
El Salvador Suffolk:
5.6% (206)Virginia:
9.9% (107,534)
Jamaica Suffolk:
5.5% (205)Virginia:
1.0% (10,734)
Germany Suffolk:
4.9% (183)Virginia:
1.7% (18,227)
Bangladesh Suffolk:
4.5% (166)Virginia:
1.1% (12,049)
Ethiopia Suffolk:
4.2% (155)Virginia:
2.9% (32,082)
Canada Suffolk:
3.6% (134)Virginia:
1.2% (12,984)
Korea Suffolk:
2.5% (94)Virginia:
4.9% (52,857)
Thailand Suffolk:
2.3% (86)Virginia:
0.7% (7,672)
Haiti Suffolk:
2.1% (79)Virginia:
0.4% (4,246)
Trinidad and Tobago Suffolk:
1.9% (69)Virginia:
0.4% (4,211)
India Suffolk:
1.6% (58)Virginia:
9.0% (97,830)
Ghana Suffolk:
1.6% (58)Virginia:
1.6% (17,346)
Place of birth for U.S.-born residents:
This state: 58,811Other state: 34,778Northeast: 8,736Midwest: 5,404South: 14,391West: 6,247 86.9% of Suffolk residents lived in the same house 1 years ago.
Out of people who lived in different houses, 20.8% lived in this county.
Out of people who lived in different counties, 68.7% lived in Virginia.
Suffolk:
86.9%State average:
86.6%
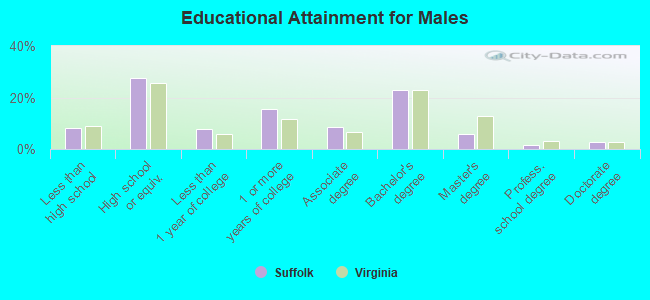
Education attainment for males 25 years and older:
No schooling: 531Nursery to 4th grade: 345th and 6th grade: 4467th and 8th grade: 2329th grade: 30210th grade: 10211th grade: 37412th grade, no diploma: 512High school graduate (or equivalency): 8,585Less than 1 year of college: 2,369Some college more than 1 year, no degree: 4,875Associate degree: 2,624Bachelor's degree: 7,127Master's degree: 1,819Professional school degree: 451Doctorate degree: 863
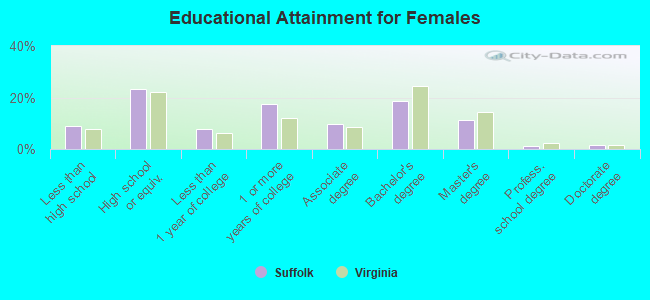
Education attainment for females 25 years and older:
No schooling: 444Nursery to 4th grade: 585th and 6th grade: 2867th and 8th grade: 2529th grade: 28510th grade: 46011th grade: 86812th grade, no diploma: 498High school graduate (or equivalency): 8,287Less than 1 year of college: 2,798Some college more than 1 year, no degree: 6,159Associate degree: 3,458Bachelor's degree: 6,625Master's degree: 4,015Professional school degree: 462Doctorate degree: 539
Housing units in structures:
One, detached: 30,514One, attached: 3,310Two: 1,0523 or 4: 1,0125 to 9: 84910 to 19: 1,08220 to 49: 54550 or more: 1,724Mobile homes: 712Boats, RVs, vans, etc.: 49Median worth of mobile homes: $35,051
Housing units lacking complete plumbing facilities in 2022: 0.4%Housing units lacking complete kitchen facilities in 2022: 0.3%House/condo owner moved in on average 7 years ago
Renter moved in on average 3 years ago
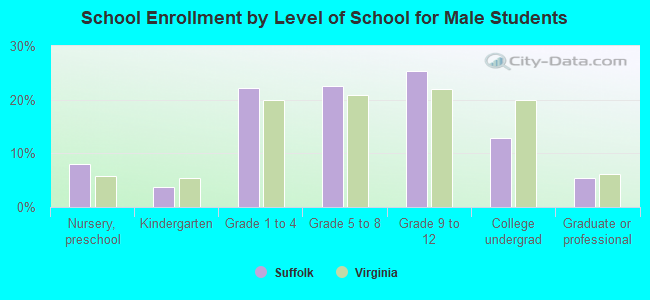
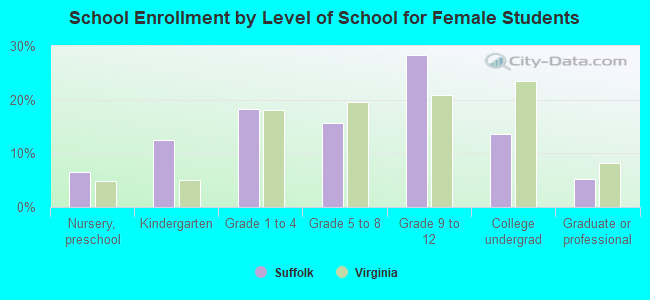
Private vs. public school enrollment:
Students in private schools in grades 1 to 8 (elementary and middle school): 2,178 Students in private schools in grades 9 to 12 (high school): 772 Students in private undergraduate colleges: 216