Races in Suffolk, Virginia (VA) Detailed Stats
Data:
Races - White alone (%)
Races - White alone (% change since 2000)
Races - Black alone (%)
Races - Black alone (% change since 2000)
Races - American Indian alone (%)
Races - American Indian alone (% change since 2000)
Races - Asian alone (%)
Races - Asian alone (% change since 2000)
Races - Hispanic (%)
Races - Hispanic (% change since 2000)
Races - Native Hawaiian and Other Pacific Islander alone (%)
Races - Native Hawaiian and Other Pacific Islander alone (% change since 2000)
Races - Two or more races(%)
Races - Two or more races(% change since 2000)
Races - Other race alone (%)
Races - Other race alone (% change since 2000)
Racial diversity
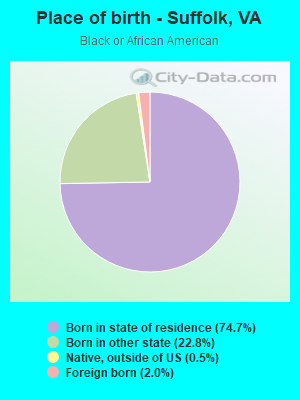
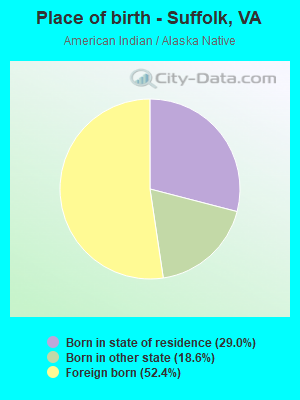
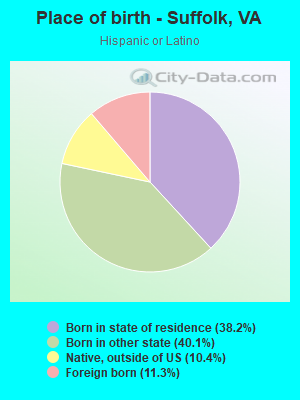
Place of birth - Born in state of residence (%)
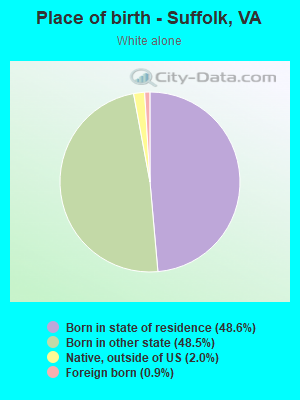
Place of birth - Born in state of residence (%) - White
Place of birth - Born in state of residence (%) - Black or African American
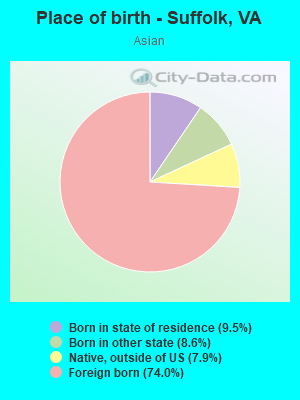
Place of birth - Born in state of residence (%) - Asian
Place of birth - Born in state of residence (%) - Hispanic or Latino
Place of birth - Born in state of residence (%) - American Indian and Alaska Native
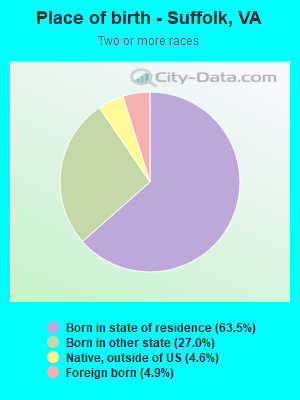
Place of birth - Born in state of residence (%) - Multirace
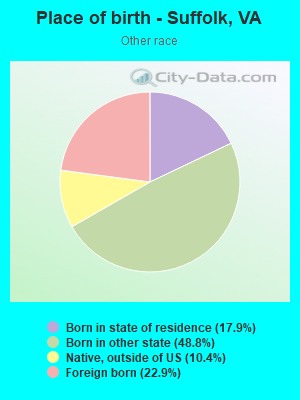
Place of birth - Born in state of residence (%) - Other Race
Place of birth - Born in other state (%)
Place of birth - Born in other state (%) - White
Place of birth - Born in other state (%) - Black or African American
Place of birth - Born in other state (%) - Asian
Place of birth - Born in other state (%) - Hispanic or Latino
Place of birth - Born in other state (%) - American Indian and Alaska Native
Place of birth - Born in other state (%) - Multirace
Place of birth - Born in other state (%) - Other Race
Place of birth - Native, outside of US (%)
Place of birth - Native, outside of US (%) - White
Place of birth - Native, outside of US (%) - Black or African American
Place of birth - Native, outside of US (%) - Asian
Place of birth - Native, outside of US (%) - Hispanic or Latino
Place of birth - Native, outside of US (%) - American Indian and Alaska Native
Place of birth - Native, outside of US (%) - Multirace
Place of birth - Native, outside of US (%) - Other Race
Place of birth - Foreign born (%)
Place of birth - Foreign born (%) - White
Place of birth - Foreign born (%) - Black or African American
Place of birth - Foreign born (%) - Asian
Place of birth - Foreign born (%) - Hispanic or Latino
Place of birth - Foreign born (%) - American Indian and Alaska Native
Place of birth - Foreign born (%) - Multirace
Place of birth - Foreign born (%) - Other Race
Residents speaking English at home (%)
Residents speaking English at home - Born in the United States (%)
Residents speaking English at home - Native, born elsewhere (%)
Residents speaking English at home - Foreign born (%)
Residents speaking Spanish at home (%)
Residents speaking Spanish at home - Born in the United States (%)
Residents speaking Spanish at home - Native, born elsewhere (%)
Residents speaking Spanish at home - Foreign born (%)
Residents speaking other language at home (%)
Residents speaking other language at home - Born in the United States (%)
Residents speaking other language at home - Native, born elsewhere (%)
Residents speaking other language at home - Foreign born (%)
Marital status - Never married (%)
Marital status - Now married (%)
Marital status - Separated (%)
Marital status - Widowed (%)
Marital status - Divorced (%)
Ancestries Reported - Arab (%)
Ancestries Reported - Czech (%)
Ancestries Reported - Danish (%)
Ancestries Reported - Dutch (%)
Ancestries Reported - English (%)
Ancestries Reported - French (%)
Ancestries Reported - French Canadian (%)
Ancestries Reported - German (%)
Ancestries Reported - Greek (%)
Ancestries Reported - Hungarian (%)
Ancestries Reported - Irish (%)
Ancestries Reported - Italian (%)
Ancestries Reported - Lithuanian (%)
Ancestries Reported - Norwegian (%)
Ancestries Reported - Polish (%)
Ancestries Reported - Portuguese (%)
Ancestries Reported - Russian (%)
Ancestries Reported - Scotch-Irish (%)
Ancestries Reported - Scottish (%)
Ancestries Reported - Slovak (%)
Ancestries Reported - Subsaharan African (%)
Ancestries Reported - Swedish (%)
Ancestries Reported - Swiss (%)
Ancestries Reported - Ukrainian (%)
Ancestries Reported - United States (%)
Ancestries Reported - Welsh (%)
Ancestries Reported - West Indian (%)
Ancestries Reported - Other (%)
Geographical mobility - Same house 1 year ago (%)
Geographical mobility - Same house 1 year ago (%) - White
Geographical mobility - Same house 1 year ago (%) - Black or African American
Geographical mobility - Same house 1 year ago (%) - Asian
Geographical mobility - Same house 1 year ago (%) - Hispanic or Latino
Geographical mobility - Same house 1 year ago (%) - American Indian and Alaska Native
Geographical mobility - Same house 1 year ago (%) - Multirace
Geographical mobility - Same house 1 year ago (%) - Other Race
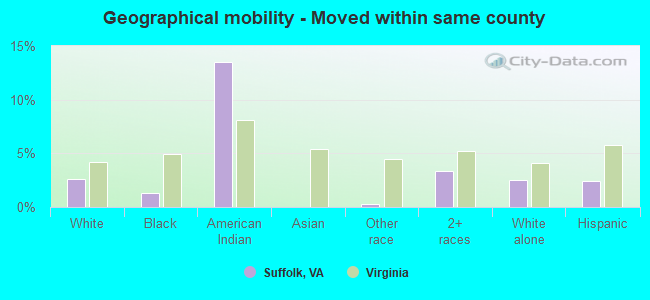
Geographical mobility - Moved within same county (%)
Geographical mobility - Moved within same county (%) - White
Geographical mobility - Moved within same county (%) - Black or African American
Geographical mobility - Moved within same county (%) - Asian
Geographical mobility - Moved within same county (%) - Hispanic or Latino
Geographical mobility - Moved within same county (%) - American Indian and Alaska Native
Geographical mobility - Moved within same county (%) - Multirace
Geographical mobility - Moved within same county (%) - Other Race
Geographical mobility - Moved from different county within same state (%)
Geographical mobility - Moved from different county within same state (%) - White
Geographical mobility - Moved from different county within same state (%) - Black or African American
Geographical mobility - Moved from different county within same state (%) - Asian
Geographical mobility - Moved from different county within same state (%) - Hispanic or Latino
Geographical mobility - Moved from different county within same state (%) - American Indian and Alaska Native
Geographical mobility - Moved from different county within same state (%) - Multirace
Geographical mobility - Moved from different county within same state (%) - Other Race
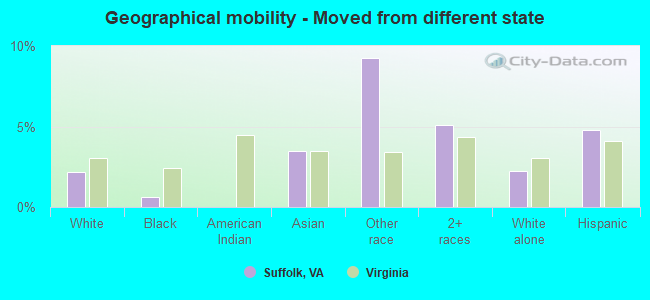
Geographical mobility - Moved from different state (%)
Geographical mobility - Moved from different state (%) - White
Geographical mobility - Moved from different state (%) - Black or African American
Geographical mobility - Moved from different state (%) - Asian
Geographical mobility - Moved from different state (%) - Hispanic or Latino
Geographical mobility - Moved from different state (%) - American Indian and Alaska Native
Geographical mobility - Moved from different state (%) - Multirace
Geographical mobility - Moved from different state (%) - Other Race
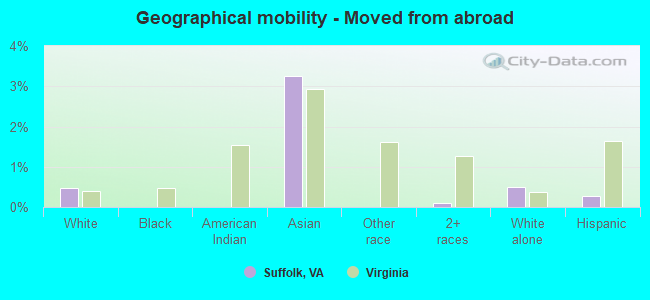
Geographical mobility - Moved from abroad (%)
Geographical mobility - Moved from abroad (%) - White
Geographical mobility - Moved from abroad (%) - Black or African American
Geographical mobility - Moved from abroad (%) - Asian
Geographical mobility - Moved from abroad (%) - Hispanic or Latino
Geographical mobility - Moved from abroad (%) - American Indian and Alaska Native
Geographical mobility - Moved from abroad (%) - Multirace
Geographical mobility - Moved from abroad (%) - Other Race
Place of birth for the foreign-born population - Ireland (%)
Place of birth for the foreign-born population - Denmark (%)
Place of birth for the foreign-born population - Norway (%)
Place of birth for the foreign-born population - Sweden (%)
Place of birth for the foreign-born population - United Kingdom (%)
Place of birth for the foreign-born population - England (%)
Place of birth for the foreign-born population - Scotland (%)
Place of birth for the foreign-born population - Other Northern Europe (%)
Place of birth for the foreign-born population - Austria (%)
Place of birth for the foreign-born population - Belgium (%)
Place of birth for the foreign-born population - France (%)
Place of birth for the foreign-born population - Germany (%)
Place of birth for the foreign-born population - Netherlands (%)
Place of birth for the foreign-born population - Switzerland (%)
Place of birth for the foreign-born population - Other Western Europe (%)
Place of birth for the foreign-born population - Greece (%)
Place of birth for the foreign-born population - Italy (%)
Place of birth for the foreign-born population - Portugal (%)
Place of birth for the foreign-born population - Spain (%)
Place of birth for the foreign-born population - Other Southern Europe (%)
Place of birth for the foreign-born population - Albania (%)
Place of birth for the foreign-born population - Belarus (%)
Place of birth for the foreign-born population - Bosnia and Herzegovina (%)
Place of birth for the foreign-born population - Bulgaria (%)
Place of birth for the foreign-born population - Croatia (%)
Place of birth for the foreign-born population - Czechoslovakia (%)
Place of birth for the foreign-born population - Hungary (%)
Place of birth for the foreign-born population - Latvia (%)
Place of birth for the foreign-born population - Lithuania (%)
Place of birth for the foreign-born population - North Macedonia (Macedonia) (%)
Place of birth for the foreign-born population - Moldova (%)
Place of birth for the foreign-born population - Poland (%)
Place of birth for the foreign-born population - Romania (%)
Place of birth for the foreign-born population - Russia (%)
Place of birth for the foreign-born population - Serbia (%)
Place of birth for the foreign-born population - Ukraine (%)
Place of birth for the foreign-born population - Other Eastern Europe (%)
Place of birth for the foreign-born population - China (%)
Place of birth for the foreign-born population - Hong Kong (%)
Place of birth for the foreign-born population - Taiwan (%)
Place of birth for the foreign-born population - Japan (%)
Place of birth for the foreign-born population - Korea (%)
Place of birth for the foreign-born population - Other Eastern Asia (%)
Place of birth for the foreign-born population - Afghanistan (%)
Place of birth for the foreign-born population - Bangladesh (%)
Place of birth for the foreign-born population - India (%)
Place of birth for the foreign-born population - Iran (%)
Place of birth for the foreign-born population - Kazakhstan (%)
Place of birth for the foreign-born population - Nepal (%)
Place of birth for the foreign-born population - Pakistan (%)
Place of birth for the foreign-born population - Sri Lanka (%)
Place of birth for the foreign-born population - Uzbekistan (%)
Place of birth for the foreign-born population - Other South Central Asia (%)
Place of birth for the foreign-born population - Burma (%)
Place of birth for the foreign-born population - Cambodia (%)
Place of birth for the foreign-born population - Indonesia (%)
Place of birth for the foreign-born population - Laos (%)
Place of birth for the foreign-born population - Malaysia (%)
Place of birth for the foreign-born population - Philippines (%)
Place of birth for the foreign-born population - Singapore (%)
Place of birth for the foreign-born population - Thailand (%)
Place of birth for the foreign-born population - Vietnam (%)
Place of birth for the foreign-born population - Other South Eastern Asia (%)
Place of birth for the foreign-born population - Armenia (%)
Place of birth for the foreign-born population - Iraq (%)
Place of birth for the foreign-born population - Israel (%)
Place of birth for the foreign-born population - Jordan (%)
Place of birth for the foreign-born population - Kuwait (%)
Place of birth for the foreign-born population - Lebanon (%)
Place of birth for the foreign-born population - Saudi Arabia (%)
Place of birth for the foreign-born population - Syria (%)
Place of birth for the foreign-born population - Turkey (%)
Place of birth for the foreign-born population - Yemen (%)
Place of birth for the foreign-born population - Other Western Asia (%)
Place of birth for the foreign-born population - Eritrea (%)
Place of birth for the foreign-born population - Ethiopia (%)
Place of birth for the foreign-born population - Kenya (%)
Place of birth for the foreign-born population - Somalia (%)
Place of birth for the foreign-born population - Uganda (%)
Place of birth for the foreign-born population - Zimbabwe (%)
Place of birth for the foreign-born population - Other Eastern Africa (%)
Place of birth for the foreign-born population - Cameroon (%)
Place of birth for the foreign-born population - Congo (%)
Place of birth for the foreign-born population - Democratic Republic of Congo (Zaire) (%)
Place of birth for the foreign-born population - Other Middle Africa (%)
Place of birth for the foreign-born population - Egypt (%)
Place of birth for the foreign-born population - Morocco (%)
Place of birth for the foreign-born population - Sudan (%)
Place of birth for the foreign-born population - Other Northern Africa (%)
Place of birth for the foreign-born population - South Africa (%)
Place of birth for the foreign-born population - Other Southern Africa (%)
Place of birth for the foreign-born population - Cabo Verde (%)
Place of birth for the foreign-born population - Ghana (%)
Place of birth for the foreign-born population - Liberia (%)
Place of birth for the foreign-born population - Nigeria (%)
Place of birth for the foreign-born population - Senegal (%)
Place of birth for the foreign-born population - Sierra Leone (%)
Place of birth for the foreign-born population - Other Western Africa (%)
Place of birth for the foreign-born population - Australia (%)
Place of birth for the foreign-born population - New Zealand (%)
Place of birth for the foreign-born population - Fiji (%)
Place of birth for the foreign-born population - Micronesia (%)
Place of birth for the foreign-born population - Bahamas (%)
Place of birth for the foreign-born population - Barbados (%)
Place of birth for the foreign-born population - Cuba (%)
Place of birth for the foreign-born population - Dominica (%)
Place of birth for the foreign-born population - Dominican Republic (%)
Place of birth for the foreign-born population - Grenada (%)
Place of birth for the foreign-born population - Haiti (%)
Place of birth for the foreign-born population - Jamaica (%)
Place of birth for the foreign-born population - St. Vincent and the Grenadines (%)
Place of birth for the foreign-born population - Trinidad and Tobago (%)
Place of birth for the foreign-born population - West Indies (%)
Place of birth for the foreign-born population - Other Caribbean (%)
Place of birth for the foreign-born population - Belize (%)
Place of birth for the foreign-born population - Costa Rica (%)
Place of birth for the foreign-born population - El Salvador (%)
Place of birth for the foreign-born population - Guatemala (%)
Place of birth for the foreign-born population - Honduras (%)
Place of birth for the foreign-born population - Mexico (%)
Place of birth for the foreign-born population - Nicaragua (%)
Place of birth for the foreign-born population - Panama (%)
Place of birth for the foreign-born population - Other Central America (%)
Place of birth for the foreign-born population - Argentina (%)
Place of birth for the foreign-born population - Bolivia (%)
Place of birth for the foreign-born population - Brazil (%)
Place of birth for the foreign-born population - Chile (%)
Place of birth for the foreign-born population - Colombia (%)
Place of birth for the foreign-born population - Ecuador (%)
Place of birth for the foreign-born population - Guyana (%)
Place of birth for the foreign-born population - Peru (%)
Place of birth for the foreign-born population - Uruguay (%)
Place of birth for the foreign-born population - Venezuela (%)
Place of birth for the foreign-born population - Other South America (%)
Place of birth for the foreign-born population - Canada (%)
Place of birth for the foreign-born population - Other Northern America (%)
Place of birth for the foreign-born population - Other (%)
Latest news about races in Suffolk, VA collected exclusively by city-data.com from local newspapers, TV, and radio stations
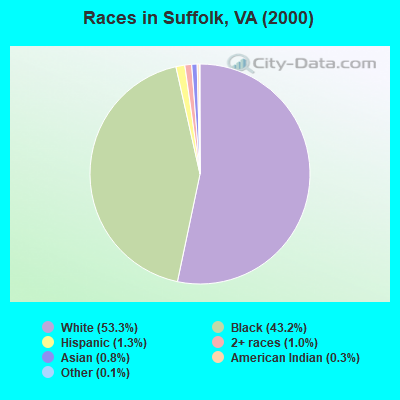
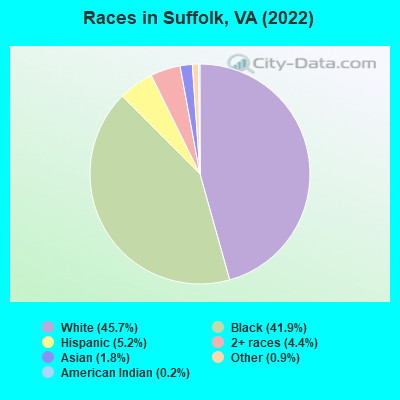
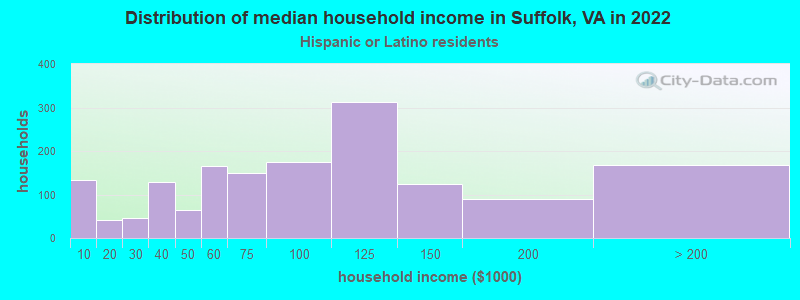
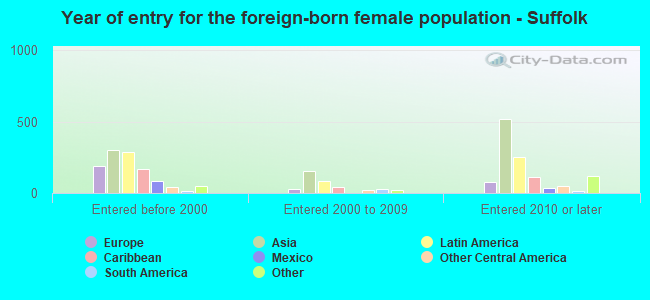
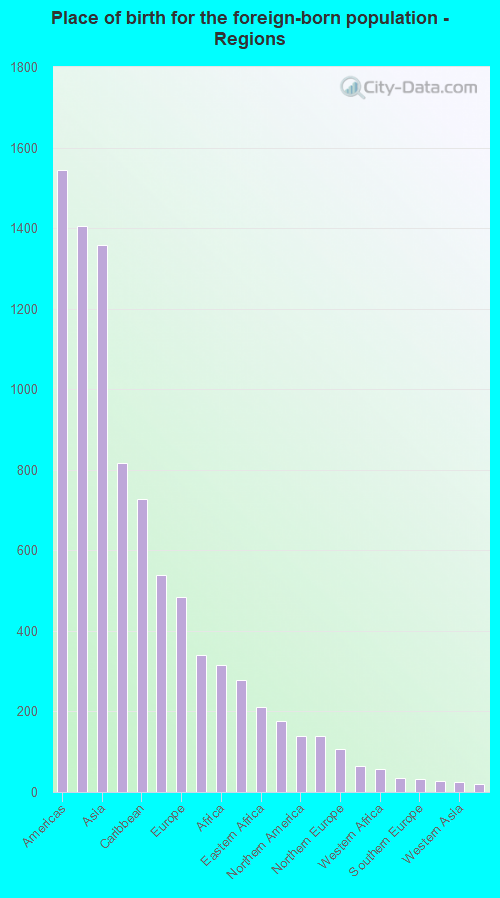
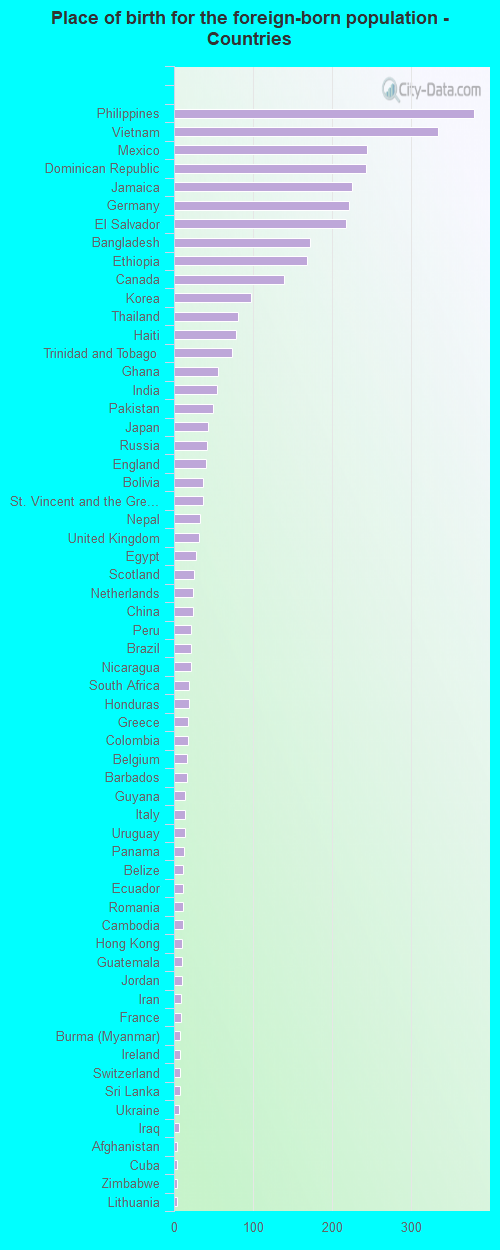
According to 2022 data, the most numerous races in Suffolk, VA are White alone (44,984 residents), Black alone (41,312 residents), and Hispanic (5,137 residents). 94.5% of Suffolk residents speak English at home. 3.8% of Suffolk, VA residents are foreign-born (1.5% born in Latin America, 1.4% born in Asia, 0.5% born in Europe), which is 219.2% less than the foreign-born rate of 12.0% across the entire state of Virginia.
Race distribution in Suffolk
2000 2022
4,965,637 70.2% White alone 1,376,378 19.4% Black alone 329,540 4.7% Hispanic 259,277 3.7% Asian alone 114,022 1.6% Two or more races 18,596 0.3% American Indian alone 11,685 0.2% Other race alone 3,380 0.05% Native Hawaiian and Other
5,095,130 58.7% White alone 1,594,785 18.4% Black alone 905,750 10.4% Hispanic 602,881 6.9% Asian alone 406,047 4.7% Two or more races 60,419 0.7% Other race alone 11,738 0.1% American Indian alone 6,869 0.08% Native Hawaiian and Other
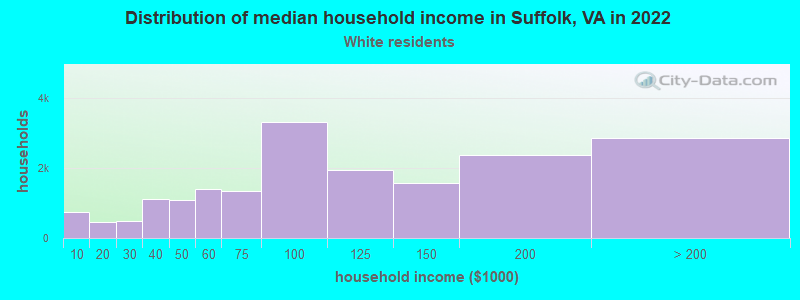
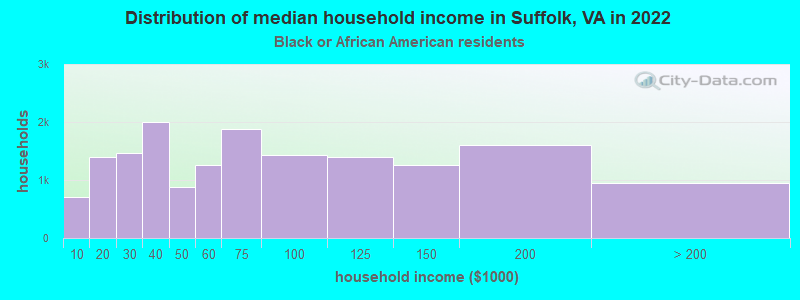
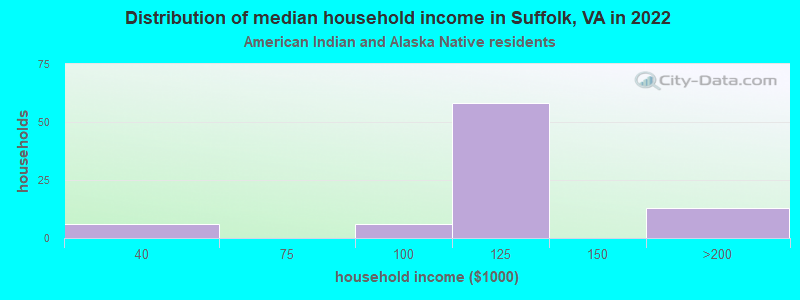
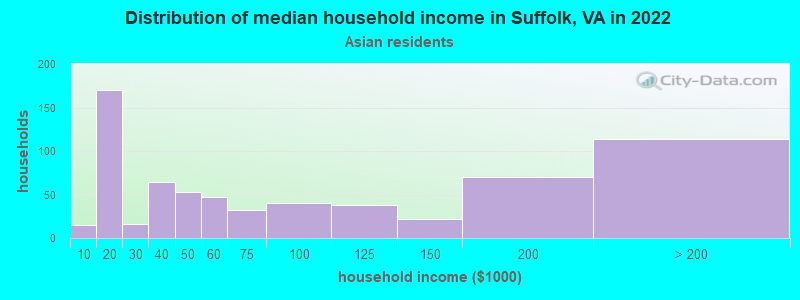
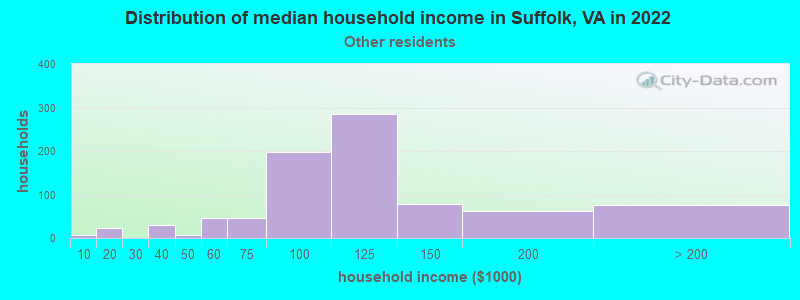
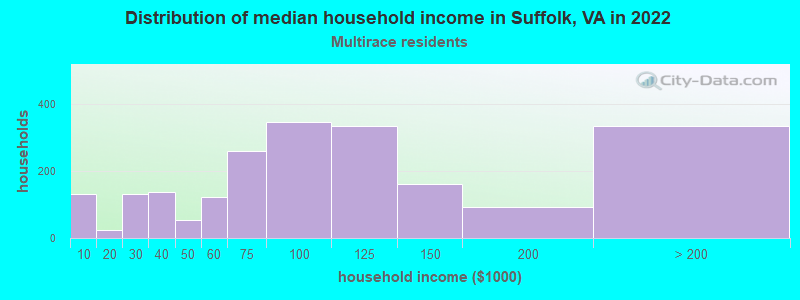
Income and house value in Suffolk Median household income in 2022 $95,517 White non-Hispanic householders$64,525 Black householders$51,686 Asian householders$77,609 Some other race householders$100,474 Two or more races householders$79,444 Hispanic or Latino race householdersMedian 2022 house value $375,310 White Non-Hispanic householders$253,766 Black or African American householders$387,558 American Indian or Alaska Native householders $442,206 Asian householders$402,319 Some other race householders$389,128 Two or more races householders$369,342 Hispanic or Latino householders
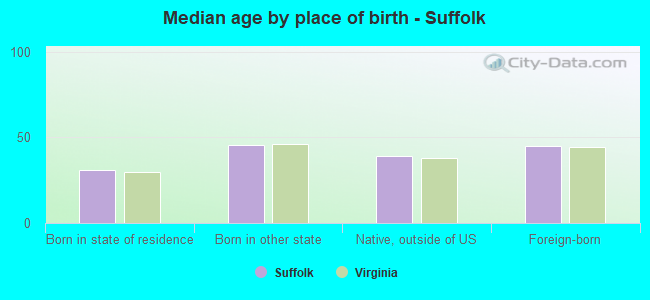
Median age by race in Suffolk
41.6 Median age for White residents40.0 44.4 38.3 Median age for Black or African American residents33.4 40.6 49.8 Median age for American Indian / Alaska Native residents57.2 49.6 42.4 Median age for Asian residents50.4 39.9 -666,666,666.0 Median age for Native Hawaiian / Pacific Islander residents-666,666,666.0 -666,666,666.0 18.8 Median age for Other race residents11.9 27.6 23.5 Median age for Two or more races residents25.5 20.4 42.2 Median age for White alone residents40.4 44.5 30.9 Median age for Hispanic or Latino residents25.0 37.7
Owner/renter occupied households by race in Suffolk
House owners and renters - White residents 15,825 84.5% Owner occupied2,908 15.5% Renter occupiedHouse owners and renters - Black or African American residents 10,662 65.7% Owner occupied5,571 34.3% Renter occupiedHouse owners and renters - American Indian / Alaska Native residents 70 100.0% Owner occupiedHouse owners and renters - Asian residents 321 47.6% Owner occupied354 52.4% Renter occupiedHouse owners and renters - Other race residents 381 63.0% Owner occupied224 37.0% Renter occupiedHouse owners and renters - Two or more races residents 1,827 75.7% Owner occupied585 24.3% Renter occupiedHouse owners and renters - White alone residents 15,338 84.1% Owner occupied2,908 15.9% Renter occupiedHouse owners and renters - Hispanic or Latino residents 1,731 86.5% Owner occupied269 13.4% Renter occupied
Language usage in Suffolk
English speakers - Total 94.5% of residents of Suffolk speak English at home.
3.2% of residents speak Spanish at home 1,487 50.5% Speak English very well1,457 49.5% Speak English less than very well2.3% of residents speak other language at home 1,230 58.1% Speak English very well886 41.9% Speak English less than very well
English speakers - Born in the United States 96.5% of residents of Suffolk speak English at home.
2.8% of residents speak Spanish at home 170 17.8% Speak English very well783 82.2% Speak English less than very well0.7% of residents speak other language at home 177 68.9% Speak English very well80 31.1% Speak English less than very well
English speakers - Native, born elsewhere 75.7% of residents of Suffolk speak English at home.
21.7% of residents speak Spanish at home 236 63.6% Speak English very well135 36.4% Speak English less than very well2.6% of residents speak other language at home 44 100.0% Speak English less than very well
English speakers - Foreign-born 26.2% of residents of Suffolk speak English at home.
24.1% of residents speak Spanish at home 356 46.5% Speak English very well409 53.5% Speak English less than very well49.7% of residents speak other language at home 870 55.1% Speak English very well709 44.9% Speak English less than very well
White (Caucasian) - Speak only English Native:
97.8% (41,971)Foreign-born:
38.4% (163)
White (Caucasian) - Speak another language Native:
2.2% (945)Foreign-born:
61.6% (262)
Black or African American - Speak only English Native:
99.0% (37,974)Foreign-born:
50.2% (417)
Black or African American - Speak another language Native:
1.0% (397)Foreign-born:
49.8% (413)
American Indian / Alaska Native - Speak only English Native:
95.6% (158)Foreign-born:
24.1% (44)
American Indian / Alaska Native - Speak another language Native:
6.1% (10)Foreign-born:
33.1% (60)
Asian - Speak only English Native:
67.0% (300)Foreign-born:
14.8% (189)
Asian - Speak another language Native:
33.0% (148)Foreign-born:
85.2% (1,088)
Other race - Speak only English Native:
72.2% (1,147)Foreign-born:
26.3% (135)
Other race - Speak another language Native:
31.6% (502)Foreign-born:
76.9% (395)
Two or more races - Speak only English Native:
88.9% (5,272)Foreign-born:
23.6% (95)
Two or more races - Speak another language Native:
9.5% (564)Foreign-born:
75.7% (303)
White alone - Speak only English Native:
98.0% (41,135)Foreign-born:
38.4% (163)
White alone - Speak another language Native:
2.0% (834)Foreign-born:
61.6% (262)
Hispanic or Latino - Speak another language Native:
31.3% (1,283)Foreign-born:
100.0% (578)
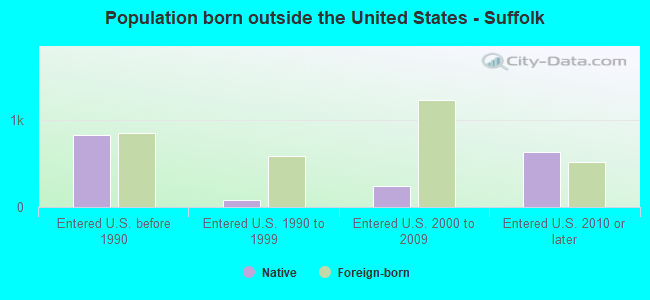
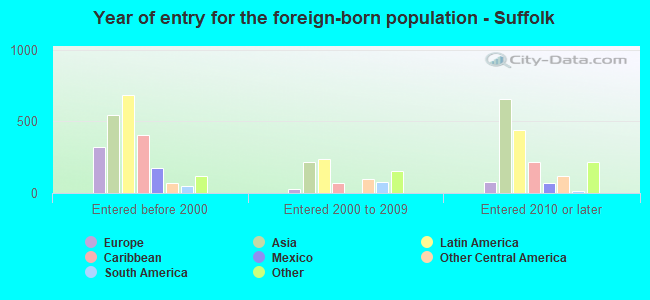
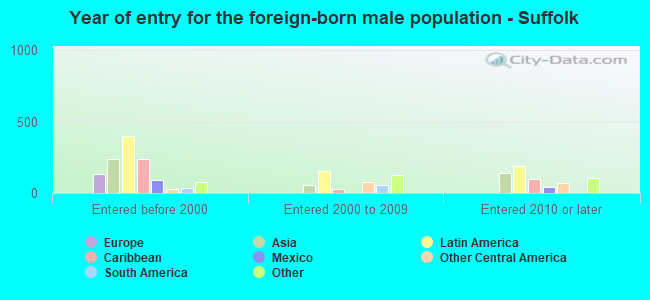
Foreign-born residents in Suffolk 3,704 residents are foreign born (1.5% Latin America , 1.4% Asia , 0.5% Europe ).
This city:
3.8%Virginia:
12.6%
Marital status for residents in Suffolk Marital status - White (Caucasian) population 15 years and over
Males 25.9% Never married63.1% Now married1.8% Separated2.3% Widowed6.9% DivorcedFemales 18.6% Never married59.9% Now married1.6% Separated8.7% Widowed11.3% DivorcedWomen who gave birth in the past 12 months Now married:
66.3% (507)Unmarried:
33.7% (258)
Women who did not give birth in the past 12 months Now married:
59.9% (5,133)Unmarried:
40.1% (3,432)
Marital status - Black or African American population 15 years and over
Males 42.3% Never married38.4% Now married4.3% Separated0.0% Widowed15.1% DivorcedFemales 41.7% Never married31.6% Now married2.8% Separated6.2% Widowed17.7% DivorcedWomen who gave birth in the past 12 months Now married:
16.7% (110)Unmarried:
83.3% (547)
Women who did not give birth in the past 12 months Now married:
27.7% (2,762)Unmarried:
72.3% (7,200)
Marital status - American Indian / Alaska Native population 15 years and over
Males 15.3% Never married59.7% Now married15.3% Separated0.0% Widowed9.7% DivorcedFemales 26.7% Never married40.1% Now married6.4% Separated21.4% Widowed5.3% DivorcedWomen who did not give birth in the past 12 months Now married:
42.5% (39)Unmarried:
57.5% (53)
Marital status - Asian population 15 years and over
Males 36.3% Never married54.9% Now married0.0% Separated0.0% Widowed8.8% DivorcedFemales 24.1% Never married52.8% Now married9.5% Separated6.5% Widowed7.2% DivorcedWomen who gave birth in the past 12 months Now married:
64.6% (32)Unmarried:
35.4% (18)
Women who did not give birth in the past 12 months Now married:
57.2% (334)Unmarried:
42.8% (250)
Marital status - Other race population 15 years and over
Males 26.4% Never married73.6% Now married0.0% Separated0.0% Widowed0.0% DivorcedFemales 29.5% Never married56.0% Now married0.0% Separated5.0% Widowed9.4% DivorcedWomen who did not give birth in the past 12 months Now married:
52.4% (368)Unmarried:
47.6% (334)
Marital status - Two or more races population 15 years and over
Males 48.8% Never married40.4% Now married1.7% Separated1.9% Widowed7.3% DivorcedFemales 43.3% Never married36.4% Now married2.8% Separated6.6% Widowed10.7% DivorcedWomen who gave birth in the past 12 months Now married:
68.1% (44)Unmarried:
31.9% (21)
Women who did not give birth in the past 12 months Now married:
31.1% (536)Unmarried:
68.9% (1,189)
Marital status - White alone, not Hispanic / Latino population 15 years and over
Males 24.6% Never married64.2% Now married1.8% Separated2.3% Widowed7.1% DivorcedFemales 18.8% Never married59.1% Now married1.6% Separated8.9% Widowed11.6% DivorcedWomen who gave birth in the past 12 months Now married:
61.5% (412)Unmarried:
38.5% (258)
Women who did not give birth in the past 12 months Now married:
58.7% (4,796)Unmarried:
41.3% (3,378)
Marital status - Hispanic or Latino population 15 years and over
Males 37.9% Never married56.9% Now married2.0% Separated0.0% Widowed3.1% DivorcedFemales 41.0% Never married46.2% Now married1.7% Separated7.6% Widowed3.5% DivorcedWomen who gave birth in the past 12 months Now married:
35.5% (35)Unmarried:
64.5% (64)
Women who did not give birth in the past 12 months Now married:
44.0% (581)Unmarried:
56.0% (738)
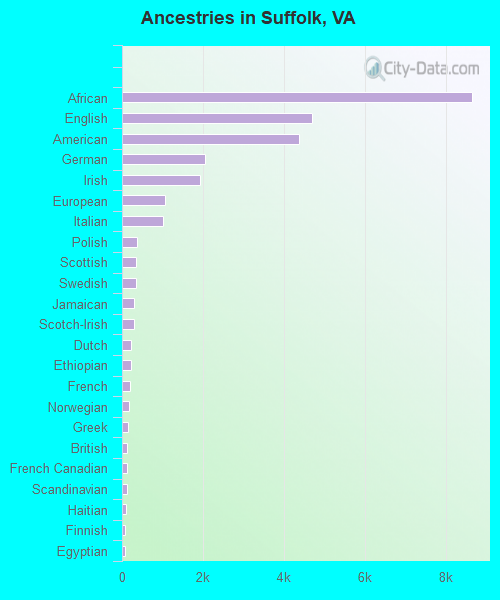
Ancestries in Suffolk
8,633 17.2% African4,689 9.3% English4,369 8.7% American2,058 4.1% German1,926 3.8% Irish1,056 2.1% European1,025 2.0% Italian372 0.7% Polish358 0.7% Scottish342 0.7% Swedish302 0.6% Jamaican294 0.6% Scotch-Irish234 0.5% Dutch213 0.4% Ethiopian196 0.4% French173 0.3% Norwegian138 0.3% Greek123 0.2% British121 0.2% French Canadian117 0.2% Scandinavian111 0.2% Haitian84 0.2% Finnish79 0.2% Egyptian78 0.2% Trinidadian and Tobagonian75 0.1% Ghanaian73 0.1% Danish65 0.1% Ukrainian62 0.1% Eastern European47 0.09% Pennsylvania German46 0.09% Portuguese44 0.09% Canadian38 0.08% Russian36 0.07% Northern European32 0.06% Welsh29 0.06% Romanian29 0.06% Czechoslovakian27 0.05% West Indian25 0.05% Swiss24 0.05% Syrian19 0.04% Belizean17 0.03% Austrian17 0.03% Hungarian17 0.03% Lithuanian13 0.03% Slovene12 0.02% Barbadian11 0.02% Iranian10 0.02% Armenian10 0.02% Guyanese9 0.02% Brazilian7 0.01% South African6 0.01% Czech3 0.01% Cajun3 0.01% Slovak
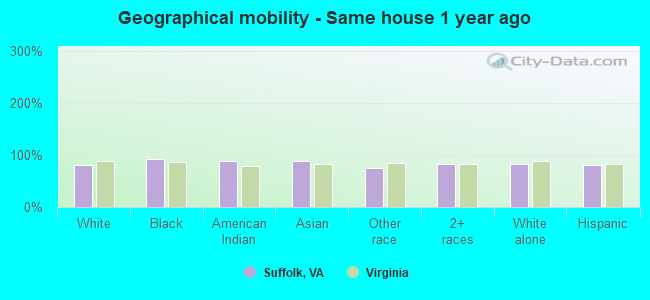
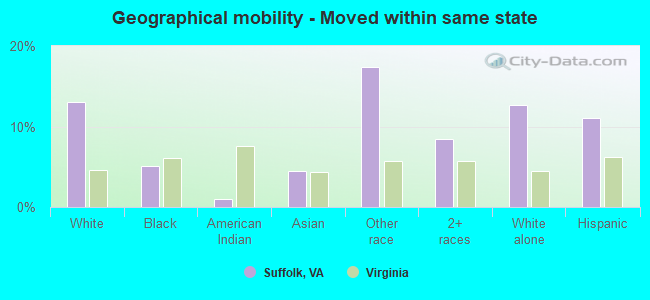
Geographical mobility in Suffolk Same house 1 year ago 37,056 81.7% White (Caucasian)38,198 93.0% Black or African American283 88.3% American Indian / Alaska Native1,591 89.0% Asian1,539 74.4% Other race6,009 83.2% Two or more races36,391 82.2% White alone, not Hispanic / Latino3,801 81.9% Hispanic or LatinoMoved within same county 1,184 2.6% White / Caucasian550 1.3% Black or African American43 13.5% American Indian / Alaska Native6 0.3% Other race242 3.4% Two or more races1,112 2.5% White alone, not Hispanic / Latino112 2.4% Hispanic or LatinoMoved within same state 5,940 13.1% White / Caucasian2,083 5.1% Black or African American3 1.0% American Indian / Alaska Native80 4.5% Asian360 17.4% Other race609 8.4% Two or more races5,599 12.6% White alone, not Hispanic / Latino516 11.1% Hispanic or LatinoMoved from different state 977 2.2% White / Caucasian244 0.6% Black or African American62 3.5% Asian192 9.3% Other race368 5.1% Two or more races977 2.2% White alone, not Hispanic / Latino221 4.8% Hispanic or LatinoMoved from abroad 216 0.5% White58 3.3% Asian8 0.1% Two or more races216 0.5% White alone, not Hispanic / Latino13 0.3% Hispanic or Latino
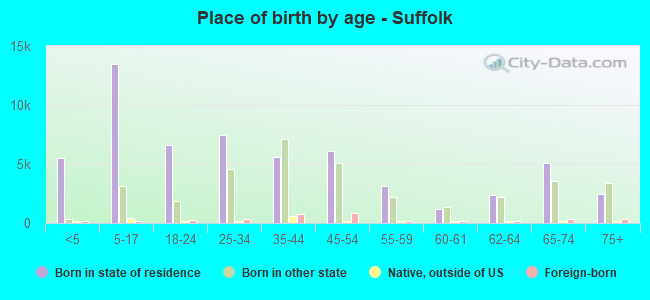
Children Nativity (place of birth) in Suffolk
Children under 6 years - Living with two parents Both parents native 3,522 100.0% Native1 0.0% Foreign-bornBoth parents foreign-born 74 41.0% Native106 59.0% Foreign-bornOne native, one foreign-born parent 381 100.0% NativeChildren under 6 years - Living with one parent Native parent 2,568 99.6% Native10 0.4% Foreign-bornForeign-born parent 144 95.7% Native6 4.3% Foreign-bornChildren 6 to 17 years - Living with two parents Both parents native 8,460 99.3% Native58 0.7% Foreign-bornBoth parents foreign-born 188 74.3% Native65 25.7% Foreign-bornOne native, one foreign-born parent 477 100.0% NativeChildren 6 to 17 years - Living with one parent Native parent 4,909 100.0% NativeForeign-born parent 285 64.9% Native154 35.1% Foreign-born
Grandparents responsible for own grandchildren in Suffolk
Grandparents (30 to 59 years) White / Caucasian 74 27.6% Responsible for grandchildren194 72.4% Not responsible for grandchildrenBlack or African American 75 26.2% Responsible for grandchildren212 73.8% Not responsible for grandchildrenAmerican Indian / Alaska Native 30 47.1% Responsible for grandchildren33 52.9% Not responsible for grandchildrenTwo or more races 13 20.0% Responsible for grandchildren52 80.0% Not responsible for grandchildrenWhite alone, not Hispanic / Latino 75 25.8% Responsible for grandchildren216 74.2% Not responsible for grandchildrenHispanic or Latino 55 54.5% Responsible for grandchildren46 45.5% Not responsible for grandchildrenGrandparents (60 years and over) White / Caucasian 62 12.8% Responsible for grandchildren418 87.2% Not responsible for grandchildrenBlack or African American 222 38.5% Responsible for grandchildren355 61.5% Not responsible for grandchildrenTwo or more races 9 27.2% Responsible for grandchildren24 72.8% Not responsible for grandchildrenWhite alone, not Hispanic / Latino 62 12.4% Responsible for grandchildren442 87.6% Not responsible for grandchildrenHispanic or Latino 14 100.0% Not responsible for grandchildren