St. Cloud, MN (Minnesota) Houses and Residents
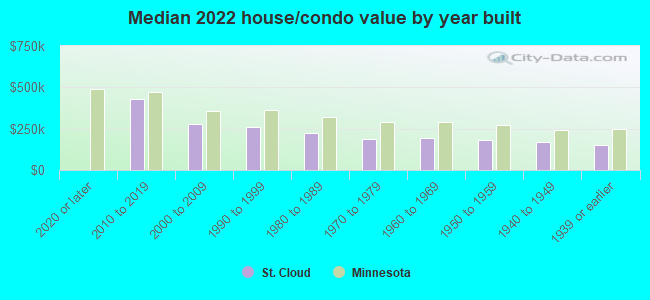
| St. Cloud: | $213,700 |
| Minnesota: | $314,600 |
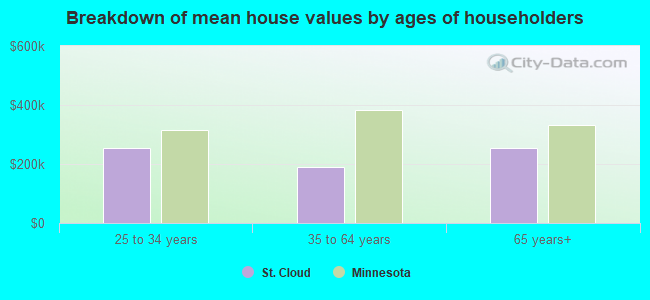
Mean price in 2022:
Detached houses: $238,978
Here: $238,978 State: $374,552 Townhouses or other attached units: $178,294
Here: $178,294 State: $312,049 In 2-unit structures: $175,467
Here: $175,467 State: $323,045 In 3-to-4-unit structures: $198,189
Here: $198,189 State: $238,971 In 5-or-more-unit structures: $122,135
Here: $122,135 State: $258,516 Mobile homes: $22,204
Here: $22,204 State: $94,605
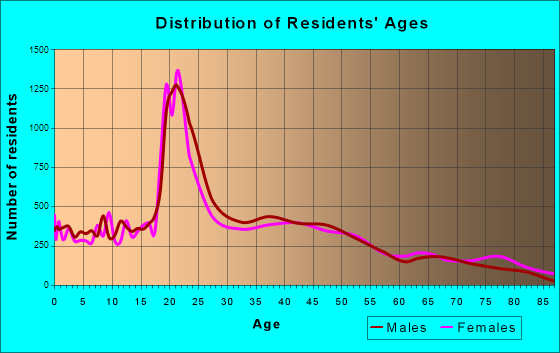
Total population: 66,389 (Urban population: 58,007, Rural population: 971 (all nonfarm))
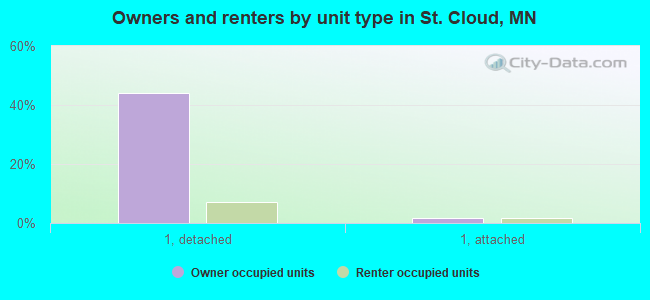
Houses: 28,756 (27,401 occupied: 14,432 owner occupied, 12,969 renter occupied)
| % of renters here: | 47% |
| State: | 28% |
Housing density: 954 houses/condos per square mile
Median price asked for vacant for-sale houses and condos in 2022: $254,038.
Median contract rent in 2022: $927 (lower quartile is $692, upper quartile is $1,252)
Median rent asked for vacant for-rent units in 2022: $893
Median gross rent in St. Cloud, MN in 2022: $997
Housing units in St. Cloud with a mortgage: 8,973 (885 second mortgage, 32 home equity loan, 679 both second mortgage and home equity loan)
Houses without a mortgage: 78
Median household income for houses/condos with a mortgage: $79,923
Median household income for apartments without a mortgage: $60,843
Median monthly housing costs: $1,060
Compare current foreclosures near St. Cloud, MN:
| Photo | Address | Area | Beds / Baths | Price | Details |
|---|---|---|---|---|---|

|
#1
18th Ave S
Saint Cloud, MN 56301
|
1,854 sq. feet
|
1 baths 2 beds |
$90,900
|
show details |

|
#2
32nd Ave N
Saint Cloud, MN 56303
|
1,096 sq. feet
|
1 baths 3 beds |
show details | |

|
#3
29th Ave N
Saint Cloud, MN 56303
|
936 sq. feet
|
2 baths 3 beds |
show details | |

|
#4
Central Ave S
Saint Stephen, MN 56375
|
1,040 sq. feet
|
1 baths 3 beds |
show details | |

|
#5
Nw18th St
Sauk Rapids, MN 56379
|
1,534 sq. feet
|
2 baths 3 beds |
show details | |

|
#6
County Road 1
Sartell, MN 56377
|
1,615 sq. feet
|
1 baths 2 beds |
show details | |

|
#7
16th St S
Saint Cloud, MN 56301
|
1,008 sq. feet
|
2 baths 3 beds |
show details | |

|
#8
Jonquil Rd NE
Foley, MN 56329
|
1,120 sq. feet
|
2 baths 3 beds |
show details | |

|
#9
4th St N
Sartell, MN 56377
|
1,616 sq. feet
|
2 baths 4 beds |
show details | |

|
#10
Park Dr
Saint Cloud, MN 56303
|
1,280 sq. feet
|
1 baths 2 beds |
show details |
| Photo | Address | Area | Beds / Baths | Price | Details |
|---|---|---|---|---|---|

|
#11
2nd St SE
Saint Cloud, MN 56304
|
- sq. feet
|
1 baths 2 beds |
show details | |

|
#12
7th Ave N
Sauk Rapids, MN 56379
|
936 sq. feet
|
1 baths 2 beds |
show details | |

|
#13
Sunwood Park Dr
Waite Park, MN 56387
|
1,706 sq. feet
|
2 baths 4 beds |
show details | |

|
#14
2nd Ave S
Sauk Rapids, MN 56379
|
782 sq. feet
|
1 baths 3 beds |
show details | |

|
#15
W Birch St
Saint Joseph, MN 56374
|
1,123 sq. feet
|
1 baths 2 beds |
show details | |

|
#16
43rd Ave
Saint Cloud, MN 56301
|
1,867 sq. feet
|
2 baths 4 beds |
show details | |

|
#17
Highway 95 NE
Sauk Rapids, MN 56379
|
1,344 sq. feet
|
1 baths 3 beds |
show details | |

|
#18
11th Ave N
Waite Park, MN 56387
|
1,397 sq. feet
|
2 baths 3 beds |
show details | |

|
#19
6th Ave N
Sauk Rapids, MN 56379
|
1,112 sq. feet
|
1 baths 3 beds |
show details | |

|
#20
1st Ave NW
Rice, MN 56367
|
1,326 sq. feet
|
2 baths 3 beds |
show details |
| Photo | Address | Area | Beds / Baths | Price | Details |
|---|---|---|---|---|---|

|
#21
69th Ave
Saint Cloud, MN 56301
|
1,747 sq. feet
|
2 baths 3 beds |
show details | |

|
#22
386th St
Sartell, MN 56377
|
1,920 sq. feet
|
2 baths 4 beds |
show details | |

|
#23
30th St NE
Sauk Rapids, MN 56379
|
954 sq. feet
|
1 baths 4 beds |
show details | |

|
#24
Lakewood Shore Rd NW
Rice, MN 56367
|
1,067 sq. feet
|
1 baths 3 beds |
show details | |

|
#25
E Able St
Saint Joseph, MN 56374
|
1,932 sq. feet
|
2 baths 4 beds |
show details | |

|
#26
4th Ave E
Sartell, MN 56377
|
904 sq. feet
|
1 baths 2 beds |
show details | |

|
#27
Broadway Ave S
Sauk Rapids, MN 56379
|
1,652 sq. feet
|
1 baths 3 beds |
show details | |

|
#28
Summit Ave S
Sauk Rapids, MN 56379
|
900 sq. feet
|
1 baths 3 beds |
show details | |

|
#29
17th Ave SE
Saint Joseph, MN 56374
|
1,470 sq. feet
|
2 baths 3 beds |
show details | |

|
#30
3rd Ave S
Sauk Rapids, MN 56379
|
934 sq. feet
|
1 baths 3 beds |
show details |
| Photo | Address | Area | Beds / Baths | Price | Details |
|---|---|---|---|---|---|

|
#31
20th Ave N
Sartell, MN 56377
|
2,052 sq. feet
|
3 baths 4 beds |
show details | |

|
#32
20th Ave N
Sartell, MN 56377
|
2,083 sq. feet
|
2 baths 4 beds |
show details | |

|
#33
2nd Ave S
Sauk Rapids, MN 56379
|
1,042 sq. feet
|
1 baths 3 beds |
show details | |

|
#34
4th Ave N
Sartell, MN 56377
|
1,768 sq. feet
|
2 baths 4 beds |
show details | |

|
#35
7th Ave N
Waite Park, MN 56387
|
1,940 sq. feet
|
2 baths 4 beds |
show details | |

|
#36
4th St N
Sartell, MN 56377
|
1,778 sq. feet
|
2 baths 4 beds |
show details | |

|
#37
7th Ave SE
Saint Joseph, MN 56374
|
1,373 sq. feet
|
2 baths 3 beds |
show details | |

|
#38
2nd St S
Sauk Rapids, MN 56379
|
936 sq. feet
|
2 baths 3 beds |
show details | |

|
#39
5th Ave N
Sartell, MN 56377
|
1,872 sq. feet
|
2 baths 2 beds |
show details | |

|
#40
2nd Ave NE
Saint Joseph, MN 56374
|
1,454 sq. feet
|
1 baths 2 beds |
show details |
| Photo | Address | Area | Beds / Baths | Price | Details |
|---|---|---|---|---|---|

|
#41
7th Ave N
Sartell, MN 56377
|
1,382 sq. feet
|
2 baths 3 beds |
show details | |

|
#42
65th Ave NE
Sauk Rapids, MN 56379
|
1,831 sq. feet
|
1 baths 1 beds |
show details | |

|
#43
5 1/2 St NE
Saint Stephen, MN 56375
|
2,465 sq. feet
|
2 baths 3 beds |
show details | |

|
#44
7th Ave NE
Saint Stephen, MN 56375
|
1,367 sq. feet
|
2 baths 4 beds |
show details | |

|
#45
Flagstone Ct
Cold Spring, MN 56320
|
1,795 sq. feet
|
2 baths 3 beds |
show details | |

|
#46
Sunwood Park Ln
Waite Park, MN 56387
|
1,998 sq. feet
|
2 baths 3 beds |
show details | |

|
#47
6th Ave N
Cold Spring, MN 56320
|
1,603 sq. feet
|
1 baths 3 beds |
show details | |

|
#48
Balsam Dr
Foley, MN 56329
|
864 sq. feet
|
2 baths 3 beds |
show details | |

|
#49
7th Ave N
Sauk Rapids, MN 56379
|
1,120 sq. feet
|
2 baths 3 beds |
show details | |

|
Check over 1 million property listings on Foreclosure.com!
|
browse all offers | |||


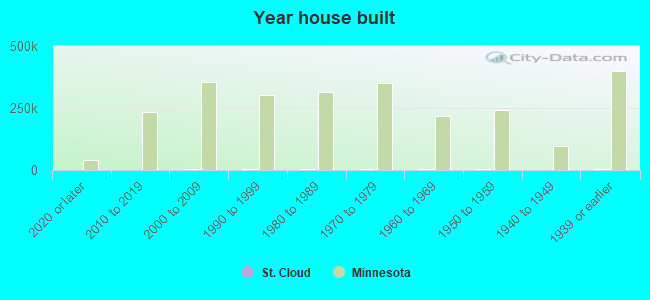
Median year apartment built: 1982
Household type by relationship:
Households: 69,813- Male householders: 13,874 (4,521 living alone), Female householders: 13,527 (5,519 living alone)
9,763 spouses (9,557 opposite-sex spouses), 2,618 unmarried partners, (2,490 opposite-sex unmarried partners), 17,066 children (15,606 natural, 888 adopted, 572 stepchildren), 346 grandchildren, 1,476 brothers or sisters, 877 parents, 0 foster children, 1,956 other relatives, 3,968 non-relatives
- In group quarters: 4,342
Size of family households: 6,758 2-persons, 2,752 3-persons, 1,928 4-persons, 1,477 5-persons, 774 6-persons, 565 7-or-more-persons.
Size of nonfamily households: 10,040 1-person, 1,713 2-persons, 630 3-persons, 541 4-persons, 146 5-persons, 77 6-persons.
6,766 married couples with children.
7,362 single-parent households (3,460 men, 3,902 women).
82.0% of residents of St. Cloud speak English at home.
3.1% of residents speak Spanish at home (82% speak English very well, 14% speak English well, 4% speak English not well).
2.1% of residents speak other Indo-European language at home (72% speak English very well, 26% speak English well, 2% don't speak English at all).
2.6% of residents speak Asian or Pacific Island language at home (54% speak English very well, 16% speak English well, 26% speak English not well, 4% don't speak English at all).
10.8% of residents speak other language at home (62% speak English very well, 19% speak English well, 15% speak English not well, 5% don't speak English at all).
Foreign born population: 11,003 (15.8%)
(55.3% of them are naturalized citizens)
| Here: | 7.4 |
| State: | 7.1 |
| Here: | 3.9 |
| State: | 3.8 |
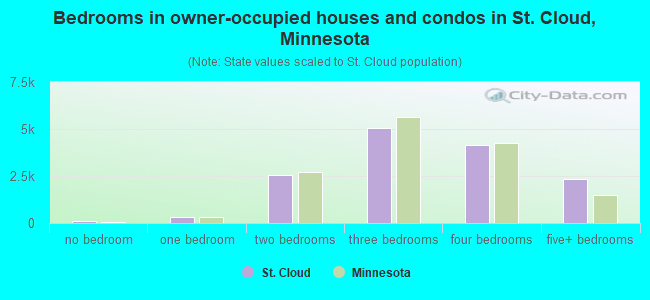
- Bedrooms in owner-occupied houses and condos in St. Cloud, Minnesota
- 94no bedroom
- 2961 bedroom
- 2,5682 bedrooms
- 5,0343 bedrooms
- 4,1254 bedrooms
- 2,3155+ bedrooms
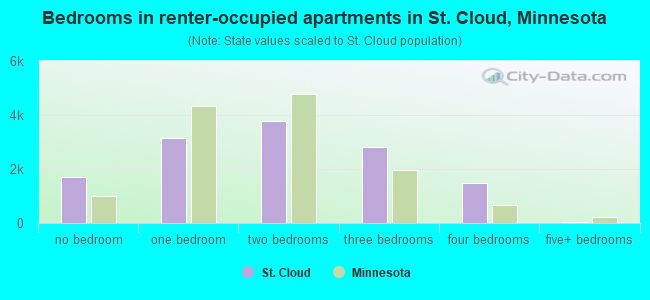
- Bedrooms in renter-occupied apartments in St. Cloud, Minnesota
- 1,717no bedroom
- 3,1361 bedroom
- 3,7782 bedrooms
- 2,8153 bedrooms
- 1,4734 bedrooms
- 505+ bedrooms
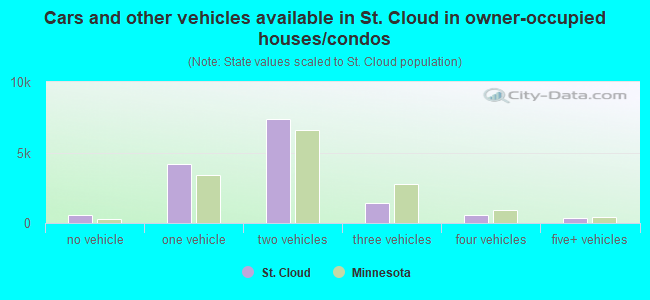
- Cars and other vehicles available in St. Cloud in owner-occupied houses/condos
- 558no vehicle
- 4,2151 vehicle
- 7,3922 vehicles
- 1,3843 vehicles
- 5474 vehicles
- 3365+ vehicles
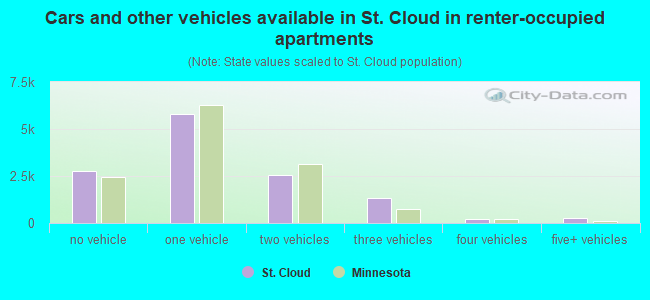
- Cars and other vehicles available in St. Cloud in renter-occupied apartments
- 2,784no vehicle
- 5,7901 vehicle
- 2,5762 vehicles
- 1,3563 vehicles
- 2044 vehicles
- 2595+ vehicles
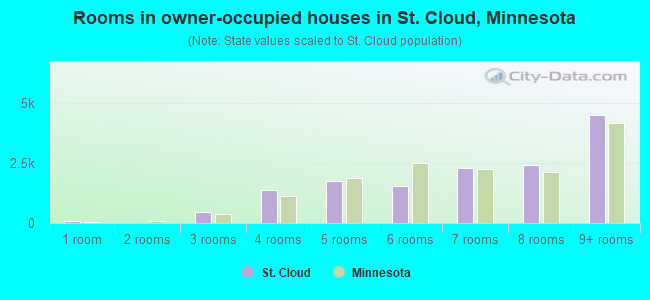
- Rooms in owner-occupied houses in St. Cloud, Minnesota
- 941 room
- 02 rooms
- 4463 rooms
- 1,3794 rooms
- 1,7625 rooms
- 1,5266 rooms
- 2,3057 rooms
- 2,4308 rooms
- 4,4909+ rooms
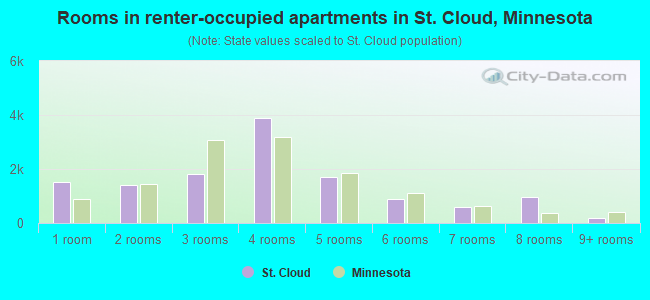
- Rooms in renter-occupied apartments in St. Cloud, Minnesota
- 1,5161 room
- 1,4232 rooms
- 1,8013 rooms
- 3,8834 rooms
- 1,7035 rooms
- 8776 rooms
- 6057 rooms
- 9808 rooms
- 1819+ rooms
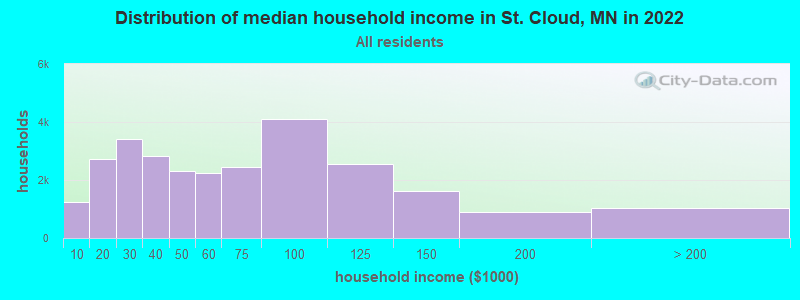
St. Cloud, MN household income distribution

- 1,248Less than $10,000
- 2,730$10,000 to $19,999
- 3,397$20,000 to $29,999
- 2,830$30,000 to $39,999
- 2,298$40,000 to $49,999
- 2,258$50,000 to $59,999
- 2,462$60,000 to $74,999
- 4,088$75,000 to $99,999
- 2,541$100,000 to $124,999
- 1,608$125,000 to $149,999
- 905$150,000 to $199,999
- 1,036$200,000 or more
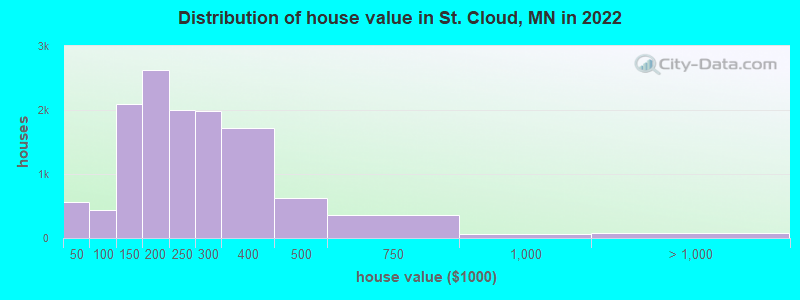
Home value of owner - occupied houses in 2022 in St. Cloud, MN
-
- 157Less than $10,000
- 54$10,000 to $14,999
- 124$15,000 to $19,999
- 101$25,000 to $29,999
- 14$30,000 to $34,999
- 9$35,000 to $39,999
- 95$40,000 to $49,999
- 45$50,000 to $59,999
- 37$60,000 to $69,999
- 110$70,000 to $79,999
- 53$80,000 to $89,999
- 98$90,000 to $99,999
- 931$100,000 to $124,999
- 1,153$125,000 to $149,999
- 1,620$150,000 to $174,999
- 1,003$175,000 to $199,999
- 2,001$200,000 to $249,999
- 1,981$250,000 to $299,999
- 1,712$300,000 to $399,999
- 629$400,000 to $499,999
- 354$500,000 to $749,999
- 54$750,000 to $999,999
- 53$1,000,000 to $1,499,999
- 19$2,000,000 or more
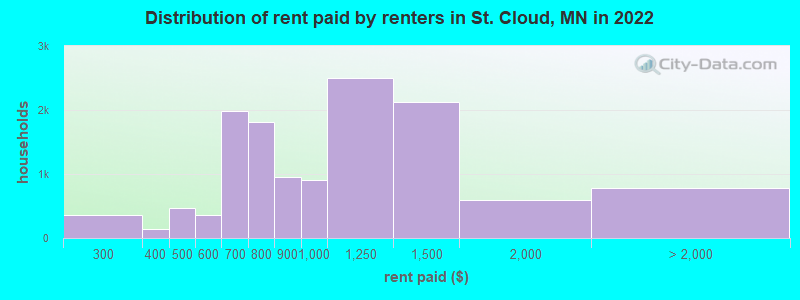
Rent paid by renters in 2022 in St. Cloud, MN
-
- 200$200 to $249
- 155$250 to $299
- 69$300 to $349
- 67$350 to $399
- 163$400 to $449
- 303$450 to $499
- 284$500 to $549
- 77$550 to $599
- 1,111$600 to $649
- 872$650 to $699
- 1,267$700 to $749
- 548$750 to $799
- 956$800 to $899
- 899$900 to $999
- 2,501$1,000 to $1,249
- 2,130$1,250 to $1,499
- 588$1,500 to $1,999
- 464$2,000 to $2,499
- 315No cash rent
Percentage of workers working in this county: 71.5%
Number of people working at home: 2,987 (8.5% of all workers)
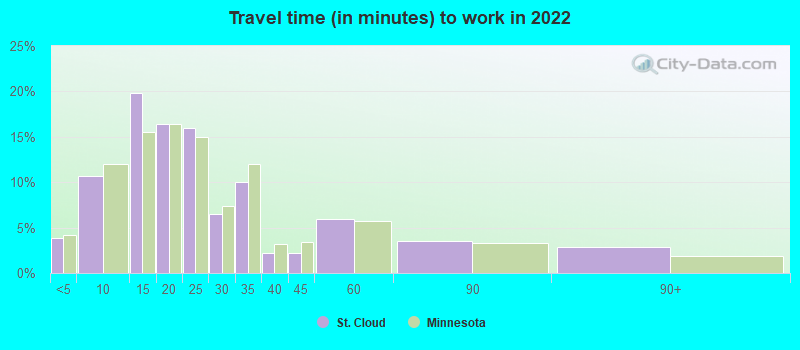
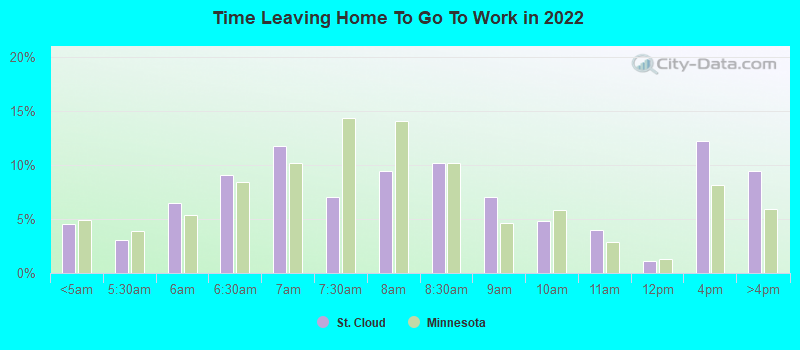
Travel time to work (commute)
- Less than 5 minutes: 1,834
- 5 to 9 minutes: 4,747
- 10 to 14 minutes: 7,286
- 15 to 19 minutes: 6,517
- 20 to 24 minutes: 4,097
- 25 to 29 minutes: 501
- 30 to 34 minutes: 1,744
- 35 to 39 minutes: 220
- 40 to 44 minutes: 640
- 45 to 59 minutes: 770
- 60 to 89 minutes: 388
- 90 or more minutes: 1,084
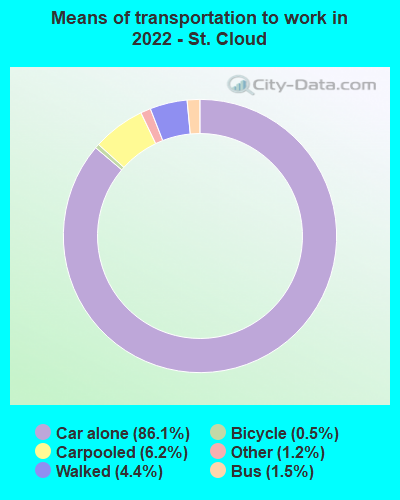
Means of transportation to work:
- Drove a car alone: 41,009 (81.1%)
- Carpooled: 2,405 (4.8%)
- Bus: 706 (1.4%)
- Subway or elevated rail: 7 (0.0%)
- Long-distance train or commuter rail: 4 (0.0%)
- Light rail, streetcar or trolley: 5 (0.0%)
- Ferryboat: 5 (0.0%)
- Taxi: 709 (1.4%)
- Bicycle: 293 (0.6%)
- Walked: 2,203 (4.4%)
- Worked at home: 2,987 (5.9%)
- Unemployment by race in 2022
- Unemployment rate for White non-Hispanic residents
- 1.5%Males
- 3.7%Females
- Unemployment rate for Black residents
- 10.6%Males
- 18.0%Females
- Unemployment rate for American Indian and Alaska Native residents
- 33.5%Females
- Unemployment rate for Asian residents
- 4.7%Males
- 4.8%Females
- Unemployment rate for other race residents
- 2.3%Females
- Unemployment rate for two or more race residents
- 1.6%Males
- 3.7%Females
- Unemployment rate for Hispanic or Latino residents
- 2.1%Males
- 10.2%Females
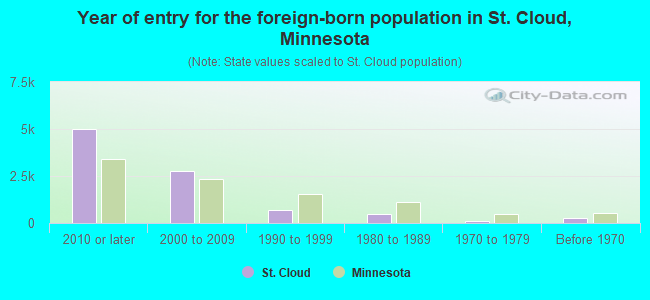
- Year of entry for the foreign-born population in St. Cloud, Minnesota
- 4,9912010 or later
- 2,7632000 to 2009
- 7031990 to 1999
- 5051980 to 1989
- 1251970 to 1979
- 254Before 1970
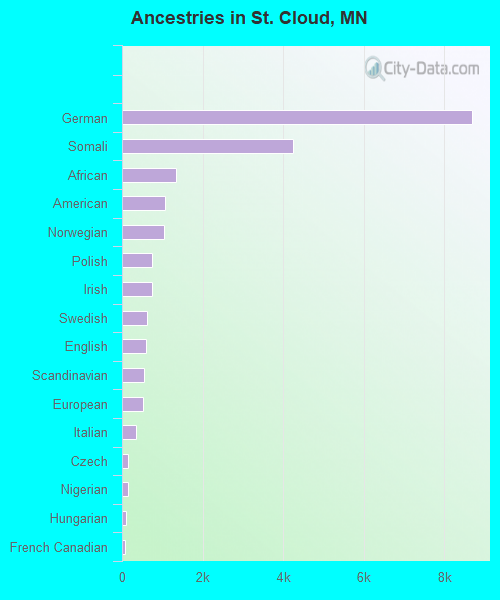
First ancestries reported:
- German: 8,678 (30.5%)
- Somali: 4,244 (14.9%)
- African: 1,351 (4.7%)
- American: 1,058 (3.7%)
- Norwegian: 1,051 (3.7%)
- Polish: 754 (2.7%)
- Irish: 740 (2.6%)
- Swedish: 623 (2.2%)
- English: 603 (2.1%)
- Scandinavian: 534 (1.9%)
- European: 509 (1.8%)
- Italian: 360 (1.3%)
- Czech: 157 (0.6%)
- Nigerian: 141 (0.5%)
- Hungarian: 106 (0.4%)
- French Canadian: 80 (0.3%)
- Northern European: 75 (0.3%)
- Canadian: 67 (0.2%)
- French: 64 (0.2%)
- Danish: 62 (0.2%)
- Arab: 61 (0.2%)
- Finnish: 60 (0.2%)
- Yugoslavian: 51 (0.2%)
- Bulgarian: 40 (0.1%)
- Dutch: 38 (0.1%)
- Lebanese: 37 (0.1%)
- Lithuanian: 37 (0.1%)
- Sudanese: 36 (0.1%)
- Ukrainian: 34 (0.1%)
- Croatian: 33 (0.1%)
- Greek: 32 (0.1%)
- Scotch-Irish: 32 (0.1%)
- Liberian: 32 (0.1%)
- Scottish: 31 (0.1%)
- Ethiopian: 29 (0.1%)
- Jamaican: 20 (0.07%)
- Romanian: 16 (0.06%)
- Haitian: 13 (0.05%)
- British: 12 (0.04%)
- Austrian: 12 (0.04%)
- Russian: 12 (0.04%)
- Belgian: 11 (0.04%)
- Eastern European: 10 (0.04%)
- Cape Verdean: 9 (0.03%)
- Albanian: 9 (0.03%)
- Trinidadian and Tobagonian: 9 (0.03%)
- Luxembourger: 8 (0.03%)
- Czechoslovakian: 8 (0.03%)
- West Indian: 7 (0.02%)
- Slovene: 6 (0.02%)
- Senegalese: 6 (0.02%)
- Bahamian: 6 (0.02%)
- Dutch West Indian: 5 (0.02%)
- Welsh: 5 (0.02%)
- Slovak: 4 (0.01%)
- Celtic: 4 (0.01%)
- Ghanaian: 4 (0.01%)
- Egyptian: 4 (0.01%)
- Ugandan: 3 (0.01%)
Most common places of birth for foreign-born residents (%):
| St. Cloud: | 32.5% (2,856) |
| Minnesota: | 8.0% (38,461) |
| St. Cloud: | 16.3% (1,437) |
| Minnesota: | 3.3% (15,701) |
| St. Cloud: | 6.3% (552) |
| Minnesota: | 3.8% (18,442) |
| St. Cloud: | 5.2% (460) |
| Minnesota: | 12.1% (58,312) |
| St. Cloud: | 4.9% (428) |
| Minnesota: | 0.6% (3,113) |
| St. Cloud: | 4.3% (375) |
| Minnesota: | 5.1% (24,630) |
| St. Cloud: | 3.5% (310) |
| Minnesota: | 0.5% (2,291) |
| St. Cloud: | 3.4% (303) |
| Minnesota: | 1.7% (8,263) |
| St. Cloud: | 2.2% (194) |
| Minnesota: | 0.6% (3,038) |
| St. Cloud: | 2.1% (186) |
| Minnesota: | 5.1% (24,591) |
| St. Cloud: | 2.0% (173) |
| Minnesota: | 0.3% (1,547) |
| St. Cloud: | 1.8% (157) |
| Minnesota: | 0.2% (966) |
Place of birth for U.S.-born residents:
- This state: 46,135
- Other state: 11,887
- Northeast: 1,504
- Midwest: 6,934
- South: 1,033
- West: 2,416
75.2% of St. Cloud residents lived in the same house 1 years ago.
Out of people who lived in different houses, 31.7% lived in this county.
Out of people who lived in different counties, 91.0% lived in Minnesota.
| St. Cloud: | 75.2% |
| State average: | 87.4% |
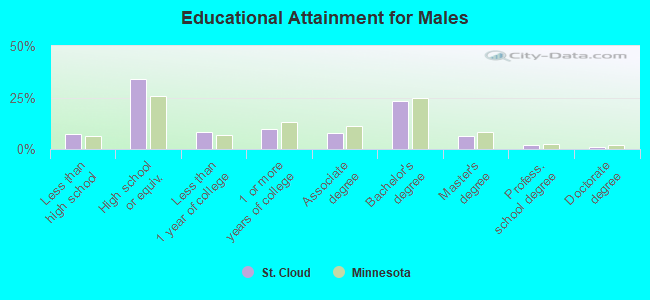
Education attainment for males 25 years and older:
- No schooling: 392
- Nursery to 4th grade: 65
- 5th and 6th grade: 4
- 7th and 8th grade: 125
- 9th grade: 134
- 10th grade: 217
- 11th grade: 100
- 12th grade, no diploma: 562
- High school graduate (or equivalency): 7,288
- Less than 1 year of college: 1,824
- Some college more than 1 year, no degree: 2,124
- Associate degree: 1,664
- Bachelor's degree: 4,986
- Master's degree: 1,391
- Professional school degree: 396
- Doctorate degree: 221
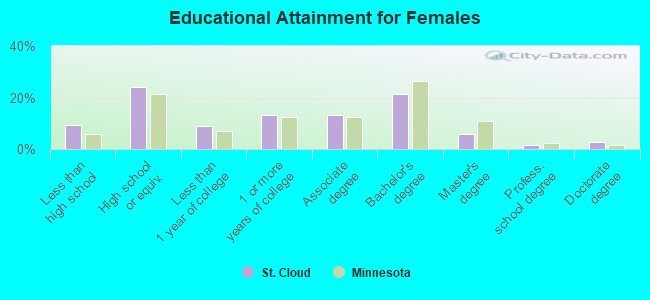
Education attainment for females 25 years and older:
- No schooling: 830
- Nursery to 4th grade: 213
- 5th and 6th grade: 472
- 7th and 8th grade: 20
- 9th grade: 0
- 10th grade: 24
- 11th grade: 0
- 12th grade, no diploma: 314
- High school graduate (or equivalency): 4,862
- Less than 1 year of college: 1,825
- Some college more than 1 year, no degree: 2,675
- Associate degree: 2,632
- Bachelor's degree: 4,289
- Master's degree: 1,155
- Professional school degree: 342
- Doctorate degree: 560
Housing units in structures:
- One, detached: 15,798
- One, attached: 1,479
- Two: 584
- 3 or 4: 982
- 5 to 9: 720
- 10 to 19: 2,401
- 20 to 49: 2,354
- 50 or more: 3,869
- Mobile homes: 569
Housing units lacking complete kitchen facilities in 2022: 1.2%
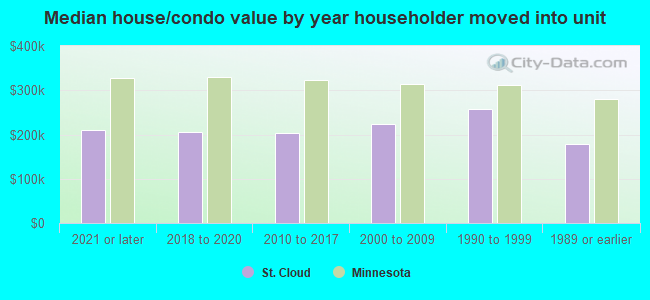
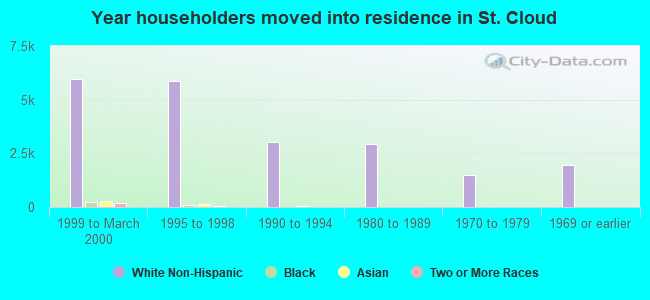
House/condo owner moved in on average 9 years ago
Renter moved in on average 2 years ago
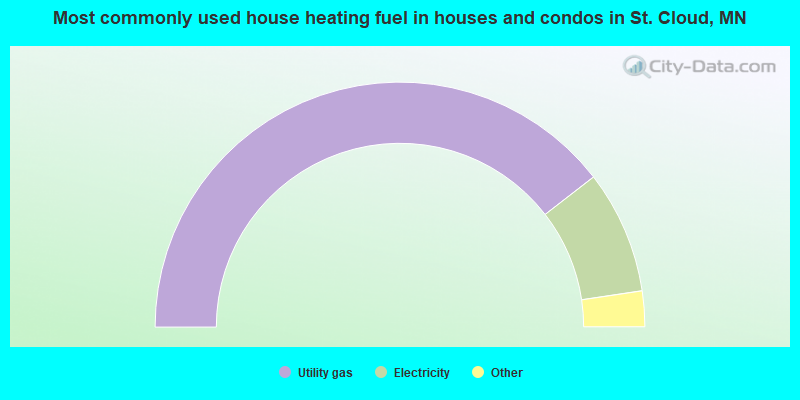
- 79.1%Utility gas
- 16.3%Electricity
- 2.1%Bottled, tank, or LP gas
- 1.8%Fuel oil, kerosene, etc.
- 0.5%Wood
- 0.2%Other fuel
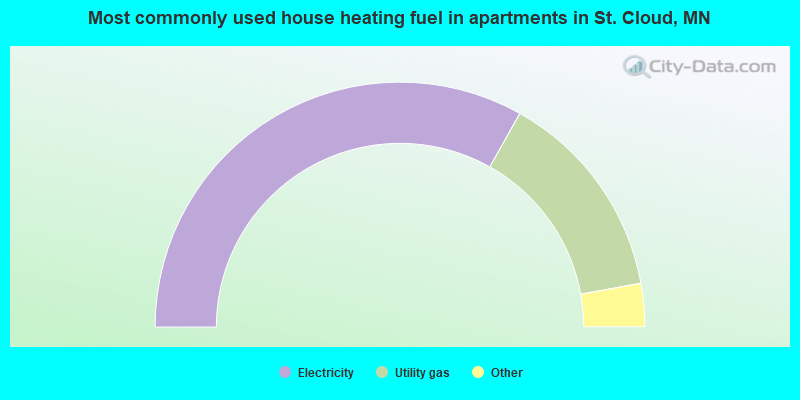
- 66.3%Electricity
- 28.0%Utility gas
- 2.2%Other fuel
- 1.8%No fuel used
- 1.6%Bottled, tank, or LP gas
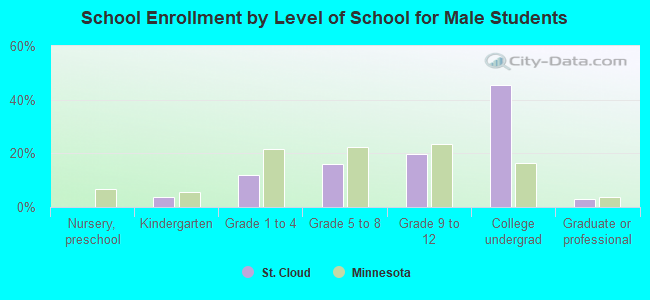
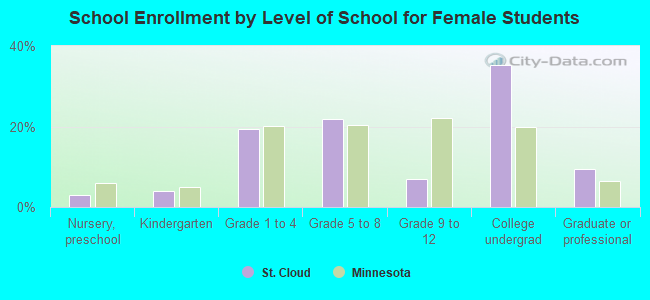
Private vs. public school enrollment:
| Here: | 3.9% |
| Minnesota: | 12.9% |
| Here: | 13.0% |
| Minnesota: | 8.6% |
| Here: | 33.0% |
| Minnesota: | 26.2% |