Races in St. Cloud, Minnesota (MN) Detailed Stats
Data:
Races - White alone (%)
Races - White alone (% change since 2000)
Races - Black alone (%)
Races - Black alone (% change since 2000)
Races - American Indian alone (%)
Races - American Indian alone (% change since 2000)
Races - Asian alone (%)
Races - Asian alone (% change since 2000)
Races - Hispanic (%)
Races - Hispanic (% change since 2000)
Races - Native Hawaiian and Other Pacific Islander alone (%)
Races - Native Hawaiian and Other Pacific Islander alone (% change since 2000)
Races - Two or more races(%)
Races - Two or more races(% change since 2000)
Races - Other race alone (%)
Races - Other race alone (% change since 2000)
Racial diversity
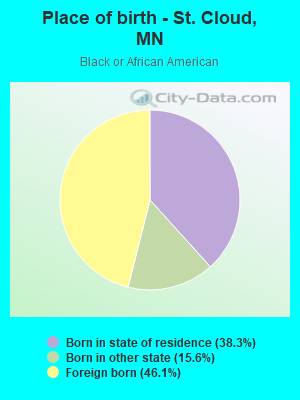
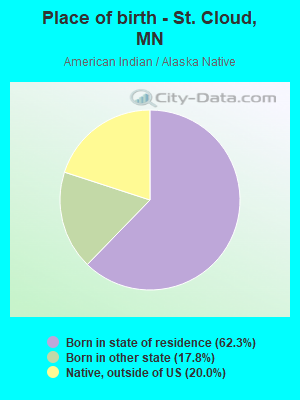
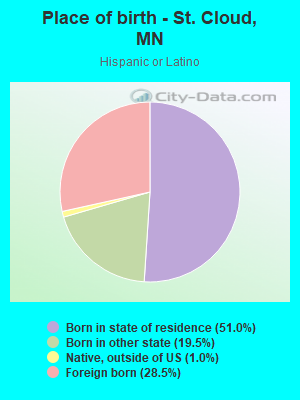
Place of birth - Born in state of residence (%)
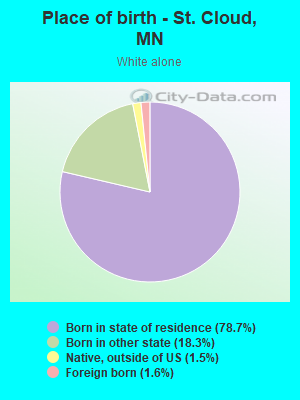
Place of birth - Born in state of residence (%) - White
Place of birth - Born in state of residence (%) - Black or African American
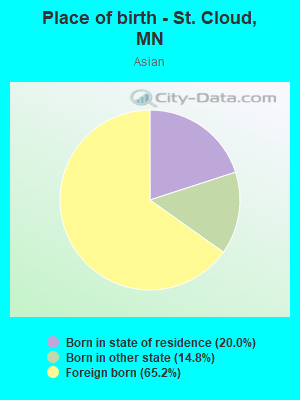
Place of birth - Born in state of residence (%) - Asian
Place of birth - Born in state of residence (%) - Hispanic or Latino
Place of birth - Born in state of residence (%) - American Indian and Alaska Native
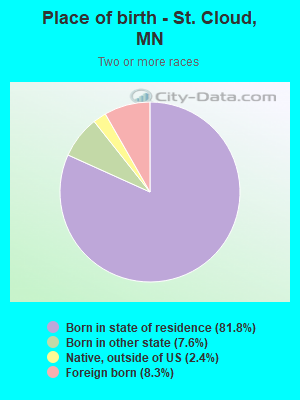
Place of birth - Born in state of residence (%) - Multirace
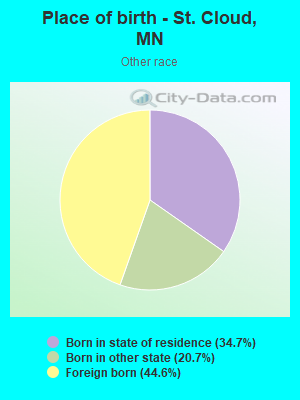
Place of birth - Born in state of residence (%) - Other Race
Place of birth - Born in other state (%)
Place of birth - Born in other state (%) - White
Place of birth - Born in other state (%) - Black or African American
Place of birth - Born in other state (%) - Asian
Place of birth - Born in other state (%) - Hispanic or Latino
Place of birth - Born in other state (%) - American Indian and Alaska Native
Place of birth - Born in other state (%) - Multirace
Place of birth - Born in other state (%) - Other Race
Place of birth - Native, outside of US (%)
Place of birth - Native, outside of US (%) - White
Place of birth - Native, outside of US (%) - Black or African American
Place of birth - Native, outside of US (%) - Asian
Place of birth - Native, outside of US (%) - Hispanic or Latino
Place of birth - Native, outside of US (%) - American Indian and Alaska Native
Place of birth - Native, outside of US (%) - Multirace
Place of birth - Native, outside of US (%) - Other Race
Place of birth - Foreign born (%)
Place of birth - Foreign born (%) - White
Place of birth - Foreign born (%) - Black or African American
Place of birth - Foreign born (%) - Asian
Place of birth - Foreign born (%) - Hispanic or Latino
Place of birth - Foreign born (%) - American Indian and Alaska Native
Place of birth - Foreign born (%) - Multirace
Place of birth - Foreign born (%) - Other Race
Residents speaking English at home (%)
Residents speaking English at home - Born in the United States (%)
Residents speaking English at home - Native, born elsewhere (%)
Residents speaking English at home - Foreign born (%)
Residents speaking Spanish at home (%)
Residents speaking Spanish at home - Born in the United States (%)
Residents speaking Spanish at home - Native, born elsewhere (%)
Residents speaking Spanish at home - Foreign born (%)
Residents speaking other language at home (%)
Residents speaking other language at home - Born in the United States (%)
Residents speaking other language at home - Native, born elsewhere (%)
Residents speaking other language at home - Foreign born (%)
Marital status - Never married (%)
Marital status - Now married (%)
Marital status - Separated (%)
Marital status - Widowed (%)
Marital status - Divorced (%)
Ancestries Reported - Arab (%)
Ancestries Reported - Czech (%)
Ancestries Reported - Danish (%)
Ancestries Reported - Dutch (%)
Ancestries Reported - English (%)
Ancestries Reported - French (%)
Ancestries Reported - French Canadian (%)
Ancestries Reported - German (%)
Ancestries Reported - Greek (%)
Ancestries Reported - Hungarian (%)
Ancestries Reported - Irish (%)
Ancestries Reported - Italian (%)
Ancestries Reported - Lithuanian (%)
Ancestries Reported - Norwegian (%)
Ancestries Reported - Polish (%)
Ancestries Reported - Portuguese (%)
Ancestries Reported - Russian (%)
Ancestries Reported - Scotch-Irish (%)
Ancestries Reported - Scottish (%)
Ancestries Reported - Slovak (%)
Ancestries Reported - Subsaharan African (%)
Ancestries Reported - Swedish (%)
Ancestries Reported - Swiss (%)
Ancestries Reported - Ukrainian (%)
Ancestries Reported - United States (%)
Ancestries Reported - Welsh (%)
Ancestries Reported - West Indian (%)
Ancestries Reported - Other (%)
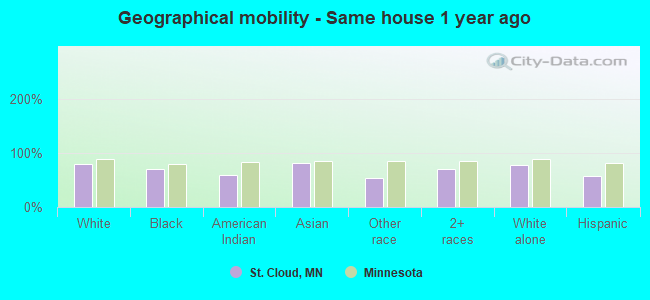
Geographical mobility - Same house 1 year ago (%)
Geographical mobility - Same house 1 year ago (%) - White
Geographical mobility - Same house 1 year ago (%) - Black or African American
Geographical mobility - Same house 1 year ago (%) - Asian
Geographical mobility - Same house 1 year ago (%) - Hispanic or Latino
Geographical mobility - Same house 1 year ago (%) - American Indian and Alaska Native
Geographical mobility - Same house 1 year ago (%) - Multirace
Geographical mobility - Same house 1 year ago (%) - Other Race
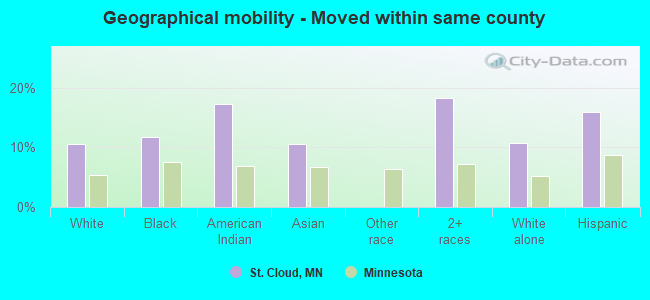
Geographical mobility - Moved within same county (%)
Geographical mobility - Moved within same county (%) - White
Geographical mobility - Moved within same county (%) - Black or African American
Geographical mobility - Moved within same county (%) - Asian
Geographical mobility - Moved within same county (%) - Hispanic or Latino
Geographical mobility - Moved within same county (%) - American Indian and Alaska Native
Geographical mobility - Moved within same county (%) - Multirace
Geographical mobility - Moved within same county (%) - Other Race
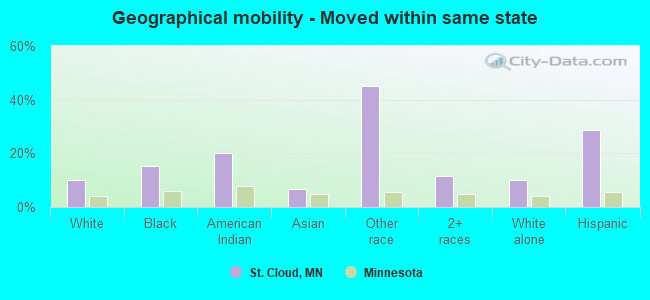
Geographical mobility - Moved from different county within same state (%)
Geographical mobility - Moved from different county within same state (%) - White
Geographical mobility - Moved from different county within same state (%) - Black or African American
Geographical mobility - Moved from different county within same state (%) - Asian
Geographical mobility - Moved from different county within same state (%) - Hispanic or Latino
Geographical mobility - Moved from different county within same state (%) - American Indian and Alaska Native
Geographical mobility - Moved from different county within same state (%) - Multirace
Geographical mobility - Moved from different county within same state (%) - Other Race
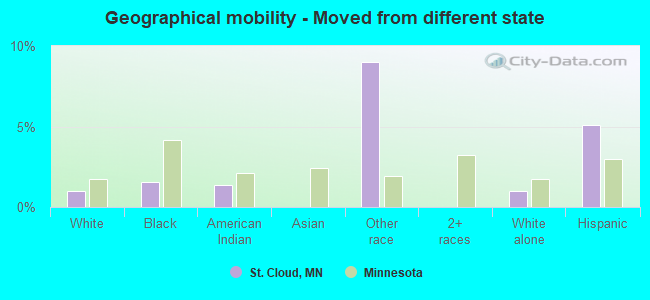
Geographical mobility - Moved from different state (%)
Geographical mobility - Moved from different state (%) - White
Geographical mobility - Moved from different state (%) - Black or African American
Geographical mobility - Moved from different state (%) - Asian
Geographical mobility - Moved from different state (%) - Hispanic or Latino
Geographical mobility - Moved from different state (%) - American Indian and Alaska Native
Geographical mobility - Moved from different state (%) - Multirace
Geographical mobility - Moved from different state (%) - Other Race
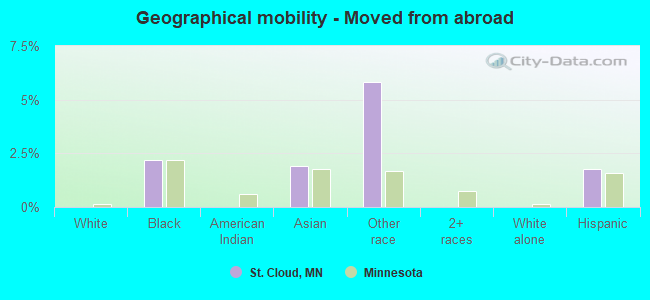
Geographical mobility - Moved from abroad (%)
Geographical mobility - Moved from abroad (%) - White
Geographical mobility - Moved from abroad (%) - Black or African American
Geographical mobility - Moved from abroad (%) - Asian
Geographical mobility - Moved from abroad (%) - Hispanic or Latino
Geographical mobility - Moved from abroad (%) - American Indian and Alaska Native
Geographical mobility - Moved from abroad (%) - Multirace
Geographical mobility - Moved from abroad (%) - Other Race
Place of birth for the foreign-born population - Ireland (%)
Place of birth for the foreign-born population - Denmark (%)
Place of birth for the foreign-born population - Norway (%)
Place of birth for the foreign-born population - Sweden (%)
Place of birth for the foreign-born population - United Kingdom (%)
Place of birth for the foreign-born population - England (%)
Place of birth for the foreign-born population - Scotland (%)
Place of birth for the foreign-born population - Other Northern Europe (%)
Place of birth for the foreign-born population - Austria (%)
Place of birth for the foreign-born population - Belgium (%)
Place of birth for the foreign-born population - France (%)
Place of birth for the foreign-born population - Germany (%)
Place of birth for the foreign-born population - Netherlands (%)
Place of birth for the foreign-born population - Switzerland (%)
Place of birth for the foreign-born population - Other Western Europe (%)
Place of birth for the foreign-born population - Greece (%)
Place of birth for the foreign-born population - Italy (%)
Place of birth for the foreign-born population - Portugal (%)
Place of birth for the foreign-born population - Spain (%)
Place of birth for the foreign-born population - Other Southern Europe (%)
Place of birth for the foreign-born population - Albania (%)
Place of birth for the foreign-born population - Belarus (%)
Place of birth for the foreign-born population - Bosnia and Herzegovina (%)
Place of birth for the foreign-born population - Bulgaria (%)
Place of birth for the foreign-born population - Croatia (%)
Place of birth for the foreign-born population - Czechoslovakia (%)
Place of birth for the foreign-born population - Hungary (%)
Place of birth for the foreign-born population - Latvia (%)
Place of birth for the foreign-born population - Lithuania (%)
Place of birth for the foreign-born population - North Macedonia (Macedonia) (%)
Place of birth for the foreign-born population - Moldova (%)
Place of birth for the foreign-born population - Poland (%)
Place of birth for the foreign-born population - Romania (%)
Place of birth for the foreign-born population - Russia (%)
Place of birth for the foreign-born population - Serbia (%)
Place of birth for the foreign-born population - Ukraine (%)
Place of birth for the foreign-born population - Other Eastern Europe (%)
Place of birth for the foreign-born population - China (%)
Place of birth for the foreign-born population - Hong Kong (%)
Place of birth for the foreign-born population - Taiwan (%)
Place of birth for the foreign-born population - Japan (%)
Place of birth for the foreign-born population - Korea (%)
Place of birth for the foreign-born population - Other Eastern Asia (%)
Place of birth for the foreign-born population - Afghanistan (%)
Place of birth for the foreign-born population - Bangladesh (%)
Place of birth for the foreign-born population - India (%)
Place of birth for the foreign-born population - Iran (%)
Place of birth for the foreign-born population - Kazakhstan (%)
Place of birth for the foreign-born population - Nepal (%)
Place of birth for the foreign-born population - Pakistan (%)
Place of birth for the foreign-born population - Sri Lanka (%)
Place of birth for the foreign-born population - Uzbekistan (%)
Place of birth for the foreign-born population - Other South Central Asia (%)
Place of birth for the foreign-born population - Burma (%)
Place of birth for the foreign-born population - Cambodia (%)
Place of birth for the foreign-born population - Indonesia (%)
Place of birth for the foreign-born population - Laos (%)
Place of birth for the foreign-born population - Malaysia (%)
Place of birth for the foreign-born population - Philippines (%)
Place of birth for the foreign-born population - Singapore (%)
Place of birth for the foreign-born population - Thailand (%)
Place of birth for the foreign-born population - Vietnam (%)
Place of birth for the foreign-born population - Other South Eastern Asia (%)
Place of birth for the foreign-born population - Armenia (%)
Place of birth for the foreign-born population - Iraq (%)
Place of birth for the foreign-born population - Israel (%)
Place of birth for the foreign-born population - Jordan (%)
Place of birth for the foreign-born population - Kuwait (%)
Place of birth for the foreign-born population - Lebanon (%)
Place of birth for the foreign-born population - Saudi Arabia (%)
Place of birth for the foreign-born population - Syria (%)
Place of birth for the foreign-born population - Turkey (%)
Place of birth for the foreign-born population - Yemen (%)
Place of birth for the foreign-born population - Other Western Asia (%)
Place of birth for the foreign-born population - Eritrea (%)
Place of birth for the foreign-born population - Ethiopia (%)
Place of birth for the foreign-born population - Kenya (%)
Place of birth for the foreign-born population - Somalia (%)
Place of birth for the foreign-born population - Uganda (%)
Place of birth for the foreign-born population - Zimbabwe (%)
Place of birth for the foreign-born population - Other Eastern Africa (%)
Place of birth for the foreign-born population - Cameroon (%)
Place of birth for the foreign-born population - Congo (%)
Place of birth for the foreign-born population - Democratic Republic of Congo (Zaire) (%)
Place of birth for the foreign-born population - Other Middle Africa (%)
Place of birth for the foreign-born population - Egypt (%)
Place of birth for the foreign-born population - Morocco (%)
Place of birth for the foreign-born population - Sudan (%)
Place of birth for the foreign-born population - Other Northern Africa (%)
Place of birth for the foreign-born population - South Africa (%)
Place of birth for the foreign-born population - Other Southern Africa (%)
Place of birth for the foreign-born population - Cabo Verde (%)
Place of birth for the foreign-born population - Ghana (%)
Place of birth for the foreign-born population - Liberia (%)
Place of birth for the foreign-born population - Nigeria (%)
Place of birth for the foreign-born population - Senegal (%)
Place of birth for the foreign-born population - Sierra Leone (%)
Place of birth for the foreign-born population - Other Western Africa (%)
Place of birth for the foreign-born population - Australia (%)
Place of birth for the foreign-born population - New Zealand (%)
Place of birth for the foreign-born population - Fiji (%)
Place of birth for the foreign-born population - Micronesia (%)
Place of birth for the foreign-born population - Bahamas (%)
Place of birth for the foreign-born population - Barbados (%)
Place of birth for the foreign-born population - Cuba (%)
Place of birth for the foreign-born population - Dominica (%)
Place of birth for the foreign-born population - Dominican Republic (%)
Place of birth for the foreign-born population - Grenada (%)
Place of birth for the foreign-born population - Haiti (%)
Place of birth for the foreign-born population - Jamaica (%)
Place of birth for the foreign-born population - St. Vincent and the Grenadines (%)
Place of birth for the foreign-born population - Trinidad and Tobago (%)
Place of birth for the foreign-born population - West Indies (%)
Place of birth for the foreign-born population - Other Caribbean (%)
Place of birth for the foreign-born population - Belize (%)
Place of birth for the foreign-born population - Costa Rica (%)
Place of birth for the foreign-born population - El Salvador (%)
Place of birth for the foreign-born population - Guatemala (%)
Place of birth for the foreign-born population - Honduras (%)
Place of birth for the foreign-born population - Mexico (%)
Place of birth for the foreign-born population - Nicaragua (%)
Place of birth for the foreign-born population - Panama (%)
Place of birth for the foreign-born population - Other Central America (%)
Place of birth for the foreign-born population - Argentina (%)
Place of birth for the foreign-born population - Bolivia (%)
Place of birth for the foreign-born population - Brazil (%)
Place of birth for the foreign-born population - Chile (%)
Place of birth for the foreign-born population - Colombia (%)
Place of birth for the foreign-born population - Ecuador (%)
Place of birth for the foreign-born population - Guyana (%)
Place of birth for the foreign-born population - Peru (%)
Place of birth for the foreign-born population - Uruguay (%)
Place of birth for the foreign-born population - Venezuela (%)
Place of birth for the foreign-born population - Other South America (%)
Place of birth for the foreign-born population - Canada (%)
Place of birth for the foreign-born population - Other Northern America (%)
Place of birth for the foreign-born population - Other (%)
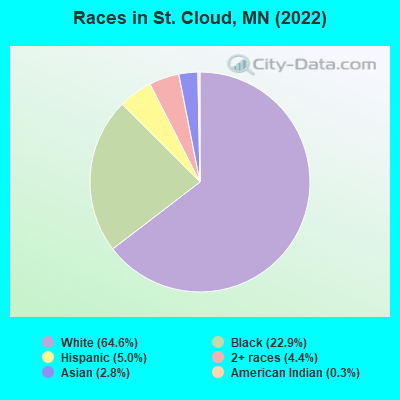
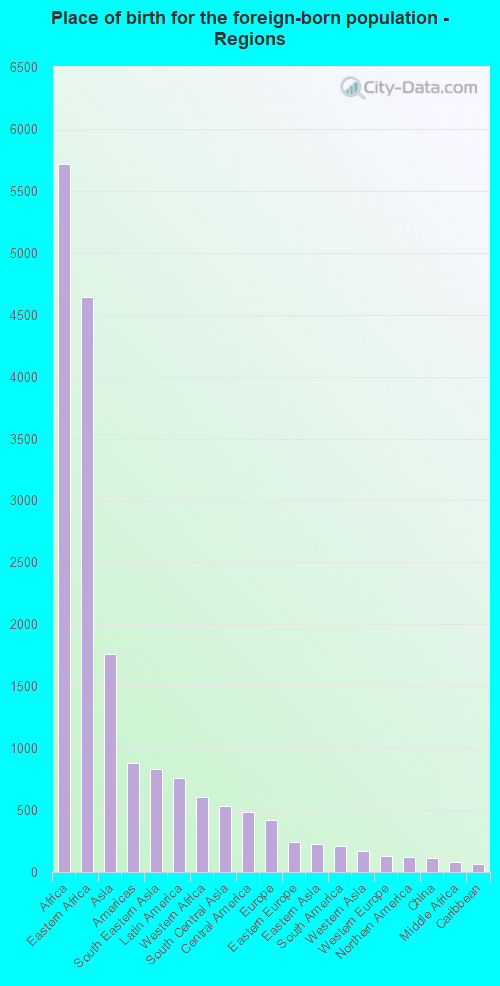
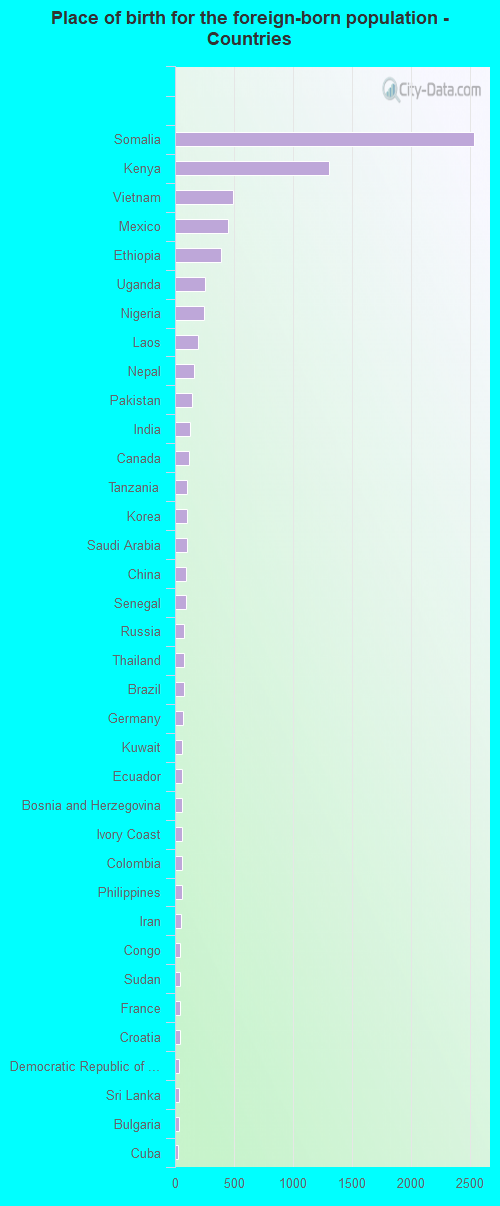
According to 2022 data, the most numerous races in St. Cloud, MN are White alone (45,082 residents), Black alone (16,014 residents), and Hispanic (3,472 residents). 78.7% of St. Cloud residents speak English at home. 12.6% of St. Cloud, MN residents are foreign-born (8.0% born in Africa, 2.5% born in Asia), which is 36.6% greater than the foreign-born rate of 8.0% across the entire state of Minnesota.
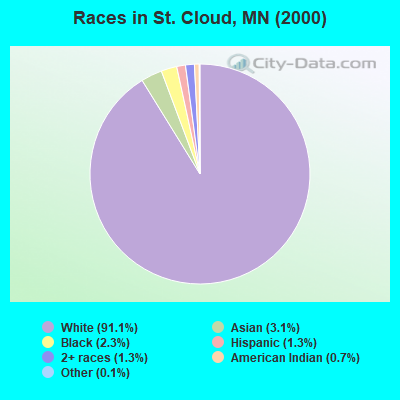
Race distribution in St. Cloud
2000 2022
4,337,143 88.2% White alone 168,813 3.4% Black alone 143,382 2.9% Hispanic 141,083 2.9% Asian alone 70,304 1.4% Two or more races 52,009 1.1% American Indian alone 5,031 0.1% Other race alone 1,714 0.03% Native Hawaiian and Other
4,356,347 76.2% White alone 395,179 6.9% Black alone 333,830 5.8% Hispanic 294,800 5.2% Asian alone 259,649 4.5% Two or more races 42,125 0.7% American Indian alone 32,976 0.6% Other race alone 2,278 0.04% Native Hawaiian and Other
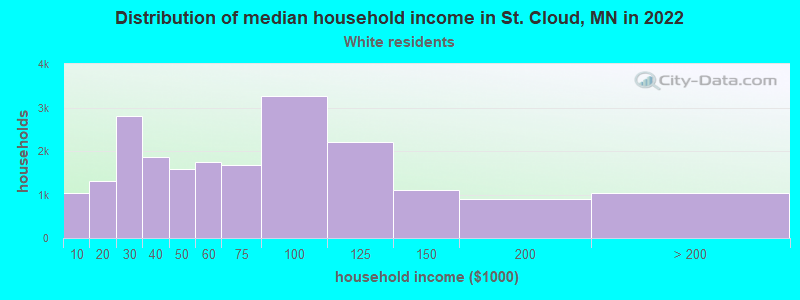
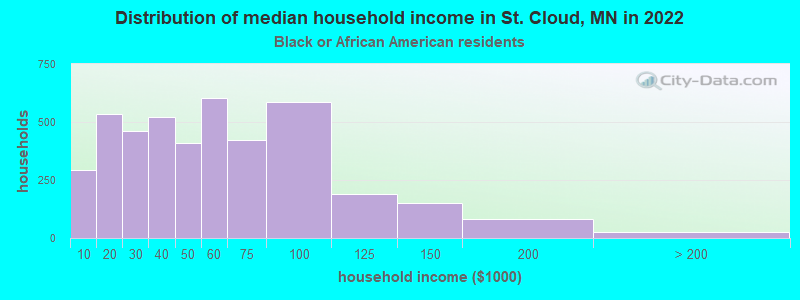
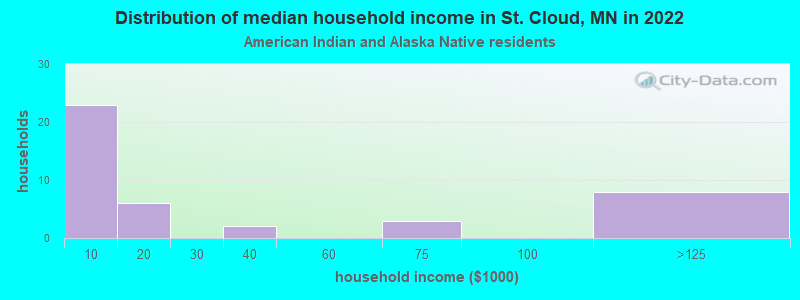
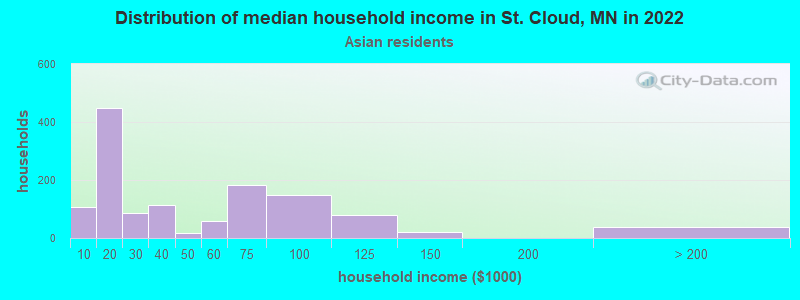
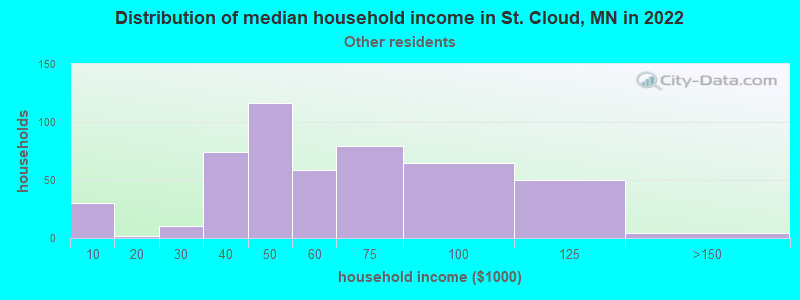
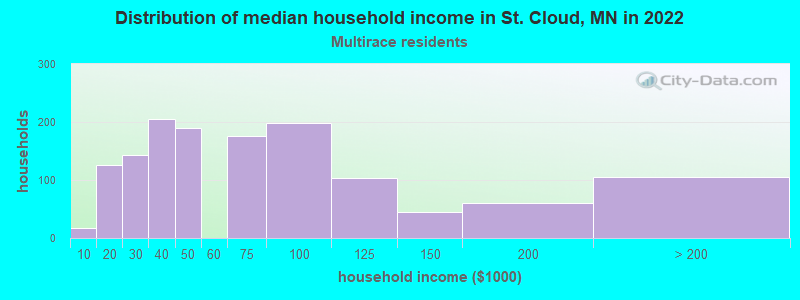
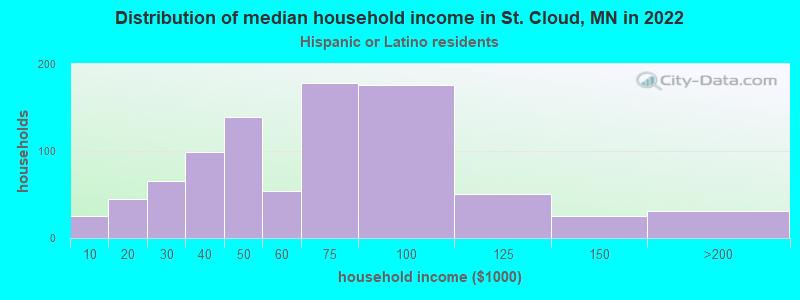
Income and house value in St. Cloud Median household income in 2022 $58,098 White non-Hispanic householders$39,335 Black householders$63,340 Asian householders$55,508 Some other race householders$42,116 Two or more races householders$71,204 Hispanic or Latino race householdersMedian 2022 house value $215,759 White Non-Hispanic householders$191,735 Black or African American householders$137,280 American Indian or Alaska Native householders $230,173 Asian householders$171,600 Some other race householders$219,877 Two or more races householders$457,601 Hispanic or Latino householders
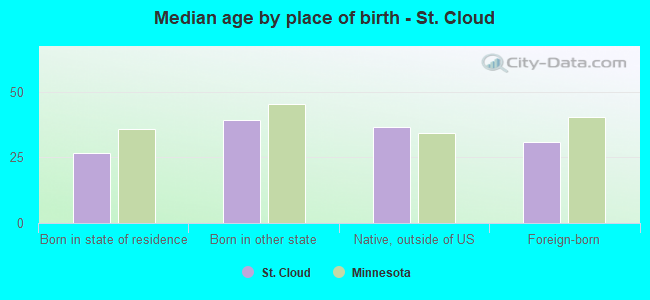
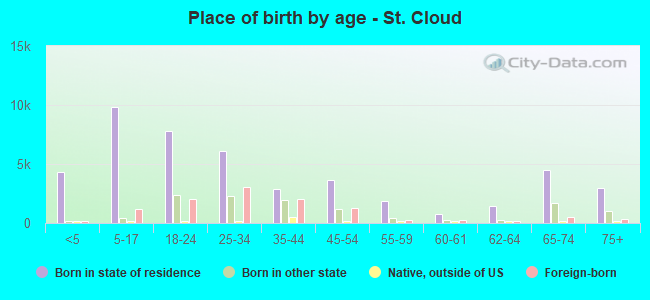
Median age by race in St. Cloud
37.3 Median age for White residents36.8 37.6 21.6 Median age for Black or African American residents21.5 21.7 19.4 Median age for American Indian / Alaska Native residents32.7 13.4 33.7 Median age for Asian residents29.2 42.5 -666,666,666.0 Median age for Native Hawaiian / Pacific Islander residents-666,666,666.0 -666,666,666.0 23.0 Median age for Other race residents22.7 20.0 15.6 Median age for Two or more races residents15.7 14.9 37.7 Median age for White alone residents38.3 37.6 18.8 Median age for Hispanic or Latino residents17.4 31.9
Owner/renter occupied households by race in St. Cloud
House owners and renters - White residents 13,235 64.4% Owner occupied7,310 35.6% Renter occupiedHouse owners and renters - Black or African American residents 460 9.3% Owner occupied4,461 90.7% Renter occupiedHouse owners and renters - American Indian / Alaska Native residents 9 18.8% Owner occupied40 81.2% Renter occupiedHouse owners and renters - Asian residents 300 35.3% Owner occupied551 64.7% Renter occupiedHouse owners and renters - Other race residents 120 20.4% Owner occupied467 79.6% Renter occupiedHouse owners and renters - Two or more races residents 380 47.9% Owner occupied414 52.1% Renter occupiedHouse owners and renters - White alone residents 13,235 65.7% Owner occupied6,916 34.3% Renter occupiedHouse owners and renters - Hispanic or Latino residents 379 37.5% Owner occupied632 62.5% Renter occupied
Language usage in St. Cloud
English speakers - Total 78.7% of residents of St. Cloud speak English at home.
4.2% of residents speak Spanish at home 2,230 81.7% Speak English very well499 18.3% Speak English less than very well17.1% of residents speak other language at home 5,781 51.6% Speak English very well5,415 48.4% Speak English less than very well
English speakers - Born in the United States 88.4% of residents of St. Cloud speak English at home.
7.8% of residents speak Spanish at home 923 100.0% Speak English very well3.9% of residents speak other language at home 303 65.7% Speak English very well158 34.3% Speak English less than very well
English speakers - Native, born elsewhere 86.4% of residents of St. Cloud speak English at home.
4.6% of residents speak Spanish at home 36 100.0% Speak English very well9.0% of residents speak other language at home 71 100.0% Speak English very well
English speakers - Foreign-born 10.9% of residents of St. Cloud speak English at home.
7.8% of residents speak Spanish at home 485 56.9% Speak English very well367 43.1% Speak English less than very well81.3% of residents speak other language at home 3,721 41.7% Speak English very well5,192 58.3% Speak English less than very well
White (Caucasian) - Speak only English Native:
97.3% (43,553)Foreign-born:
31.1% (329)
White (Caucasian) - Speak another language Native:
2.7% (1,215)Foreign-born:
64.1% (679)
Black or African American - Speak only English Native:
77.8% (5,550)Foreign-born:
6.9% (507)
Black or African American - Speak another language Native:
22.2% (1,585)Foreign-born:
93.1% (6,857)
Asian - Speak only English Native:
15.3% (92)Foreign-born:
26.5% (337)
Asian - Speak another language Native:
84.7% (511)Foreign-born:
73.5% (937)
Other race - Speak only English Native:
40.9% (454)Foreign-born:
35.6% (116)
Other race - Speak another language Native:
58.8% (654)Foreign-born:
71.2% (232)
Two or more races - Speak only English Native:
91.0% (3,459)Foreign-born:
23.7% (82)
Two or more races - Speak another language Native:
9.1% (347)Foreign-born:
75.3% (261)
White alone - Speak only English Native:
98.0% (43,267)Foreign-born:
28.8% (330)
White alone - Speak another language Native:
1.9% (837)Foreign-born:
66.6% (765)
Hispanic or Latino - Speak only English Native:
34.4% (695)Foreign-born:
13.8% (136)
Hispanic or Latino - Speak another language Native:
65.6% (1,324)Foreign-born:
86.2% (852)
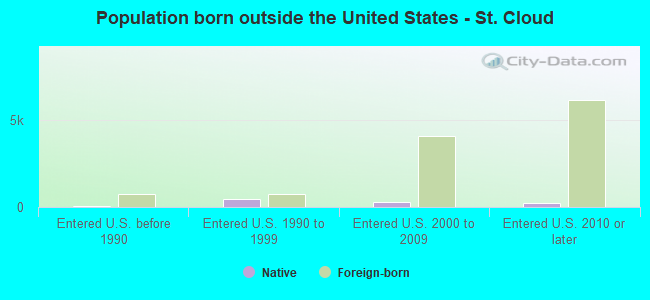
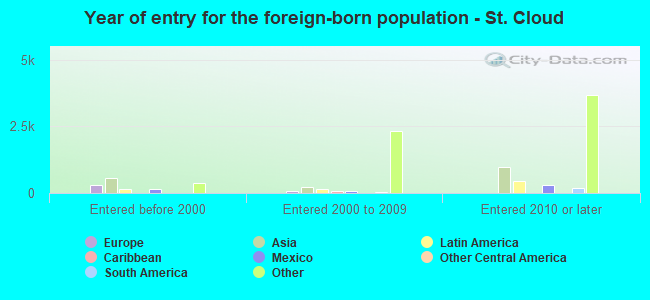
Foreign-born residents in St. Cloud 8,795 residents are foreign born (8.0% Africa , 2.5% Asia ).
This city:
12.6%Minnesota:
8.5%
Marital status for residents in St. Cloud Marital status - White (Caucasian) population 15 years and over
Males 47.6% Never married41.6% Now married0.0% Separated1.5% Widowed9.4% DivorcedFemales 34.7% Never married45.1% Now married2.6% Separated7.2% Widowed10.5% DivorcedWomen who gave birth in the past 12 months Now married:
56.7% (328)Unmarried:
43.3% (250)
Women who did not give birth in the past 12 months Now married:
34.5% (3,629)Unmarried:
65.5% (6,902)
Marital status - Black or African American population 15 years and over
Males 65.6% Never married29.0% Now married0.0% Separated0.0% Widowed5.5% DivorcedFemales 56.2% Never married24.6% Now married4.0% Separated3.7% Widowed11.5% DivorcedWomen who gave birth in the past 12 months Now married:
72.4% (273)Unmarried:
27.6% (104)
Women who did not give birth in the past 12 months Now married:
24.2% (733)Unmarried:
75.8% (2,302)
Marital status - American Indian / Alaska Native population 15 years and over
Males 56.8% Never married37.8% Now married0.0% Separated4.1% Widowed1.4% DivorcedFemales 43.7% Never married30.4% Now married0.0% Separated25.9% Widowed0.0% DivorcedWomen who did not give birth in the past 12 months Now married:
29.5% (32)Unmarried:
70.5% (77)
Marital status - Asian population 15 years and over
Males 52.6% Never married44.0% Now married0.0% Separated2.7% Widowed0.8% DivorcedFemales 33.7% Never married58.3% Now married0.0% Separated0.1% Widowed7.9% DivorcedWomen who gave birth in the past 12 months Now married:
100.0% (9)Unmarried:
0.0% (0)
Women who did not give birth in the past 12 months Now married:
53.2% (405)Unmarried:
46.8% (356)
Marital status - Other race population 15 years and over
Males 55.2% Never married36.0% Now married5.4% Separated0.0% Widowed3.3% DivorcedFemales 52.6% Never married40.7% Now married0.0% Separated0.0% Widowed6.7% DivorcedWomen who did not give birth in the past 12 months Now married:
41.1% (215)Unmarried:
58.9% (308)
Marital status - Two or more races population 15 years and over
Males 50.2% Never married38.7% Now married0.6% Separated0.8% Widowed9.8% DivorcedFemales 77.2% Never married13.9% Now married0.8% Separated0.0% Widowed8.1% DivorcedWomen who gave birth in the past 12 months Now married:
0.0% (0)Unmarried:
100.0% (107)
Women who did not give birth in the past 12 months Now married:
13.8% (168)Unmarried:
86.2% (1,045)
Marital status - White alone, not Hispanic / Latino population 15 years and over
Males 46.4% Never married42.5% Now married0.0% Separated1.5% Widowed9.6% DivorcedFemales 34.9% Never married44.8% Now married2.6% Separated7.2% Widowed10.5% DivorcedWomen who gave birth in the past 12 months Now married:
48.3% (234)Unmarried:
51.7% (250)
Women who did not give birth in the past 12 months Now married:
34.5% (3,629)Unmarried:
65.5% (6,902)
Marital status - Hispanic or Latino population 15 years and over
Males 54.0% Never married38.6% Now married3.2% Separated0.0% Widowed4.2% DivorcedFemales 61.8% Never married31.5% Now married0.9% Separated3.2% Widowed2.6% DivorcedWomen who gave birth in the past 12 months Now married:
100.0% (7)Unmarried:
0.0% (0)
Women who did not give birth in the past 12 months Now married:
31.9% (286)Unmarried:
68.1% (608)
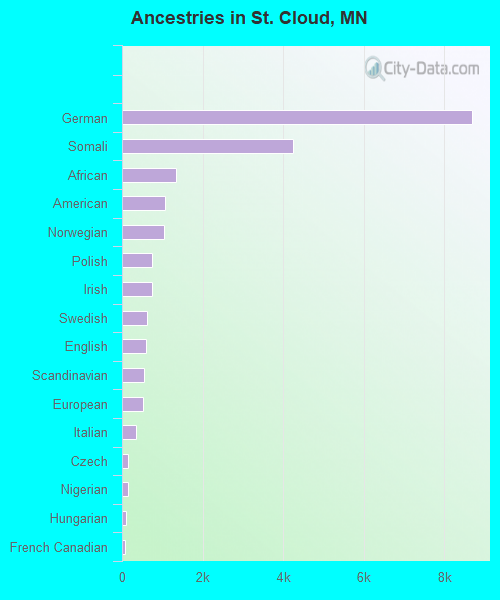
Ancestries in St. Cloud
8,678 30.5% German4,244 14.9% Somali1,351 4.7% African1,058 3.7% American1,051 3.7% Norwegian754 2.7% Polish740 2.6% Irish623 2.2% Swedish603 2.1% English534 1.9% Scandinavian509 1.8% European360 1.3% Italian157 0.6% Czech141 0.5% Nigerian106 0.4% Hungarian80 0.3% French Canadian75 0.3% Northern European67 0.2% Canadian64 0.2% French62 0.2% Danish61 0.2% Arab60 0.2% Finnish51 0.2% Yugoslavian40 0.1% Bulgarian38 0.1% Dutch37 0.1% Lebanese37 0.1% Lithuanian36 0.1% Sudanese34 0.1% Ukrainian33 0.1% Croatian32 0.1% Greek32 0.1% Scotch-Irish32 0.1% Liberian31 0.1% Scottish29 0.1% Ethiopian20 0.07% Jamaican16 0.06% Romanian13 0.05% Haitian12 0.04% British12 0.04% Austrian12 0.04% Russian11 0.04% Belgian10 0.04% Eastern European9 0.03% Cape Verdean9 0.03% Albanian9 0.03% Trinidadian and Tobagonian8 0.03% Luxembourger8 0.03% Czechoslovakian7 0.02% West Indian6 0.02% Slovene6 0.02% Senegalese6 0.02% Bahamian5 0.02% Dutch West Indian5 0.02% Welsh4 0.01% Slovak4 0.01% Celtic4 0.01% Ghanaian4 0.01% Egyptian3 0.01% Ugandan
Geographical mobility in St. Cloud Same house 1 year ago 35,915 78.6% White (Caucasian)10,910 69.2% Black or African American152 58.4% American Indian / Alaska Native2,256 80.3% Asian754 52.7% Other race2,959 70.2% Two or more races34,947 78.4% White alone, not Hispanic / Latino1,704 57.6% Hispanic or LatinoMoved within same county 4,799 10.5% White / Caucasian1,853 11.8% Black or African American45 17.2% American Indian / Alaska Native295 10.5% Asian774 18.4% Two or more races4,751 10.7% White alone, not Hispanic / Latino472 16.0% Hispanic or LatinoMoved within same state 4,525 9.9% White / Caucasian2,400 15.2% Black or African American52 20.0% American Indian / Alaska Native184 6.5% Asian644 45.0% Other race483 11.5% Two or more races4,429 9.9% White alone, not Hispanic / Latino847 28.6% Hispanic or LatinoMoved from different state 450 1.0% White / Caucasian248 1.6% Black or African American4 1.4% American Indian / Alaska Native129 9.0% Other race450 1.0% White alone, not Hispanic / Latino150 5.1% Hispanic or LatinoMoved from abroad 348 2.2% Black or African American54 1.9% Asian84 5.8% Other race53 1.8% Hispanic or Latino
Children Nativity (place of birth) in St. Cloud
Children under 6 years - Living with two parents Both parents native 1,176 100.0% NativeBoth parents foreign-born 136 100.0% NativeOne native, one foreign-born parent 902 100.0% NativeChildren under 6 years - Living with one parent Native parent 1,143 100.0% NativeForeign-born parent 1,322 96.9% Native42 3.1% Foreign-bornChildren 6 to 17 years - Living with two parents Both parents native 2,690 97.2% Native78 2.8% Foreign-bornBoth parents foreign-born 53 13.5% Native340 86.5% Foreign-bornOne native, one foreign-born parent 1,629 100.0% NativeChildren 6 to 17 years - Living with one parent Native parent 2,035 100.0% NativeForeign-born parent 2,844 57.9% Native2,066 42.1% Foreign-born
Grandparents responsible for own grandchildren in St. Cloud
Grandparents (30 to 59 years) White / Caucasian 91 100.0% Not responsible for grandchildrenBlack or African American 144 100.0% Responsible for grandchildrenAsian 14 100.0% Not responsible for grandchildrenOther race 72 100.0% Responsible for grandchildrenWhite alone, not Hispanic / Latino 93 100.0% Not responsible for grandchildrenHispanic or Latino 43 100.0% Responsible for grandchildrenGrandparents (60 years and over) White / Caucasian 48 29.7% Responsible for grandchildren114 70.3% Not responsible for grandchildrenBlack or African American 11 100.0% Not responsible for grandchildrenAsian 61 100.0% Not responsible for grandchildrenWhite alone, not Hispanic / Latino 50 29.9% Responsible for grandchildren116 70.1% Not responsible for grandchildren