Median price asked for vacant for-sale houses and condos in 2022 in this county: $229,511.
Median contract rent in 2022: $1,111 (lower quartile is $948, upper quartile is $1,505)
Median rent asked for vacant for-rent units in 2022: $1,059
Median gross rent in St. Bethlehem, TN in 2022: $1,347
Housing units in St. Bethlehem with a mortgage: 4,533 (451 second mortgage, 353 home equity loan, 0 both second mortgage and home equity loan) Houses without a mortgage: 644
Compare current foreclosures near St. Bethlehem, TN:
In family households: 145,870 (30,722 male householders, 14,874 female householders)
33,143 spouses, 53,950 children (48,396 natural, 1,318 adopted, 4,236 stepchildren), 3,595 grandchildren, 1,428 brothers or sisters, 1,230 parents, foster children, 1,817 other relatives, 4,149 non-relatives
In nonfamily households: 23,045 (9,217 male householders (6,871 living alone)), 8,860 female householders (7,431 living alone)), 4,968 nonrelatives
In group quarters: 3,416 (951 institutionalized population)
26,709 married couples with children.
8,320 single-parent households (1,572 men, 6,748 women).
92.8% of residents of St. Bethlehem speak English at home.
2.8% of residents speak Spanish at home (73% speak English very well, 15% speak English well, 12% speak English not well).
3.3% of residents speak other Indo-European language at home (70% speak English very well, 15% speak English well, 15% speak English not well, 1% don't speak English at all).
0.8% of residents speak Asian or Pacific Island language at home (63% speak English very well, 33% speak English well, 5% speak English not well).
0.2% of residents speak other language at home (62% speak English very well, 38% speak English well).
Foreign born population: 1,908 (4.8%)
(58.6% of them are naturalized citizens)
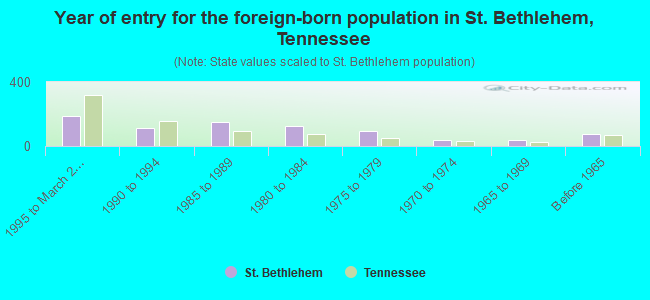
Year of entry for the foreign-born population in St. Bethlehem, Tennessee
1881995 to March 2000
1111990 to 1994
1521985 to 1989
1281980 to 1984
941975 to 1979
381970 to 1974
361965 to 1969
72Before 1965
Most common places of birth for foreign-born residents (%):
Germany
St. Bethlehem:
29.2% (239)
Tennessee:
5.2% (8,316)
Korea
St. Bethlehem:
21.1% (173)
Tennessee:
3.8% (6,106)
India
St. Bethlehem:
9.3% (76)
Tennessee:
4.8% (7,701)
Mexico
St. Bethlehem:
7.9% (65)
Tennessee:
28.1% (44,682)
Panama
St. Bethlehem:
5.5% (45)
Tennessee:
0.9% (1,381)
France
St. Bethlehem:
2.1% (17)
Tennessee:
0.6% (974)
Dominican Republic
St. Bethlehem:
2.0% (16)
Tennessee:
0.3% (407)
Nicaragua
St. Bethlehem:
2.0% (16)
Tennessee:
0.3% (489)
Italy
St. Bethlehem:
1.7% (14)
Tennessee:
0.6% (937)
Other South Central Asia
St. Bethlehem:
1.7% (14)
Tennessee:
0.2% (375)
Place of birth for U.S.-born residents:
This state: 8,439
Other state: 12,637
Northeast: 1,563
Midwest: 3,371
South: 5,914
West: 1,789
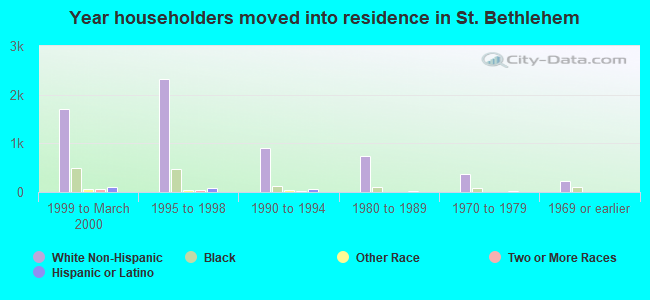
40% of St. Bethlehem residents lived in the same house 5 years ago. Out of people who lived in different houses, 43% lived in this county. Out of people who lived in different counties, 13% lived in Tennessee.
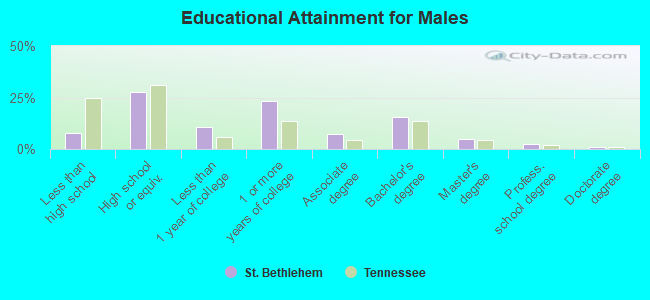
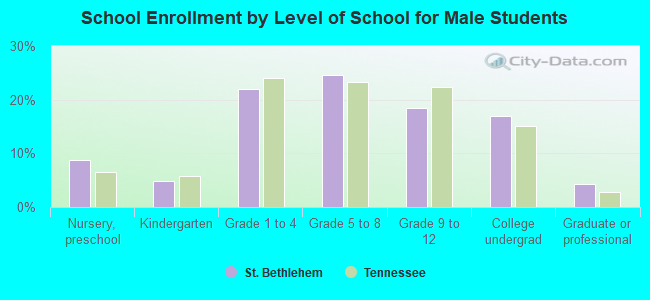
Education attainment for males 25 years and older:
No schooling: 14
Nursery to 4th grade: 14
5th and 6th grade: 42
7th and 8th grade: 126
9th grade: 46
10th grade: 64
11th grade: 45
12th grade, no diploma: 177
High school graduate (or equivalency): 1,826
Less than 1 year of college: 720
Some college more than 1 year, no degree: 1,539
Associate degree: 475
Bachelor's degree: 1,035
Master's degree: 320
Professional school degree: 150
Doctorate degree: 62
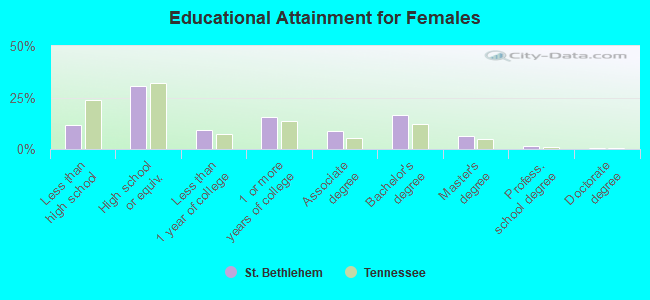
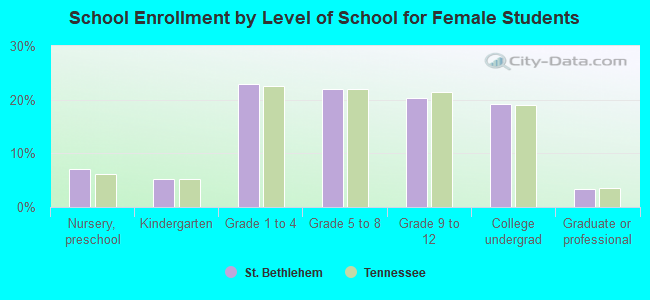
Education attainment for females 25 years and older:
No schooling: 20
Nursery to 4th grade: 25
5th and 6th grade: 33
7th and 8th grade: 81
9th grade: 95
10th grade: 169
11th grade: 141
12th grade, no diploma: 242
High school graduate (or equivalency): 2,137
Less than 1 year of college: 650
Some college more than 1 year, no degree: 1,086
Associate degree: 622
Bachelor's degree: 1,142
Master's degree: 435
Professional school degree: 95
Doctorate degree: 22
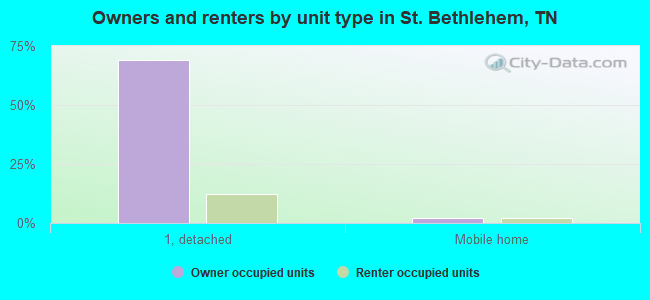
Housing units in structures:
One, detached: 6,885
One, attached: 51
Two: 63
3 or 4: 489
5 to 9: 513
10 to 19: 153
20 to 49: 9
50 or more: 18
Mobile homes: 389
Boats, RVs, vans, etc.: 14
Median worth of mobile homes: $64,968
Housing units lacking complete plumbing facilities: 0.3%
Housing units lacking complete kitchen facilities: 0.3%