Work and Jobs in St. Bethlehem, Tennessee (TN) Detailed Stats
Occupations, Industries, Unemployment, Workers, Commute
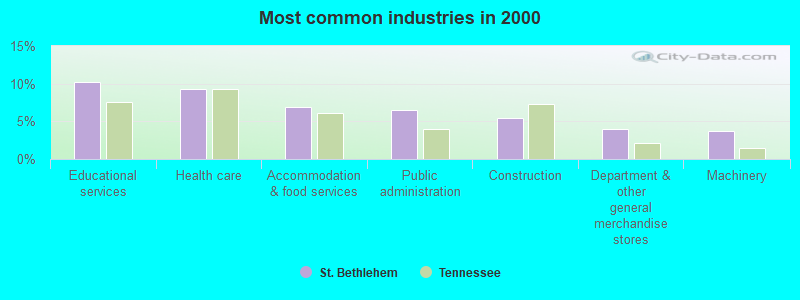
The most common industries in St. Bethlehem are: Educational services (10.3% of civilian employees), Health care (9.2% of civilian employees), Accommodation & food services (7.0% of civilian employees). 63.0% of workers are employees of private companies, which is 11.0% less than the rate of 70.0% across the entire state of Tennessee.
Most common industries
Most common industries | |||
|---|---|---|---|
Industry | All | Males | Females |
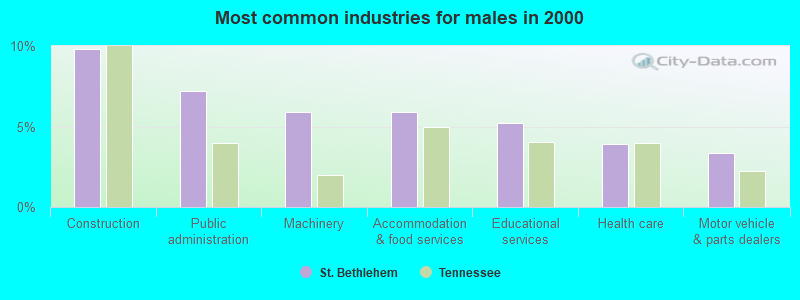
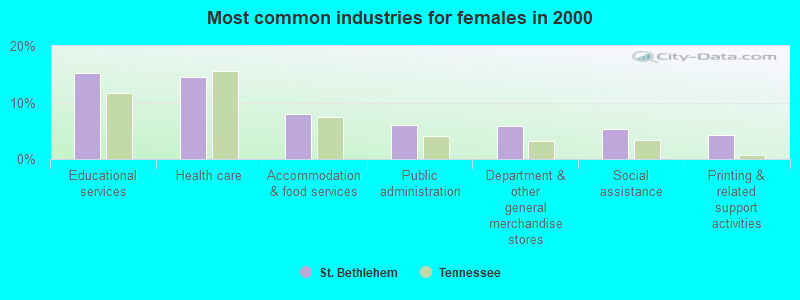
| Educational services | 10.3% (1,085) | 5.2% (273) | 15.2% (812) |
| Health care | 9.2% (976) | 3.9% (203) | 14.4% (773) |
| Accommodation and food services | 7.0% (736) | 5.9% (308) | 8.0% (428) |
| Public administration | 6.6% (694) | 7.2% (375) | 6.0% (319) |
| Construction | 5.4% (569) | 9.8% (512) | 1.1% (57) |
| Department and other general merchandise stores | 4.0% (418) | 2.0% (102) | 5.9% (316) |
| Machinery | 3.7% (387) | 5.9% (309) | 1.5% (78) |
| Printing and related support activities | 3.4% (364) | 2.7% (140) | 4.2% (224) |
| Social assistance | 2.8% (300) | 0.3% (17) | 5.3% (283) |
| Administrative and support and waste management services | 2.8% (291) | 3.3% (172) | 2.2% (119) |
| Finance and insurance | 2.5% (263) | 1.6% (84) | 3.3% (179) |
| Transportation equipment | 2.2% (233) | 3.1% (160) | 1.4% (73) |
| Building material and garden equipment and supplies dealers | 2.0% (208) | 2.9% (149) | 1.1% (59) |
| Food and beverage stores | 2.0% (207) | 1.2% (65) | 2.7% (142) |
| Professional, scientific, and technical services | 1.9% (205) | 2.3% (122) | 1.6% (83) |
| Truck transportation | 1.8% (186) | 2.7% (141) | 0.8% (45) |
| Broadcasting and telecommunications | 1.7% (182) | 1.9% (100) | 1.5% (82) |
| Religious, grantmaking, civic, professional, and similar organizations | 1.7% (181) | 2.0% (102) | 1.5% (79) |
| Electrical equipment, appliances, and components | 1.7% (176) | 2.2% (113) | 1.2% (63) |
| Motor vehicle and parts dealers | 1.7% (175) | 3.4% (175) | 0.0% (0) |
| Other transportation, and support activities, and couriers | 1.6% (169) | 3.1% (162) | 0.1% (7) |
| Miscellaneous manufacturing | 1.4% (150) | 2.1% (110) | 0.7% (40) |
| Metal and metal products | 1.4% (145) | 2.3% (119) | 0.5% (26) |
| Real estate and rental and leasing | 1.4% (143) | 0.6% (33) | 2.1% (110) |
| Repair and maintenance | 1.3% (138) | 2.3% (122) | 0.3% (16) |
| Agriculture, forestry, fishing and hunting | 1.2% (129) | 2.3% (122) | 0.1% (7) |
| Arts, entertainment, and recreation | 1.2% (127) | 0.7% (36) | 1.7% (91) |
| Used merchandise, gift, novelty, and souvenir, and other miscellaneous stores | 1.1% (117) | 0.6% (33) | 1.6% (84) |
| Utilities | 1.1% (115) | 1.5% (78) | 0.7% (37) |
| U. S. Postal service | 0.9% (92) | 1.5% (78) | 0.3% (14) |
| Publishing, and motion picture and sound recording industries | 0.9% (91) | 0.7% (34) | 1.1% (57) |
| Paper | 0.8% (85) | 1.2% (63) | 0.4% (22) |
| Gasoline stations | 0.7% (79) | 0.3% (14) | 1.2% (65) |
| Personal and laundry services | 0.7% (77) | 0.2% (8) | 1.3% (69) |
| Alcoholic beverages merchant wholesalers | 0.7% (70) | 1.1% (56) | 0.3% (14) |
| Plastics and rubber products | 0.6% (61) | 1.2% (61) | 0.0% (0) |
| Furniture and home furnishings, and household appliance stores | 0.5% (58) | 0.7% (35) | 0.4% (23) |
| Apparel | 0.5% (56) | 0.0% (0) | 1.0% (56) |
| Clothing and accessories, including shoe, stores | 0.5% (54) | 0.2% (8) | 0.9% (46) |
| Data processing, libraries, and other information services | 0.5% (51) | 0.7% (38) | 0.2% (13) |
| Private households | 0.4% (46) | 0.0% (0) | 0.9% (46) |
| Motor vehicles, parts and supplies merchant wholesalers | 0.4% (44) | 0.7% (37) | 0.1% (7) |
| Other direct selling establishments | 0.4% (43) | 0.0% (0) | 0.8% (43) |
| Music stores | 0.4% (43) | 0.5% (27) | 0.3% (16) |
| Retail florists | 0.4% (38) | 0.0% (0) | 0.7% (38) |
| Furniture and related product manufacturing | 0.4% (38) | 0.4% (22) | 0.3% (16) |
| Food | 0.3% (34) | 0.2% (10) | 0.4% (24) |
| Machinery, equipment, and supplies merchant wholesalers | 0.3% (32) | 0.5% (24) | 0.1% (8) |
| Electronic shopping and mail-order houses | 0.3% (29) | 0.1% (6) | 0.4% (23) |
| Radio, TV, and computer stores | 0.3% (28) | 0.5% (28) | 0.0% (0) |
| Petroleum and petroleum products merchant wholesalers | 0.3% (28) | 0.5% (28) | 0.0% (0) |
| Professional and commercial equipment and supplies merchant wholesalers | 0.3% (28) | 0.5% (28) | 0.0% (0) |
| Electrical and electronic goods merchant wholesalers | 0.3% (27) | 0.4% (19) | 0.1% (8) |
| Sporting goods, camera, and hobby and toy stores | 0.2% (25) | 0.0% (0) | 0.5% (25) |
| Beverage and tobacco products | 0.2% (23) | 0.4% (23) | 0.0% (0) |
| Book stores and news dealers | 0.2% (22) | 0.3% (15) | 0.1% (7) |
| Air transportation | 0.2% (21) | 0.3% (16) | 0.1% (5) |
| Chemicals | 0.2% (20) | 0.4% (20) | 0.0% (0) |
| Pharmacies and drug stores | 0.2% (19) | 0.0% (0) | 0.4% (19) |
| Textile mills and textile products | 0.2% (17) | 0.2% (9) | 0.1% (8) |
| Nonmetallic mineral products | 0.2% (16) | 0.2% (8) | 0.1% (8) |
| Groceries and related products merchant wholesalers | 0.2% (16) | 0.3% (16) | 0.0% (0) |
| Hardware, plumbing and heating equipment, and supplies merchant wholesalers | 0.1% (15) | 0.3% (15) | 0.0% (0) |
| Office supplies and stationery stores | 0.1% (13) | 0.0% (0) | 0.2% (13) |
| Mining, quarrying, and oil and gas extraction | 0.1% (10) | 0.2% (10) | 0.0% (0) |
| Vending machine operators | 0.1% (8) | 0.2% (8) | 0.0% (0) |
| Jewelry, luggage, and leather goods stores | 0.1% (8) | 0.2% (8) | 0.0% (0) |
| Water transportation | 0.1% (6) | 0.1% (6) | 0.0% (0) |
Unemployment in St. Bethlehem
- Unemployment by race in 2000
- Unemployment rate for White non-Hispanic residents
- 2.1%Males
- 4.3%Females
- Unemployment rate for Black residents
- 5.9%Males
- 4.6%Females
- Unemployment rate for other race residents
- 4.5%Females
- Unemployment rate for two or more race residents
- 14.5%Males
- 14.8%Females
- Unemployment rate for Hispanic or Latino residents
- 3.1%Males
- 10.5%Females
Time leaving home to go to work

<5am:
| St. Bethlehem: | 3.2% (393) |
| Tennessee: | 3.6% (95,201) |
5:30am:
| St. Bethlehem: | 5.3% (657) |
| Tennessee: | 3.2% (85,054) |
6am:
| St. Bethlehem: | 11.5% (1,412) |
| Tennessee: | 5.0% (130,170) |
6:30am:
| St. Bethlehem: | 10.6% (1,308) |
| Tennessee: | 9.9% (258,202) |
7am:
| St. Bethlehem: | 12.9% (1,591) |
| Tennessee: | 12.1% (315,993) |
7:30am:
| St. Bethlehem: | 10.8% (1,324) |
| Tennessee: | 15.3% (400,482) |
8am:
| St. Bethlehem: | 11.2% (1,384) |
| Tennessee: | 14.7% (385,430) |
8:30am:
| St. Bethlehem: | 6.6% (812) |
| Tennessee: | 8.3% (217,000) |
9am:
| St. Bethlehem: | 3.3% (405) |
| Tennessee: | 3.6% (95,491) |
10am:
| St. Bethlehem: | 3.2% (399) |
| Tennessee: | 4.2% (109,641) |
11am:
| St. Bethlehem: | 1.2% (143) |
| Tennessee: | 1.7% (45,353) |
12pm:
| St. Bethlehem: | 1.0% (128) |
| Tennessee: | 0.8% (21,640) |
4pm:
| St. Bethlehem: | 7.0% (860) |
| Tennessee: | 7.3% (192,279) |
>4pm:
| St. Bethlehem: | 10.0% (1,235) |
| Tennessee: | 7.6% (198,970) |
Travel time to work


Less than 5 minutes:
| St. Bethlehem: | 1.6% (193) |
| Tennessee: | 2.8% (73,643) |
5 to 9 minutes:
| St. Bethlehem: | 7.7% (946) |
| Tennessee: | 9.9% (258,796) |
10 to 14 minutes:
| St. Bethlehem: | 17.7% (2,174) |
| Tennessee: | 14.6% (382,474) |
15 to 19 minutes:
| St. Bethlehem: | 20.4% (2,507) |
| Tennessee: | 16.9% (441,464) |
20 to 24 minutes:
| St. Bethlehem: | 17.4% (2,140) |
| Tennessee: | 15.6% (409,099) |
25 to 29 minutes:
| St. Bethlehem: | 7.9% (969) |
| Tennessee: | 6.0% (158,281) |
30 to 34 minutes:
| St. Bethlehem: | 9.7% (1,193) |
| Tennessee: | 14.1% (370,428) |
35 to 39 minutes:
| St. Bethlehem: | 1.0% (120) |
| Tennessee: | 2.4% (63,838) |
40 to 44 minutes:
| St. Bethlehem: | 0.9% (107) |
| Tennessee: | 2.7% (70,195) |
45 to 59 minutes:
| St. Bethlehem: | 5.8% (720) |
| Tennessee: | 6.7% (174,982) |
60 to 89 minutes:
| St. Bethlehem: | 5.6% (687) |
| Tennessee: | 3.5% (92,042) |
90 or more minutes:
| St. Bethlehem: | 2.4% (295) |
| Tennessee: | 2.1% (55,664) |
Means of transportation to work

Drove car alone:
| St. Bethlehem: | 87.0% (10,705) |
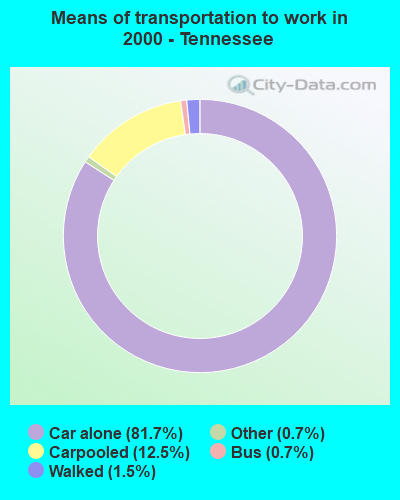
| Tennessee: | 81.7% (2,140,377) |
Carpooled:
| St. Bethlehem: | 8.8% (1,087) |
| Tennessee: | 12.5% (328,321) |
Bus or trolley bus:
| St. Bethlehem: | 0.4% (51) |
| Tennessee: | 0.7% (18,847) |
Taxicab:
| St. Bethlehem: | 0.1% (8) |
| Tennessee: | 0.1% (1,661) |
Motorcycle:
| St. Bethlehem: | 0.4% (47) |
| Tennessee: | 0.1% (1,713) |
Bicycle:
| St. Bethlehem: | 0.1% (11) |
| Tennessee: | 0.1% (2,330) |
Walked:
| St. Bethlehem: | 0.5% (61) |
| Tennessee: | 1.5% (39,689) |
Other means:
| St. Bethlehem: | 0.7% (81) |
| Tennessee: | 0.7% (17,308) |
Private vehicle occupancy

Drove alone:
| St. Bethlehem: | 90.8% (10,705) |
| Tennessee: | 86.7% (2,140,377) |
In 2 person carpool:
| St. Bethlehem: | 7.7% (910) |
| Tennessee: | 10.4% (257,957) |
In 3 person carpool:
| St. Bethlehem: | 0.9% (108) |
| Tennessee: | 1.8% (44,143) |
In 4 person carpool:
| St. Bethlehem: | 0.2% (26) |
| Tennessee: | 0.6% (14,756) |
In 5-6 person carpool:
| St. Bethlehem: | 0.1% (9) |
| Tennessee: | 0.3% (7,676) |
In 7+ person carpool:
| St. Bethlehem: | 0.3% (34) |
| Tennessee: | 0.2% (3,789) |
Class of workers
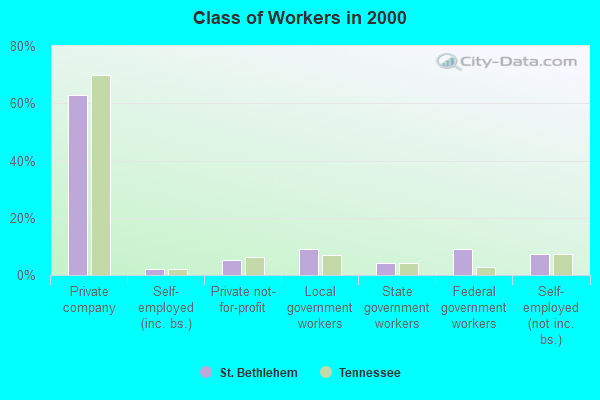
Employee of private company:
| St. Bethlehem: | 63.0% (6,661) |
| Tennessee: | 70.0% (1,855,123) |
Self-employed in own incorporated business:
| St. Bethlehem: | 2.0% (212) |
| Tennessee: | 2.3% (60,116) |
Private not-for-profit wage and salary workers:
| St. Bethlehem: | 5.3% (556) |
| Tennessee: | 6.2% (164,441) |
Local government workers:
| St. Bethlehem: | 9.1% (957) |
| Tennessee: | 7.1% (189,357) |
State government workers:
| St. Bethlehem: | 4.1% (434) |
| Tennessee: | 4.0% (107,075) |
Federal government workers:
| St. Bethlehem: | 9.0% (953) |
| Tennessee: | 2.7% (72,605) |
Self-employed workers in own not incorporated business:
| St. Bethlehem: | 7.3% (772) |
| Tennessee: | 7.3% (194,497) |
Unpaid family workers:
| St. Bethlehem: | 0.2% (24) |
| Tennessee: | 0.3% (8,424) |

Employee of private company - Males:
| St. Bethlehem: | 65.1% (3,393) |
| Tennessee: | 72.2% (1,026,929) |
Self-employed in own incorporated business - Males:
| St. Bethlehem: | 3.1% (163) |
| Tennessee: | 3.1% (44,063) |
Private not-for-profit wage and salary workers - Males:
| St. Bethlehem: | 3.2% (165) |
| Tennessee: | 3.9% (55,232) |
Local government workers - Males:
| St. Bethlehem: | 7.2% (378) |
| Tennessee: | 5.4% (76,783) |
State government workers - Males:
| St. Bethlehem: | 3.8% (198) |
| Tennessee: | 3.1% (43,631) |
Federal government workers - Males:
| St. Bethlehem: | 7.7% (400) |
| Tennessee: | 2.8% (39,487) |
Self-employed workers in own not incorporated business - Males:
| St. Bethlehem: | 9.9% (518) |
| Tennessee: | 9.3% (131,816) |

Employee of private company - Females:
| St. Bethlehem: | 61.0% (3,268) |
| Tennessee: | 67.4% (828,194) |
Self-employed in own incorporated business - Females:
| St. Bethlehem: | 0.9% (49) |
| Tennessee: | 1.3% (16,053) |
Private not-for-profit wage and salary workers - Females:
| St. Bethlehem: | 7.3% (391) |
| Tennessee: | 8.9% (109,209) |
Local government workers - Females:
| St. Bethlehem: | 10.8% (579) |
| Tennessee: | 9.2% (112,574) |
State government workers - Females:
| St. Bethlehem: | 4.4% (236) |
| Tennessee: | 5.2% (63,444) |
Federal government workers - Females:
| St. Bethlehem: | 10.3% (553) |
| Tennessee: | 2.7% (33,118) |
Self-employed workers in own not incorporated business - Females:
| St. Bethlehem: | 4.7% (254) |
| Tennessee: | 5.1% (62,681) |
Unpaid family workers - Females:
| St. Bethlehem: | 0.4% (24) |
| Tennessee: | 0.4% (4,396) |