Jump to a detailed profile or search site with Google Custom Search

Springfield, NJ (New Jersey) Houses and Residents

Estimated median house or condo value in 2022: $662,399 (it was $245,500 in 2000)
Springfield:

$662,399
New Jersey:

$428,900
Lower value quartile - upper value quartile: $518,693 - $764,095

Total population: 14,334 (All urban)

Houses: 6,204 (6,001 occupied: 4,442 owner occupied, 1,559 renter occupied)

% of renters here:

26%
State:

35%

Housing density: 1,205 houses/condos per square mile

Median price asked for vacant for-sale houses and condos in 2022 in this county: $468,662.

Median contract rent in 2022: over $2,000 (lower quartile is $1,452, upper quartile is over $2,000)


Median rent asked for vacant for-rent units in 2022: $1,686


Median gross rent in Springfield, NJ in 2022: over $2,000

Housing units in Springfield with a mortgage: 2,581 (224 second mortgage, 348 home equity loan, 17 both second mortgage and home equity loan)
Houses without a mortgage: 1,422

Compare current foreclosures in Springfield, NJ:

Check out more offers in Springfield, NJ.
Powered by Foreclosure.com


Latest news about housing in Springfield, NJ collected exclusively by city-data.com from local newspapers, TV, and radio stations

Springfield, New Jersey Age and Sex of Residents

Household type by relationship:

Households: 529,695
  • In family households: 464,085 (87,269 male householders, 47,405 female householders)
    94,325 spouses, 171,221 children (162,243 natural, 3,299 adopted, 5,679 stepchildren), 11,365 grandchildren, 8,963 brothers or sisters, 8,956 parents, foster children, 13,013 other relatives, 16,322 non-relatives
  • In nonfamily households: 65,610 (23,484 male householders (18,363 living alone)), 29,960 female householders (26,038 living alone)), 12,166 nonrelatives
  • In group quarters: 6,804 (4,209 institutionalized population)

88,023 married couples with children.
26,686 single-parent households (5,364 men, 21,322 women).

76.2% of residents of Springfield speak English at home.
4.1% of residents speak Spanish at home (53% speak English very well, 26% speak English well, 20% speak English not well, 1% don't speak English at all).
14.8% of residents speak other Indo-European language at home (68% speak English very well, 25% speak English well, 5% speak English not well, 2% don't speak English at all).
2.6% of residents speak Asian or Pacific Island language at home (65% speak English very well, 18% speak English well, 17% speak English not well).
2.3% of residents speak other language at home (68% speak English very well, 21% speak English well, 10% speak English not well).

Foreign born population: 4,241 (27.0%)
(69.0% of them are naturalized citizens)

Median number of rooms in houses and condos:
Here:

8.2
State:

6.8

Median number of rooms in apartments
Here:

4.1
State:

3.9

Owner-occupied Renter-occupied
Bedrooms in owner-occupied houses and condos in Springfield, New Jersey
  • Bedrooms in owner-occupied houses and condos in Springfield, New Jersey
  • 0no bedroom
  • 1731 bedroom
  • 7332 bedrooms
  • 1,9583 bedrooms
  • 1,4114 bedrooms
  • 1675+ bedrooms
Bedrooms in renter-occupied apartments in Springfield, New Jersey
  • Bedrooms in renter-occupied apartments in Springfield, New Jersey
  • 39no bedroom
  • 6911 bedroom
  • 6072 bedrooms
  • 1833 bedrooms
  • 394 bedrooms
  • 05+ bedrooms
Owner-occupied Renter-occupied
Cars and other vehicles available in Springfield in owner-occupied houses/condos
  • Cars and other vehicles available in Springfield in owner-occupied houses/condos
  • 200no vehicle
  • 1,0961 vehicle
  • 2,3362 vehicles
  • 5543 vehicles
  • 2194 vehicles
  • 375+ vehicles
Cars and other vehicles available in Springfield in renter-occupied apartments
  • Cars and other vehicles available in Springfield in renter-occupied apartments
  • 261no vehicle
  • 8511 vehicle
  • 4272 vehicles
  • 123 vehicles
  • 84 vehicles
  • 05+ vehicles
Owner-occupied Renter-occupied
Rooms in owner-occupied houses in Springfield, New Jersey
  • Rooms in owner-occupied houses in Springfield, New Jersey
  • 01 room
  • 222 rooms
  • 1183 rooms
  • 1524 rooms
  • 3855 rooms
  • 9286 rooms
  • 1,0787 rooms
  • 1,0838 rooms
  • 6769+ rooms
Rooms in renter-occupied apartments in Springfield, New Jersey
  • Rooms in renter-occupied apartments in Springfield, New Jersey
  • 251 room
  • 1542 rooms
  • 5463 rooms
  • 3674 rooms
  • 2515 rooms
  • 1386 rooms
  • 607 rooms
  • 08 rooms
  • 189+ rooms
Year house built
Breakdown of mean house values by ages of householders
Owners and renters by unit type in Springfield, NJ
  • Springfield, NJ household income distribution

  • Distribution of median household income in Springfield, NJ in 2022
  • 6,320Less than $10,000
  • 15,341$10,000 to $19,999
  • 14,874$20,000 to $29,999
  • 17,792$30,000 to $39,999
  • 14,079$40,000 to $49,999
  • 16,500$50,000 to $59,999
  • 21,989$60,000 to $74,999
  • 30,097$75,000 to $99,999
  • 26,612$100,000 to $124,999
  • 19,884$125,000 to $149,999
  • 27,987$150,000 to $199,999
  • 58,641$200,000 or more

Percentage of workers working in this county: 44.2%
Number of people working at home: 1,238 (13.8% of all workers)

Travel time to work (commute)

  • Less than 5 minutes: 190
  • 5 to 9 minutes: 604
  • 10 to 14 minutes: 1,046
  • 15 to 19 minutes: 977
  • 20 to 24 minutes: 1,038
  • 25 to 29 minutes: 441
  • 30 to 34 minutes: 1,063
  • 35 to 39 minutes: 241
  • 40 to 44 minutes: 311
  • 45 to 59 minutes: 504
  • 60 to 89 minutes: 601
  • 90 or more minutes: 174

Means of transportation to work:

  • Drove a car alone: 6,046 (81.0%)
  • Carpooled: 424 (5.7%)
  • Bus or trolley bus: 247 (3.3%)
  • Subway or elevated: 75 (1.0%)
  • Railroad: 265 (3.6%)
  • Bicycle: 13 (0.2%)
  • Walked: 120 (1.6%)
  • Worked at home: 272 (3.6%)
Class of Workers in 2000
Year of entry for the foreign-born population in Springfield, New Jersey
  • Year of entry for the foreign-born population in Springfield, New Jersey
  • 4081995 to March 2000
  • 5741990 to 1994
  • 3081985 to 1989
  • 3001980 to 1984
  • 2271975 to 1979
  • 2461970 to 1974
  • 2731965 to 1969
  • 601Before 1965
Ancestries in Springfield, NJ <small>(Other ancestries excluded from the graph)</small>

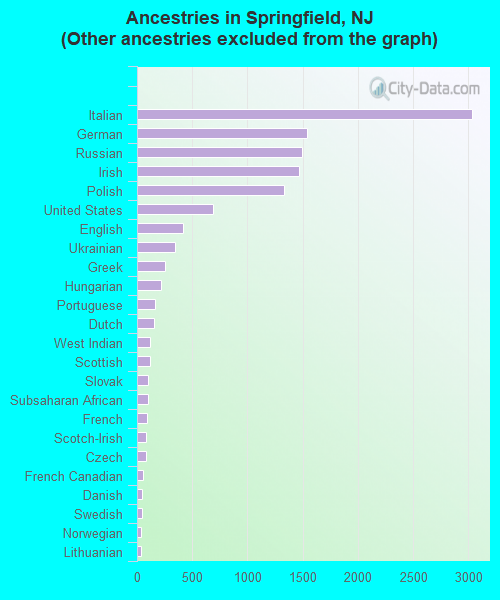
First ancestries reported:

  • Other: 3,696 (23.4%)
  • Italian: 3,036 (19.3%)
  • German: 1,538 (9.8%)
  • Russian: 1,493 (9.5%)
  • Irish: 1,471 (9.3%)
  • Polish: 1,328 (8.4%)
  • United States: 689 (4.4%)
  • English: 419 (2.7%)
  • Ukrainian: 348 (2.2%)
  • Greek: 250 (1.6%)
  • Hungarian: 216 (1.4%)
  • Portuguese: 165 (1.0%)
  • Dutch: 154 (1.0%)
  • West Indian: 116 (0.7%)
  • Scottish: 114 (0.7%)
  • Slovak: 100 (0.6%)
  • Subsaharan African: 96 (0.6%)
  • French: 89 (0.6%)
  • Scotch-Irish: 81 (0.5%)
  • Czech: 78 (0.5%)
  • French Canadian: 55 (0.3%)
  • Danish: 43 (0.3%)
  • Swedish: 41 (0.3%)
  • Norwegian: 38 (0.2%)
  • Lithuanian: 37 (0.2%)
  • Welsh: 26 (0.2%)
  • Swiss: 23 (0.1%)
  • Arab: 22 (0.1%)

Most common places of birth for foreign-born residents (%):

Ukraine
Springfield:

9.3% (274)
New Jersey:

1.0% (14,768)

Italy
Springfield:

9.0% (264)
New Jersey:

4.0% (58,395)

Russia
Springfield:

7.8% (229)
New Jersey:

1.4% (20,243)

Poland
Springfield:

5.1% (150)
New Jersey:

3.8% (55,466)

Other Eastern Europe
Springfield:

5.0% (148)
New Jersey:

1.2% (17,647)

Germany
Springfield:

4.4% (130)
New Jersey:

2.3% (33,531)

Philippines
Springfield:

4.1% (120)
New Jersey:

4.7% (69,773)

India
Springfield:

3.7% (109)
New Jersey:

8.1% (119,497)

Israel
Springfield:

3.6% (105)
New Jersey:

0.5% (7,675)

Portugal
Springfield:

3.3% (97)
New Jersey:

2.5% (37,183)

Peru
Springfield:

3.1% (92)
New Jersey:

3.1% (45,151)

South Africa
Springfield:

3.0% (89)
New Jersey:

0.2% (2,275)

Greece
Springfield:

2.9% (85)
New Jersey:

0.8% (12,403)

Cuba
Springfield:

2.6% (75)
New Jersey:

3.7% (55,241)

Korea
Springfield:

2.5% (74)
New Jersey:

3.5% (51,970)

China, excluding Hong Kong and Taiwan
Springfield:

2.2% (66)
New Jersey:

2.7% (40,092)

Colombia
Springfield:

2.0% (58)
New Jersey:

4.7% (69,754)

Guyana
Springfield:

1.9% (56)
New Jersey:

1.2% (17,746)

Iraq
Springfield:

1.7% (49)
New Jersey:

0.1% (896)

Costa Rica
Springfield:

1.6% (47)
New Jersey:

0.8% (12,383)

United Kingdom
Springfield:

1.6% (46)
New Jersey:

2.1% (30,355)

Place of birth for U.S.-born residents:

  • This state: 8,700
  • Other state: 2,719
  • Northeast: 1,981
  • Midwest: 323
  • South: 377
  • West: 38

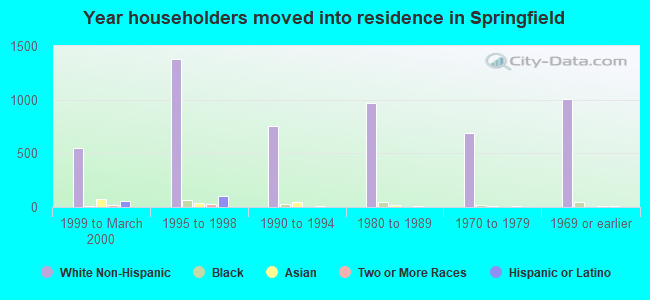
67% of Springfield residents lived in the same house 5 years ago.
   Out of people who lived in different houses, 46% lived in this county.
   Out of people who lived in different counties, 68% lived in New Jersey.

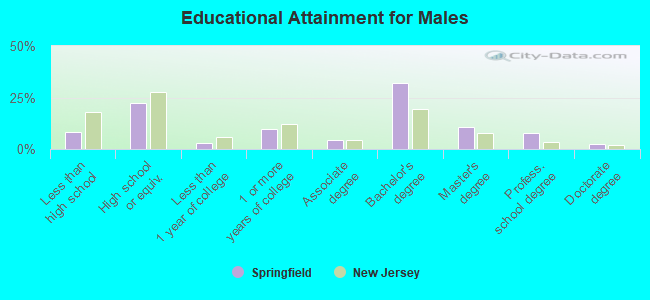
Education attainment for males 25 years and older:

  • No schooling: 28
  • Nursery to 4th grade: 20
  • 5th and 6th grade: 29
  • 7th and 8th grade: 85
  • 9th grade: 45
  • 10th grade: 65
  • 11th grade: 28
  • 12th grade, no diploma: 128
  • High school graduate (or equivalency): 1,127
  • Less than 1 year of college: 142
  • Some college more than 1 year, no degree: 498
  • Associate degree: 214
  • Bachelor's degree: 1,622
  • Master's degree: 540
  • Professional school degree: 395
  • Doctorate degree: 135
Educational Attainment for Males

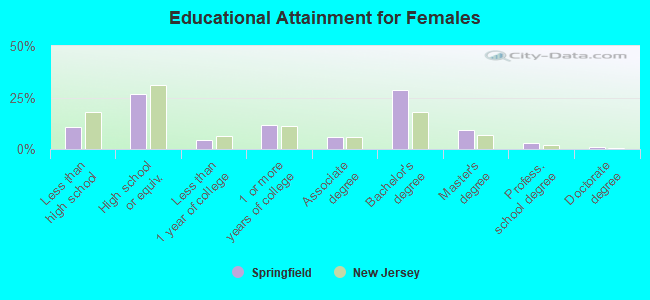
Education attainment for females 25 years and older:

  • No schooling: 36
  • Nursery to 4th grade: 22
  • 5th and 6th grade: 55
  • 7th and 8th grade: 150
  • 9th grade: 58
  • 10th grade: 68
  • 11th grade: 52
  • 12th grade, no diploma: 193
  • High school graduate (or equivalency): 1,563
  • Less than 1 year of college: 245
  • Some college more than 1 year, no degree: 672
  • Associate degree: 331
  • Bachelor's degree: 1,673
  • Master's degree: 557
  • Professional school degree: 161
  • Doctorate degree: 54
Educational Attainment for Females
Springfield marital status for males
Springfield marital status for females

Housing units in structures:

  • One, detached: 3,892
  • One, attached: 401
  • Two: 288
  • 3 or 4: 562
  • 5 to 9: 190
  • 10 to 19: 267
  • 20 to 49: 144
  • 50 or more: 460
Housing units lacking complete plumbing facilities: 0.3%

Housing units lacking complete kitchen facilities: 0.1%
Year householders moved into residence in Springfield
Houses and condos Apartments
Most commonly used house heating fuel in houses and condos in Springfield, NJ
  • 87.1%Utility gas
  • 9.5%Fuel oil, kerosene, etc.
  • 2.2%Electricity
  • 0.7%Bottled, tank, or LP gas
  • 0.2%Wood
  • 0.2%Other fuel
  • 0.2%No fuel used
Most commonly used house heating fuel in apartments in Springfield, NJ
  • 65.7%Utility gas
  • 18.1%Fuel oil, kerosene, etc.
  • 9.3%Electricity
  • 5.9%Bottled, tank, or LP gas
  • 1.0%Other fuel

Private vs. public school enrollment:

Students in private schools in grades 1 to 8 (elementary and middle school): 123
Here:

9.2%
New Jersey:

13.2%

Students in private schools in grades 9 to 12 (high school): 74
Here:

12.5%
New Jersey:

13.0%

Students in private undergraduate colleges: 217
Here:

40.5%
New Jersey:

30.1%
School Enrollment by Level of School for Male Students
School Enrollment by Level of School for Female Students
Age and Sex of Sensory-Disabled Noninstitutionalized Residents
Age and Sex of Physically-Disabled Noninstitutionalized Residents
Age and Sex of Mentally-Disabled Noninstitutionalized Residents
Age and Sex of Self-Care Disabled Noninstitutionalized Residents
Age and Sex of Go-Outside-Home Disabled Noninstitutionalized Residents
Age and Sex of Noninstitutionalized Residents with Employment Disability