Housing density: 2,910 houses/condos per square mile
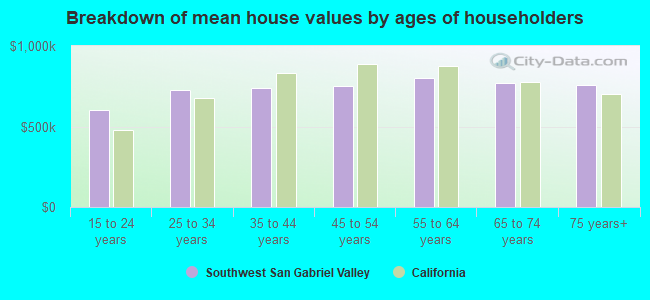
Median price asked for vacant for-sale houses and condos in 2022 in this county: $1,291,802.
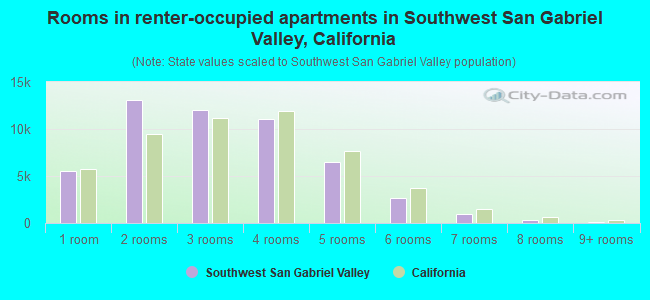
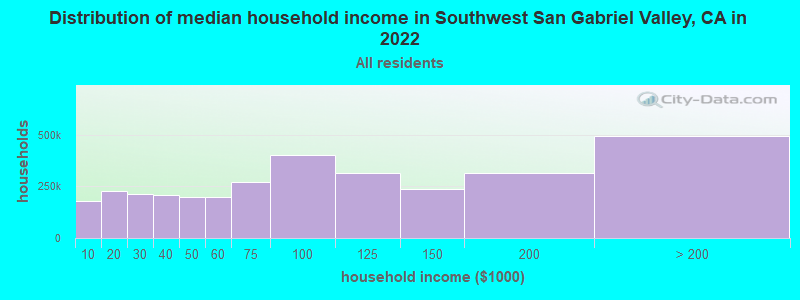
Median contract rent in 2022: $1,747 (lower quartile is $1,332, upper quartile is over $2,000)
Median rent asked for vacant for-rent units in 2022: $1,919
Median gross rent in Southwest San Gabriel Valley, CA in 2022: $1,848
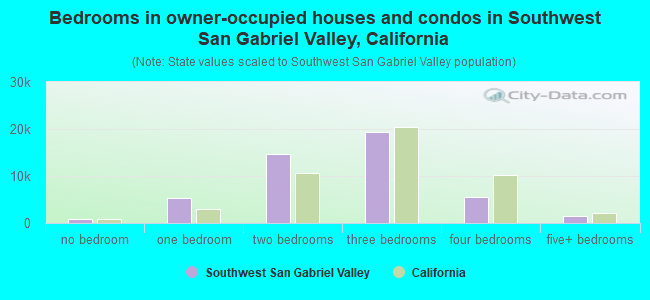
Housing units in Southwest San Gabriel Valley with a mortgage: 29,118 (2,975 second mortgage, 2,557 home equity loan, 88 both second mortgage and home equity loan) Houses without a mortgage: 13,166
Compare current foreclosures near Southwest San Gabriel Valley, CA:
In family households: 8,234,154 (1,430,848 male householders, 763,232 female householders)
1,480,665 spouses, 3,033,524 children (2,872,074 natural, 53,496 adopted, 107,954 stepchildren), 308,856 grandchildren, 205,746 brothers or sisters, 184,807 parents, foster children, 318,669 other relatives, 372,007 non-relatives
In nonfamily households: 1,412,770 (510,532 male householders (360,530 living alone)), 536,592 female householders (424,398 living alone)), 365,646 nonrelatives
In group quarters: 171,681 (68,682 institutionalized population)
1,648,001 married couples with children.
626,289 single-parent households (146,085 men, 480,204 women).
26.5% of residents of Southwest San Gabriel Valley speak English at home.
31.6% of residents speak Spanish at home (56% speak English very well, 21% speak English well, 16% speak English not well, 7% don't speak English at all).
2.4% of residents speak other Indo-European language at home (56% speak English very well, 26% speak English well, 13% speak English not well, 5% don't speak English at all).
39.0% of residents speak Asian or Pacific Island language at home (31% speak English very well, 30% speak English well, 29% speak English not well, 10% don't speak English at all).
0.5% of residents speak other language at home (64% speak English very well, 27% speak English well, 7% speak English not well, 2% don't speak English at all).
Foreign born population: 147,885 (45.3%)
(74.1% of them are naturalized citizens)
Percentage of workers working in this county: 95.3% Number of people working at home: 26,544 (17.0% of all workers)
Travel time to work (commute)
Less than 5 minutes: 1,426
5 to 9 minutes: 7,722
10 to 14 minutes: 14,464
15 to 19 minutes: 18,554
20 to 24 minutes: 19,538
25 to 29 minutes: 8,038
30 to 34 minutes: 22,591
35 to 39 minutes: 3,694
40 to 44 minutes: 6,084
45 to 59 minutes: 11,033
60 to 89 minutes: 7,439
90 or more minutes: 2,947
Means of transportation to work:
Drove a car alone: 92,316 (73.0%)
Carpooled: 20,343 (16.1%)
Bus or trolley bus: 5,910 (4.7%)
Streetcar or trolley car: 25 (0.0%)
Subway or elevated: 59 (0.0%)
Railroad: 35 (0.0%)
Taxi: 33 (0.0%)
Motorcycle: 110 (0.1%)
Bicycle: 641 (0.5%)
Walked: 3,186 (2.5%)
Other means: 872 (0.7%)
Worked at home: 2,856 (2.3%)
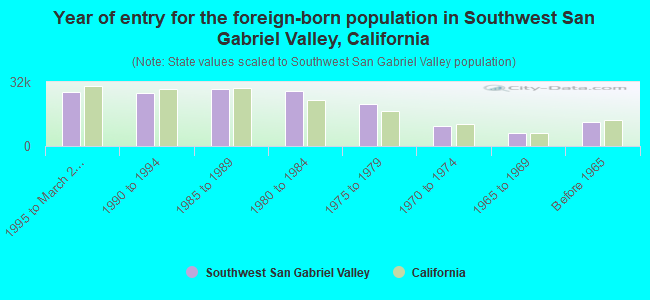
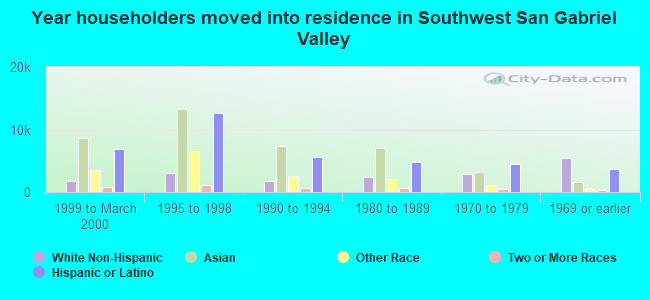
Year of entry for the foreign-born population in Southwest San Gabriel Valley, California
26,9361995 to March 2000
26,5211990 to 1994
28,4311985 to 1989
27,3481980 to 1984
20,8911975 to 1979
9,9661970 to 1974
6,5231965 to 1969
11,765Before 1965
Most common places of birth for foreign-born residents (%):
Mexico
Southwest San Gabriel Valley:
24.0% (37,962)
California:
44.3% (3,928,701)
China, excluding Hong Kong and Taiwan
Southwest San Gabriel Valley:
20.2% (32,029)
California:
3.7% (327,611)
Vietnam
Southwest San Gabriel Valley:
19.8% (31,385)
California:
4.7% (418,249)
Taiwan
Southwest San Gabriel Valley:
5.6% (8,919)
California:
1.7% (151,775)
Hong Kong
Southwest San Gabriel Valley:
4.6% (7,259)
California:
1.0% (91,101)
Philippines
Southwest San Gabriel Valley:
3.3% (5,236)
California:
7.5% (664,935)
El Salvador
Southwest San Gabriel Valley:
2.3% (3,670)
California:
4.1% (359,673)
Cambodia
Southwest San Gabriel Valley:
2.1% (3,284)
California:
0.6% (53,544)
Korea
Southwest San Gabriel Valley:
1.9% (2,989)
California:
3.0% (268,452)
Japan
Southwest San Gabriel Valley:
1.7% (2,664)
California:
1.3% (112,212)
Other South Eastern Asia
Southwest San Gabriel Valley:
1.6% (2,505)
California:
0.3% (24,106)
Place of birth for U.S.-born residents:
This state: 131,892
Other state: 27,121
Northeast: 4,624
Midwest: 7,567
South: 7,318
West: 7,612
61% of Southwest San Gabriel Valley residents lived in the same house 5 years ago. Out of people who lived in different houses, 90% lived in this county. Out of people who lived in different counties, 61% lived in California.
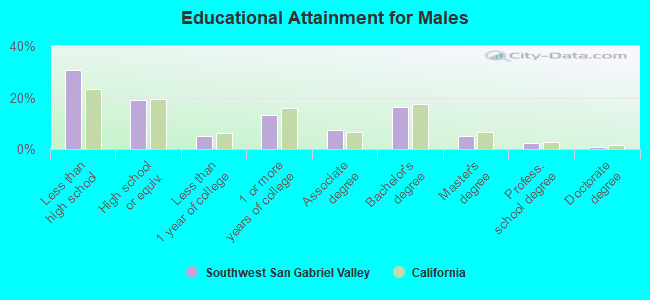
Education attainment for males 25 years and older:
No schooling: 5,573
Nursery to 4th grade: 1,795
5th and 6th grade: 4,890
7th and 8th grade: 3,479
9th grade: 2,933
10th grade: 2,160
11th grade: 2,222
12th grade, no diploma: 6,851
High school graduate (or equivalency): 18,661
Less than 1 year of college: 5,048
Some college more than 1 year, no degree: 13,008
Associate degree: 7,366
Bachelor's degree: 16,061
Master's degree: 4,840
Professional school degree: 2,203
Doctorate degree: 839
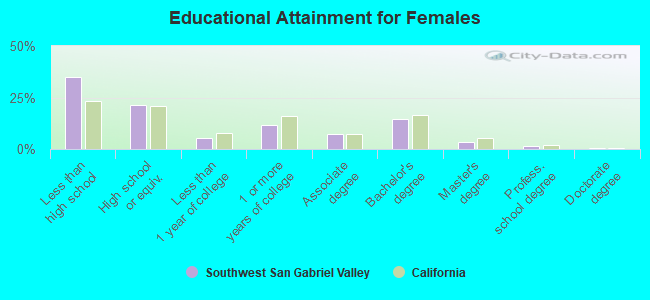
Education attainment for females 25 years and older:
No schooling: 8,763
Nursery to 4th grade: 2,705
5th and 6th grade: 6,508
7th and 8th grade: 4,779
9th grade: 3,766
10th grade: 2,764
11th grade: 2,827
12th grade, no diploma: 7,192
High school graduate (or equivalency): 24,303
Less than 1 year of college: 6,143
Some college more than 1 year, no degree: 13,003
Associate degree: 8,009
Bachelor's degree: 16,565
Master's degree: 3,906
Professional school degree: 1,607
Doctorate degree: 382
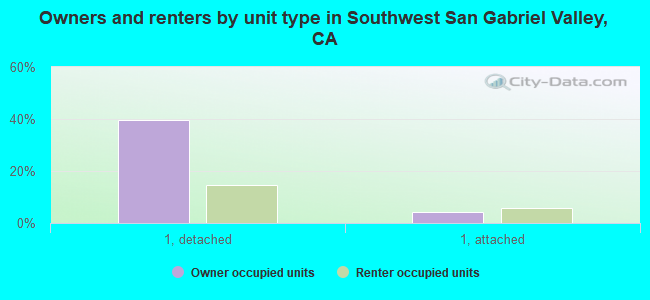
Housing units in structures:
One, detached: 55,101
One, attached: 10,385
Two: 3,332
3 or 4: 7,620
5 to 9: 9,332
10 to 19: 6,540
20 to 49: 5,638
50 or more: 3,903
Mobile homes: 708
Boats, RVs, vans, etc.: 97
Median worth of mobile homes: $85,973
Housing units lacking complete plumbing facilities: 0.9%
Housing units lacking complete kitchen facilities: 1.5%