Southwest San Gabriel Valley, California (CA) income map, earnings map, and wages data
The median household income in Southwest San Gabriel Valley, CA in 2022 was $78,535, which was 16.6% less than the median annual income of $91,551 across the entire state of California. Compared to the median income of $40,154 in 2000 this represents an increase of 48.9%. The per capita income in 2022 was $33,676, which means an increase of 52.1% compared to 2000 when it was $16,134.
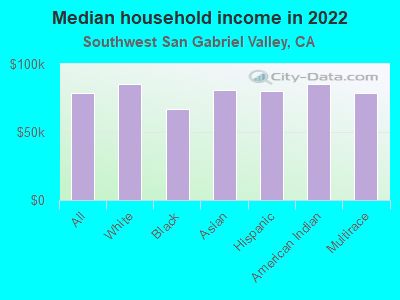
Income statistics for all residents
Median household income in Southwest San Gabriel Valley, CA in 2022:| Southwest San Gabriel Valley: | $78,536 |
| California: | $91,551 |
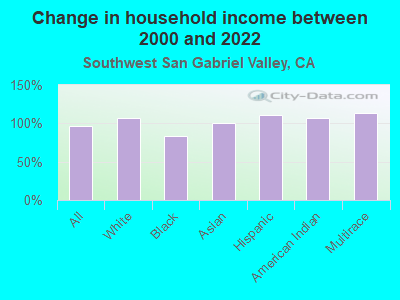
Change in median household income between 2000 and 2022:| Southwest San Gabriel Valley, California: | +95.6% |
| California: | +92.8% |
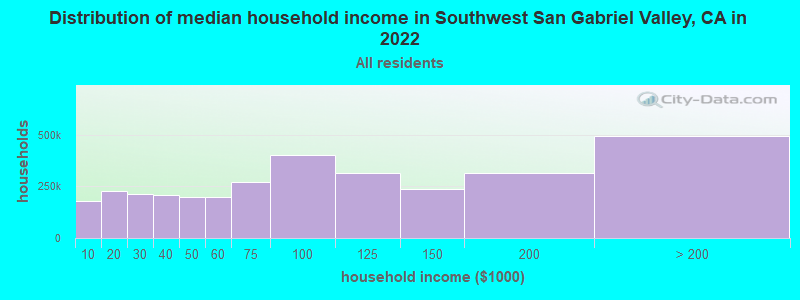
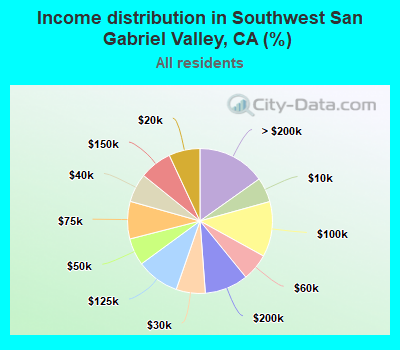
Number of households with income < $10k:| Southwest San Gabriel Valley: | 5.5% (178,965) |
| State: | 4.8% (654,370) |
Number of households with income $10k - 20k:| Southwest San Gabriel Valley: | 6.9% (225,606) |
| California: | 5.8% (789,493) |
Number of households with income $20k - 30k:| Southwest San Gabriel Valley: | 6.5% (211,670) |
| California: | 5.7% (778,318) |
Number of households with income $30k - 40k:| Southwest San Gabriel Valley: | 6.4% (208,884) |
| State: | 5.8% (783,170) |
Number of households with income $40k - 50k:| Southwest San Gabriel Valley: | 6.1% (197,496) |
| State: | 5.8% (781,352) |
Number of households with income $50k - 60k:| Southwest San Gabriel Valley: | 6.1% (197,654) |
| State: | 5.6% (760,175) |
Number of households with income $60k - 75k:| Southwest San Gabriel Valley: | 8.4% (272,266) |
| State: | 8.2% (1,104,699) |
Number of households with income $75k - 100k:| Southwest San Gabriel Valley: | 12.4% (401,871) |
| California: | 12.0% (1,627,633) |
Number of households with income $100k - 125k:| Southwest San Gabriel Valley: | 9.6% (312,212) |
| California: | 10.0% (1,358,619) |
Number of households with income $125k - 150k:| Southwest San Gabriel Valley: | 7.2% (235,529) |
| State: | 7.6% (1,027,455) |
Number of households with income $150k - 200k:| Southwest San Gabriel Valley: | 9.7% (315,514) |
| State: | 10.6% (1,439,811) |
Number of households with income > $200k:| Southwest San Gabriel Valley: | 15.2% (493,302) |
| California: | 18.0% (2,445,491) |
Aggregate household income in Southwest San Gabriel Valley in 2022: $410,815,007,900
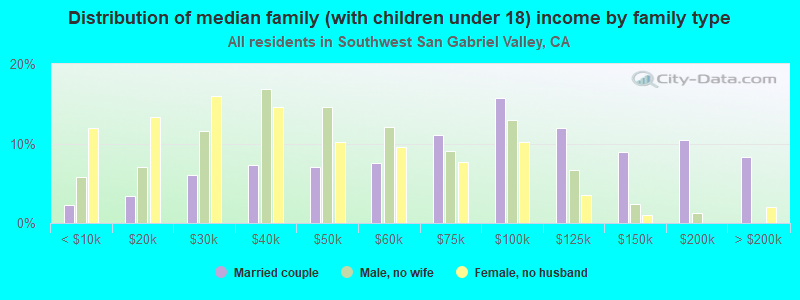
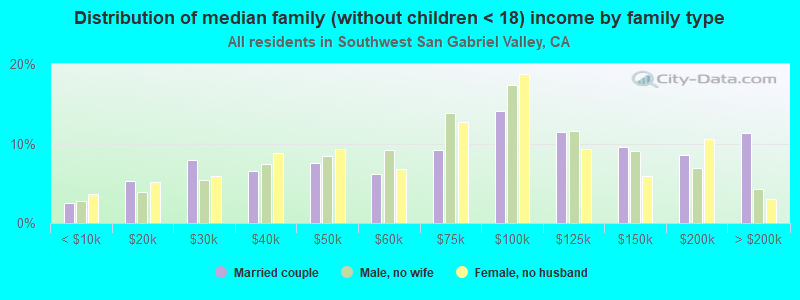
Median family income in Southwest San Gabriel Valley in 2022:| Southwest San Gabriel Valley: | $84,821 |
| State: | $104,823 |
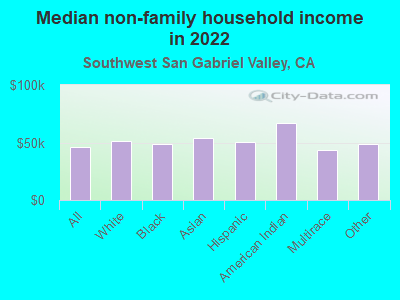
Median non-family income in Southwest San Gabriel Valley in 2022:| Southwest San Gabriel Valley: | $46,381 |
| State: | $59,348 |
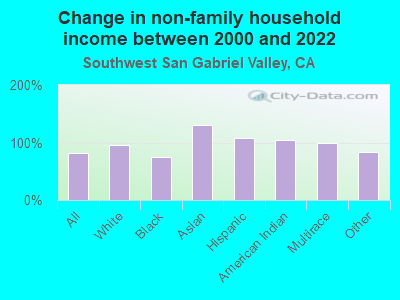
Change in median non-family income between 2000 and 2022:| Southwest San Gabriel Valley, California: | +81.8% |
| State: | +85.3% |
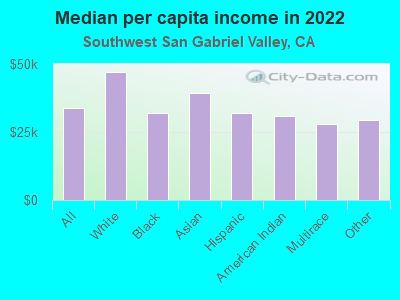
Median per capita income in Southwest San Gabriel Valley in 2022:| Southwest San Gabriel Valley: | $33,676 |
| California: | $46,661 |
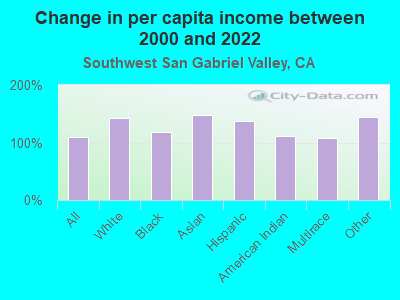
Change in median per capita income between 2000 and 2022:| Southwest San Gabriel Valley, California: | +108.7% |
| California: | +105.5% |
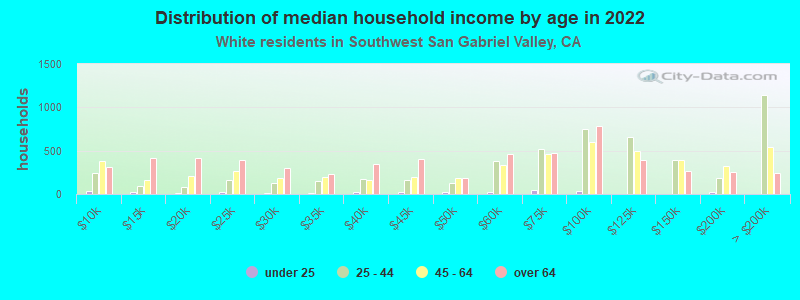
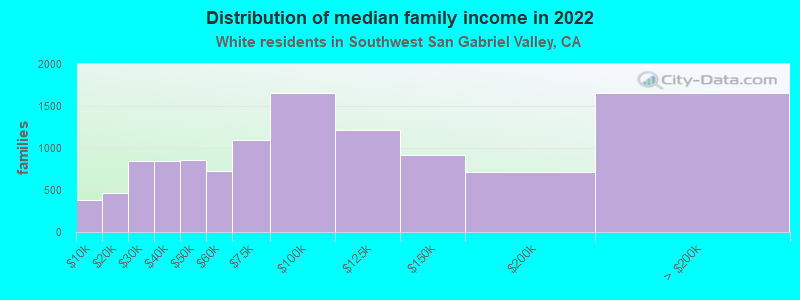
Income statistics for White residents
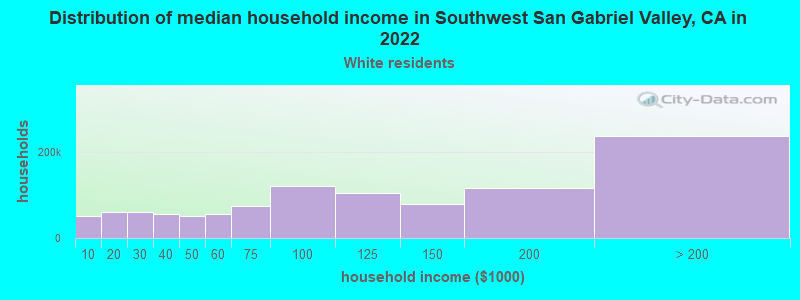
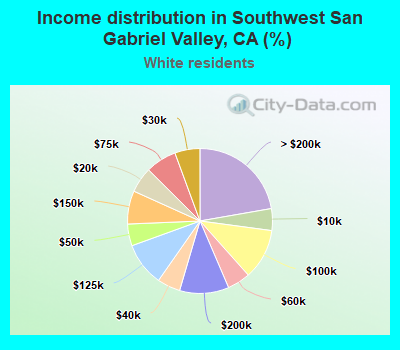
Median household income in Southwest San Gabriel Valley, CA in 2022:| Southwest San Gabriel Valley: | $85,391 |
| California: | $100,917 |
Change in median household income between 2000 and 2022:| Southwest San Gabriel Valley, California: | +107.4% |
| California: | +96.8% |
Number of households with income < $10k:| Southwest San Gabriel Valley: | 4.9% (51,564) |
| State: | 4.4% (284,109) |
Number of households with income $10k - 20k:| Southwest San Gabriel Valley: | 5.7% (60,610) |
| California: | 5.3% (340,330) |
Number of households with income $20k - 30k:| Southwest San Gabriel Valley: | 5.6% (59,486) |
| State: | 5.3% (343,145) |
Number of households with income $30k - 40k:| Southwest San Gabriel Valley: | 5.2% (54,715) |
| California: | 5.1% (330,146) |
Number of households with income $40k - 50k:| Southwest San Gabriel Valley: | 4.9% (51,760) |
| California: | 5.2% (335,310) |
Number of households with income $50k - 60k:| Southwest San Gabriel Valley: | 5.1% (54,535) |
| California: | 5.1% (326,299) |
Number of households with income $60k - 75k:| Southwest San Gabriel Valley: | 6.9% (73,481) |
| State: | 7.6% (487,640) |
Number of households with income $75k - 100k:| Southwest San Gabriel Valley: | 11.3% (119,769) |
| California: | 11.5% (736,578) |
Number of households with income $100k - 125k:| Southwest San Gabriel Valley: | 9.8% (103,508) |
| State: | 10.1% (648,782) |
Number of households with income $125k - 150k:| Southwest San Gabriel Valley: | 7.4% (78,682) |
| State: | 7.8% (499,671) |
Number of households with income $150k - 200k:| Southwest San Gabriel Valley: | 11.0% (116,738) |
| State: | 11.4% (729,603) |
Number of households with income > $200k:| Southwest San Gabriel Valley: | 22.3% (236,273) |
| State: | 21.2% (1,364,246) |
Aggregate household income in Southwest San Gabriel Valley in 2022: $171,622,223,703
Median family income in Southwest San Gabriel Valley in 2022:| Southwest San Gabriel Valley: | $104,934 |
| State: | $125,379 |
Number of families with income < $10k:| Southwest San Gabriel Valley: | 3.3% (379) |
| State: | 2.2% (87,079) |
Number of families with income $10k - 20k:| Southwest San Gabriel Valley: | 4.1% (468) |
| California: | 2.5% (97,716) |
Number of families with income $20k - 30k:| Southwest San Gabriel Valley: | 7.4% (841) |
| State: | 3.5% (137,295) |
Number of families with income $30k - 40k:| Southwest San Gabriel Valley: | 7.4% (846) |
| California: | 3.9% (152,947) |
Number of families with income $40k - 50k:| Southwest San Gabriel Valley: | 7.5% (857) |
| California: | 4.3% (169,197) |
Number of families with income $50k - 60k:| Southwest San Gabriel Valley: | 6.4% (732) |
| California: | 4.5% (176,192) |
Number of families with income $60k - 75k:| Southwest San Gabriel Valley: | 9.6% (1,096) |
| California: | 7.0% (274,752) |
Number of families with income $75k - 100k:| Southwest San Gabriel Valley: | 14.6% (1,659) |
| California: | 11.3% (445,632) |
Number of families with income $100k - 125k:| Southwest San Gabriel Valley: | 10.6% (1,209) |
| California: | 10.7% (423,630) |
Number of families with income $125k - 150k:| Southwest San Gabriel Valley: | 8.1% (915) |
| State: | 9.1% (357,408) |
Number of families with income $150k - 200k:| Southwest San Gabriel Valley: | 6.3% (711) |
| California: | 13.5% (532,693) |
Number of families with income > $200k:| Southwest San Gabriel Valley: | 14.6% (1,654) |
| State: | 27.6% (1,086,948) |
Median non-family income in Southwest San Gabriel Valley in 2022:| Southwest San Gabriel Valley: | $51,644 |
| State: | $62,819 |
Change in median non-family income between 2000 and 2022:| Southwest San Gabriel Valley, California: | +96.2% |
| California: | +84.4% |
Median per capita income in Southwest San Gabriel Valley in 2022:| Southwest San Gabriel Valley: | $47,113 |
| California: | $61,706 |
Change in median per capita income between 2000 and 2022:| Southwest San Gabriel Valley, California: | +142.5% |
| State: | +122.7% |
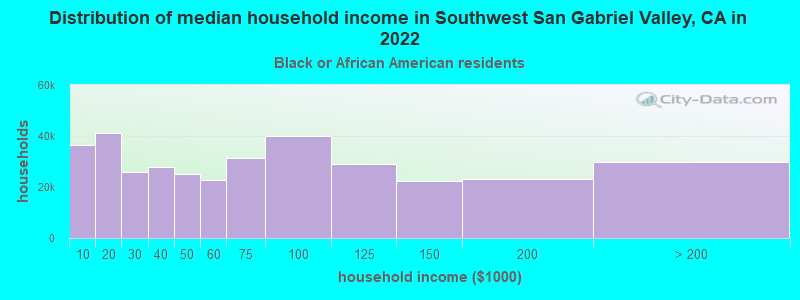
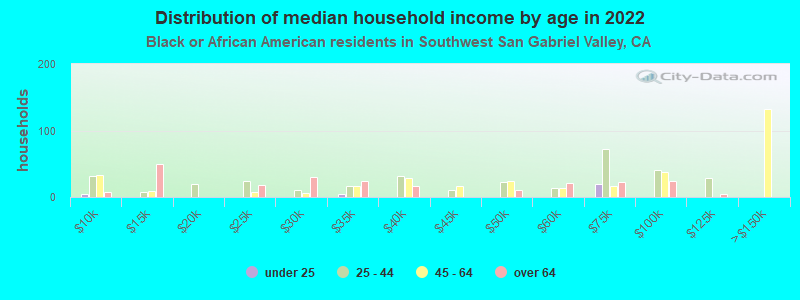
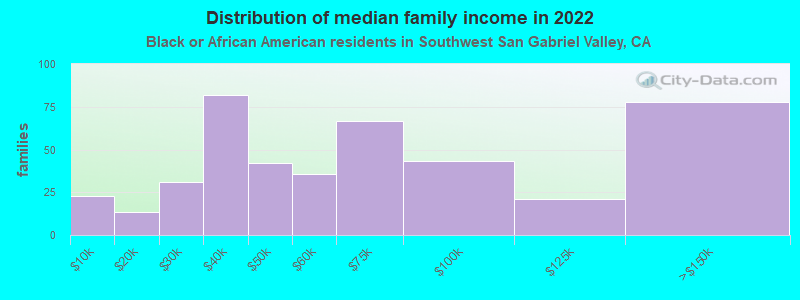
Income statistics for Black or African American residents
Median household income in Southwest San Gabriel Valley, CA in 2022:| Southwest San Gabriel Valley: | $66,651 |
| California: | $63,268 |
Change in median household income between 2000 and 2022:| Southwest San Gabriel Valley, California: | +83.6% |
| California: | +81.0% |
Number of households with income < $10k:| Southwest San Gabriel Valley: | 10.3% (36,477) |
| State: | 9.0% (73,219) |
Number of households with income $10k - 20k:| Southwest San Gabriel Valley: | 11.6% (41,093) |
| State: | 10.6% (86,666) |
Number of households with income $20k - 30k:| Southwest San Gabriel Valley: | 7.3% (25,757) |
| State: | 7.1% (57,719) |
Number of households with income $30k - 40k:| Southwest San Gabriel Valley: | 7.8% (27,792) |
| State: | 7.2% (58,714) |
Number of households with income $40k - 50k:| Southwest San Gabriel Valley: | 7.1% (25,210) |
| State: | 7.1% (58,075) |
Number of households with income $50k - 60k:| Southwest San Gabriel Valley: | 6.4% (22,837) |
| State: | 6.8% (55,229) |
Number of households with income $60k - 75k:| Southwest San Gabriel Valley: | 8.9% (31,431) |
| State: | 8.8% (71,895) |
Number of households with income $75k - 100k:| Southwest San Gabriel Valley: | 11.2% (39,912) |
| State: | 11.9% (96,893) |
Number of households with income $100k - 125k:| Southwest San Gabriel Valley: | 8.1% (28,881) |
| California: | 8.7% (70,729) |
Number of households with income $125k - 150k:| Southwest San Gabriel Valley: | 6.4% (22,544) |
| State: | 6.3% (51,211) |
Number of households with income $150k - 200k:| Southwest San Gabriel Valley: | 6.5% (23,212) |
| State: | 7.2% (58,687) |
Number of households with income > $200k:| Southwest San Gabriel Valley: | 8.4% (29,726) |
| California: | 9.3% (75,487) |
Aggregate household income in Southwest San Gabriel Valley in 2022: $493,548,891
Median family income in Southwest San Gabriel Valley in 2022:| Southwest San Gabriel Valley: | $76,879 |
| State: | $77,263 |
Number of families with income < $10k:| Southwest San Gabriel Valley: | 5.3% (23) |
| State: | 5.9% (27,037) |
Number of families with income $10k - 20k:| Southwest San Gabriel Valley: | 3.1% (14) |
| State: | 6.4% (29,505) |
Number of families with income $20k - 30k:| Southwest San Gabriel Valley: | 7.1% (31) |
| California: | 5.6% (25,755) |
Number of families with income $30k - 40k:| Southwest San Gabriel Valley: | 18.7% (82) |
| State: | 6.8% (30,948) |
Number of families with income $40k - 50k:| Southwest San Gabriel Valley: | 9.6% (42) |
| State: | 8.3% (38,171) |
Number of families with income $50k - 60k:| Southwest San Gabriel Valley: | 8.1% (35) |
| State: | 7.0% (31,860) |
Number of families with income $60k - 75k:| Southwest San Gabriel Valley: | 15.4% (67) |
| State: | 8.7% (40,021) |
Number of families with income $75k - 100k:| Southwest San Gabriel Valley: | 10.0% (44) |
| California: | 12.4% (56,846) |
Number of families with income $100k - 125k:| Southwest San Gabriel Valley: | 4.8% (21) |
| State: | 9.8% (44,911) |
Number of families with income $125k - 150k:| Southwest San Gabriel Valley: | 17.8% (78) |
| State: | 7.5% (34,434) |
Median non-family income in Southwest San Gabriel Valley in 2022:| Southwest San Gabriel Valley: | $48,963 |
| State: | $41,942 |
Change in median non-family income between 2000 and 2022:| Southwest San Gabriel Valley, California: | +73.5% |
| State: | +72.0% |
Median per capita income in Southwest San Gabriel Valley in 2022:| Southwest San Gabriel Valley: | $31,889 |
| California: | $36,708 |
Change in median per capita income between 2000 and 2022:| Southwest San Gabriel Valley, California: | +117.9% |
| California: | +110.4% |
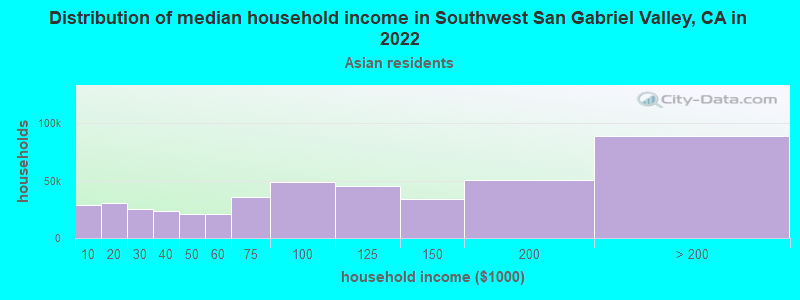
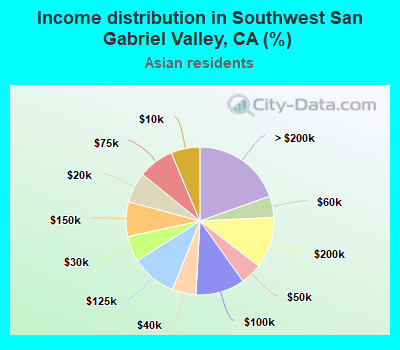
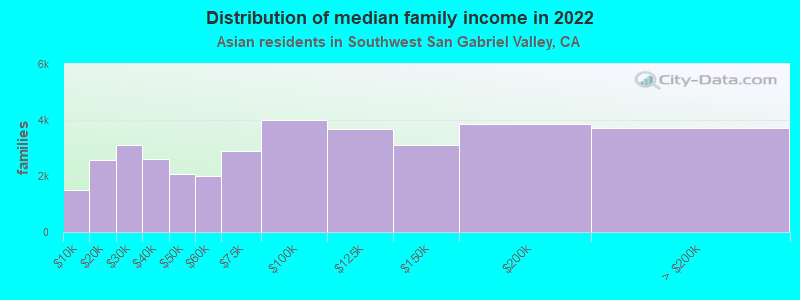
Income statistics for Asian residents
Median household income in Southwest San Gabriel Valley, CA in 2022:| Southwest San Gabriel Valley: | $81,236 |
| State: | $119,861 |
Change in median household income between 2000 and 2022:| Southwest San Gabriel Valley, California: | +101.1% |
| State: | +116.5% |
Number of households with income < $10k:| Southwest San Gabriel Valley: | 6.3% (28,769) |
| State: | 5.1% (106,273) |
Number of households with income $10k - 20k:| Southwest San Gabriel Valley: | 6.6% (30,172) |
| California: | 4.9% (101,815) |
Number of households with income $20k - 30k:| Southwest San Gabriel Valley: | 5.6% (25,524) |
| State: | 4.6% (94,414) |
Number of households with income $30k - 40k:| Southwest San Gabriel Valley: | 5.2% (23,614) |
| State: | 4.1% (84,491) |
Number of households with income $40k - 50k:| Southwest San Gabriel Valley: | 4.7% (21,324) |
| California: | 4.0% (81,758) |
Number of households with income $50k - 60k:| Southwest San Gabriel Valley: | 4.7% (21,192) |
| State: | 3.9% (80,971) |
Number of households with income $60k - 75k:| Southwest San Gabriel Valley: | 7.8% (35,473) |
| State: | 6.0% (124,194) |
Number of households with income $75k - 100k:| Southwest San Gabriel Valley: | 10.8% (48,831) |
| California: | 9.7% (200,337) |
Number of households with income $100k - 125k:| Southwest San Gabriel Valley: | 9.9% (45,038) |
| California: | 9.4% (193,488) |
Number of households with income $125k - 150k:| Southwest San Gabriel Valley: | 7.6% (34,418) |
| State: | 7.7% (158,253) |
Number of households with income $150k - 200k:| Southwest San Gabriel Valley: | 11.2% (50,878) |
| State: | 12.2% (252,139) |
Number of households with income > $200k:| Southwest San Gabriel Valley: | 19.6% (88,892) |
| State: | 28.4% (586,641) |
Aggregate household income in Southwest San Gabriel Valley in 2022: $71,811,354,656
Median family income in Southwest San Gabriel Valley in 2022:| Southwest San Gabriel Valley: | $88,104 |
| State: | $136,040 |
Number of families with income < $10k:| Southwest San Gabriel Valley: | 4.2% (1,485) |
| California: | 2.8% (42,046) |
Number of families with income $10k - 20k:| Southwest San Gabriel Valley: | 7.3% (2,578) |
| California: | 3.1% (46,821) |
Number of families with income $20k - 30k:| Southwest San Gabriel Valley: | 8.9% (3,121) |
| State: | 4.1% (61,519) |
Number of families with income $30k - 40k:| Southwest San Gabriel Valley: | 7.4% (2,617) |
| State: | 3.7% (55,234) |
Number of families with income $40k - 50k:| Southwest San Gabriel Valley: | 5.9% (2,065) |
| State: | 3.9% (58,471) |
Number of families with income $50k - 60k:| Southwest San Gabriel Valley: | 5.7% (2,013) |
| State: | 3.9% (58,911) |
Number of families with income $60k - 75k:| Southwest San Gabriel Valley: | 8.2% (2,879) |
| State: | 5.9% (88,675) |
Number of families with income $75k - 100k:| Southwest San Gabriel Valley: | 11.3% (3,986) |
| State: | 9.5% (143,103) |
Number of families with income $100k - 125k:| Southwest San Gabriel Valley: | 10.5% (3,688) |
| State: | 9.4% (142,085) |
Number of families with income $125k - 150k:| Southwest San Gabriel Valley: | 8.9% (3,118) |
| State: | 8.0% (120,635) |
Number of families with income $150k - 200k:| Southwest San Gabriel Valley: | 11.0% (3,853) |
| State: | 13.2% (198,099) |
Number of families with income > $200k:| Southwest San Gabriel Valley: | 10.6% (3,725) |
| State: | 32.5% (489,303) |
Median non-family income in Southwest San Gabriel Valley in 2022:| Southwest San Gabriel Valley: | $54,110 |
| State: | $74,216 |
Change in median non-family income between 2000 and 2022:| Southwest San Gabriel Valley, California: | +131.1% |
| State: | +136.3% |
Median per capita income in Southwest San Gabriel Valley in 2022:| Southwest San Gabriel Valley: | $39,293 |
| State: | $58,824 |
Change in median per capita income between 2000 and 2022:| Southwest San Gabriel Valley, California: | +148.4% |
| State: | +166.8% |
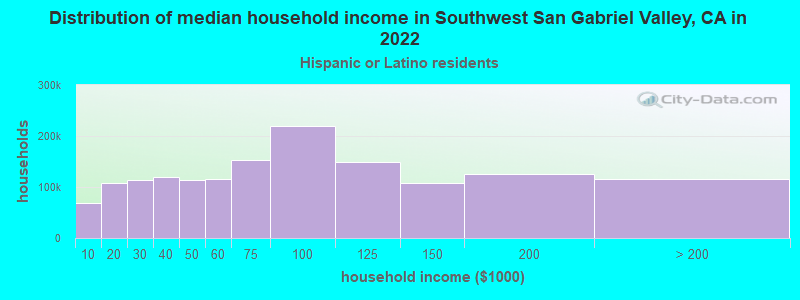
Income statistics for Hispanic or Latino residents
Median household income in Southwest San Gabriel Valley, CA in 2022:| Southwest San Gabriel Valley: | $80,321 |
| State: | $75,698 |
Change in median household income between 2000 and 2022:| Southwest San Gabriel Valley, California: | +110.8% |
| State: | +107.2% |
Number of households with income < $10k:| Southwest San Gabriel Valley: | 4.5% (67,774) |
| California: | 4.3% (183,294) |
Number of households with income $10k - 20k:| Southwest San Gabriel Valley: | 7.1% (107,097) |
| State: | 6.0% (253,903) |
Number of households with income $20k - 30k:| Southwest San Gabriel Valley: | 7.6% (114,624) |
| California: | 6.8% (286,386) |
Number of households with income $30k - 40k:| Southwest San Gabriel Valley: | 7.9% (119,310) |
| State: | 7.4% (313,728) |
Number of households with income $40k - 50k:| Southwest San Gabriel Valley: | 7.5% (113,040) |
| State: | 7.4% (313,199) |
Number of households with income $50k - 60k:| Southwest San Gabriel Valley: | 7.6% (114,742) |
| State: | 7.2% (305,366) |
Number of households with income $60k - 75k:| Southwest San Gabriel Valley: | 10.1% (152,583) |
| State: | 10.3% (434,937) |
Number of households with income $75k - 100k:| Southwest San Gabriel Valley: | 14.6% (220,509) |
| California: | 14.4% (607,302) |
Number of households with income $100k - 125k:| Southwest San Gabriel Valley: | 9.9% (148,966) |
| State: | 10.6% (447,424) |
Number of households with income $125k - 150k:| Southwest San Gabriel Valley: | 7.2% (108,775) |
| State: | 7.5% (316,022) |
Number of households with income $150k - 200k:| Southwest San Gabriel Valley: | 8.3% (124,513) |
| State: | 9.2% (386,269) |
Number of households with income > $200k:| Southwest San Gabriel Valley: | 7.6% (115,117) |
| State: | 8.8% (372,651) |
Aggregate household income in Southwest San Gabriel Valley in 2022: $102,095,885,035
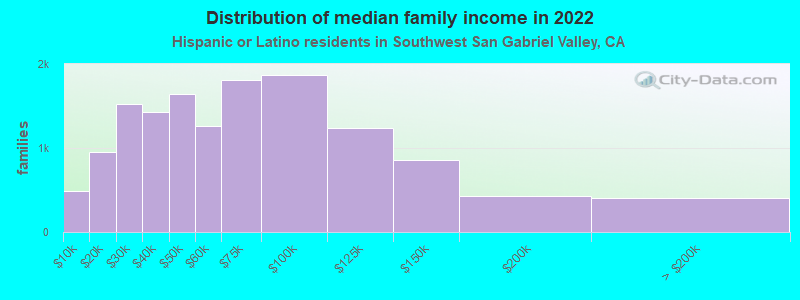
Median family income in Southwest San Gabriel Valley in 2022:| Southwest San Gabriel Valley: | $85,089 |
| California: | $77,589 |
Number of families with income < $10k:| Southwest San Gabriel Valley: | 3.5% (487) |
| California: | 3.9% (129,468) |
Number of families with income $10k - 20k:| Southwest San Gabriel Valley: | 6.8% (952) |
| State: | 4.6% (151,997) |
Number of families with income $20k - 30k:| Southwest San Gabriel Valley: | 11.0% (1,529) |
| State: | 6.6% (216,764) |
Number of families with income $30k - 40k:| Southwest San Gabriel Valley: | 10.3% (1,427) |
| State: | 7.6% (249,849) |
Number of families with income $40k - 50k:| Southwest San Gabriel Valley: | 11.8% (1,643) |
| California: | 7.7% (254,822) |
Number of families with income $50k - 60k:| Southwest San Gabriel Valley: | 9.0% (1,256) |
| State: | 7.4% (244,815) |
Number of families with income $60k - 75k:| Southwest San Gabriel Valley: | 13.0% (1,815) |
| State: | 10.5% (345,838) |
Number of families with income $75k - 100k:| Southwest San Gabriel Valley: | 13.5% (1,873) |
| State: | 14.9% (491,589) |
Number of families with income $100k - 125k:| Southwest San Gabriel Valley: | 8.9% (1,238) |
| California: | 10.7% (355,400) |
Number of families with income $125k - 150k:| Southwest San Gabriel Valley: | 6.1% (853) |
| State: | 7.8% (259,317) |
Number of families with income $150k - 200k:| Southwest San Gabriel Valley: | 3.1% (429) |
| California: | 9.3% (306,566) |
Number of families with income > $200k:| Southwest San Gabriel Valley: | 3.0% (410) |
| State: | 9.1% (299,984) |
Median non-family income in Southwest San Gabriel Valley in 2022:| Southwest San Gabriel Valley: | $50,742 |
| California: | $49,746 |
Change in median non-family income between 2000 and 2022:| Southwest San Gabriel Valley, California: | +107.5% |
| California: | +100.7% |
Median per capita income in Southwest San Gabriel Valley in 2022:| Southwest San Gabriel Valley: | $32,020 |
| California: | $27,240 |
Change in median per capita income between 2000 and 2022:| Southwest San Gabriel Valley, California: | +138.1% |
| State: | +133.3% |
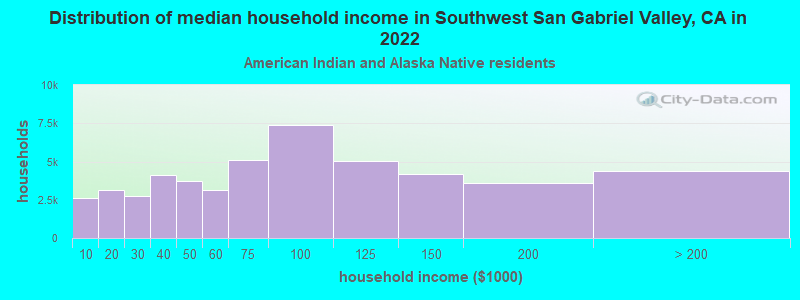
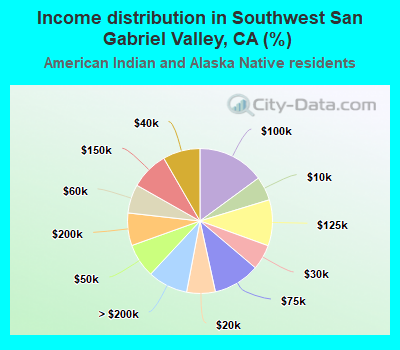
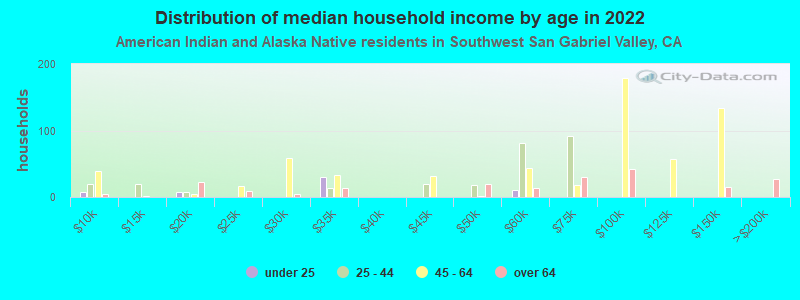
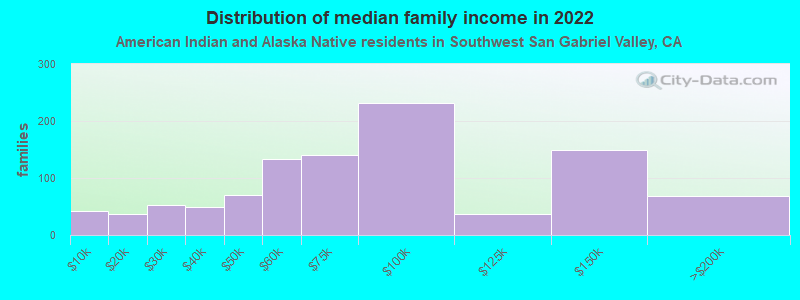
Income statistics for American Indian and Alaska Native residents
Median household income in Southwest San Gabriel Valley, CA in 2022:| Southwest San Gabriel Valley: | $85,213 |
| State: | $76,752 |
Change in median household income between 2000 and 2022:| Southwest San Gabriel Valley, California: | +106.6% |
| State: | +110.0% |
Number of households with income < $10k:| Southwest San Gabriel Valley: | 5.4% (2,645) |
| State: | 5.4% (8,471) |
Number of households with income $10k - 20k:| Southwest San Gabriel Valley: | 6.4% (3,151) |
| California: | 6.0% (9,381) |
Number of households with income $20k - 30k:| Southwest San Gabriel Valley: | 5.6% (2,777) |
| State: | 5.5% (8,668) |
Number of households with income $30k - 40k:| Southwest San Gabriel Valley: | 8.3% (4,096) |
| California: | 8.3% (13,030) |
Number of households with income $40k - 50k:| Southwest San Gabriel Valley: | 7.6% (3,740) |
| State: | 6.9% (10,908) |
Number of households with income $50k - 60k:| Southwest San Gabriel Valley: | 6.4% (3,160) |
| California: | 7.1% (11,198) |
Number of households with income $60k - 75k:| Southwest San Gabriel Valley: | 10.4% (5,129) |
| California: | 9.6% (15,190) |
Number of households with income $75k - 100k:| Southwest San Gabriel Valley: | 14.9% (7,355) |
| State: | 14.1% (22,274) |
Number of households with income $100k - 125k:| Southwest San Gabriel Valley: | 10.3% (5,057) |
| State: | 11.2% (17,643) |
Number of households with income $125k - 150k:| Southwest San Gabriel Valley: | 8.5% (4,181) |
| State: | 8.3% (13,117) |
Number of households with income $150k - 200k:| Southwest San Gabriel Valley: | 7.3% (3,590) |
| State: | 8.8% (13,853) |
Number of households with income > $200k:| Southwest San Gabriel Valley: | 8.9% (4,405) |
| California: | 8.8% (13,925) |
Aggregate household income in Southwest San Gabriel Valley in 2022: $128,252,619
Median family income in Southwest San Gabriel Valley in 2022:| Southwest San Gabriel Valley: | $72,417 |
| State: | $81,108 |
Number of families with income < $10k:| Southwest San Gabriel Valley: | 4.2% (42) |
| State: | 5.0% (5,711) |
Number of families with income $10k - 20k:| Southwest San Gabriel Valley: | 3.5% (36) |
| State: | 3.7% (4,148) |
Number of families with income $20k - 30k:| Southwest San Gabriel Valley: | 5.2% (53) |
| California: | 4.3% (4,876) |
Number of families with income $30k - 40k:| Southwest San Gabriel Valley: | 5.0% (50) |
| California: | 8.8% (9,994) |
Number of families with income $40k - 50k:| Southwest San Gabriel Valley: | 6.9% (70) |
| State: | 7.8% (8,776) |
Number of families with income $50k - 60k:| Southwest San Gabriel Valley: | 13.3% (134) |
| State: | 6.9% (7,834) |
Number of families with income $60k - 75k:| Southwest San Gabriel Valley: | 13.8% (140) |
| State: | 9.1% (10,247) |
Number of families with income $75k - 100k:| Southwest San Gabriel Valley: | 22.9% (231) |
| State: | 14.8% (16,731) |
Number of families with income $100k - 125k:| Southwest San Gabriel Valley: | 3.6% (37) |
| California: | 12.0% (13,609) |
Number of families with income $125k - 150k:| Southwest San Gabriel Valley: | 14.8% (150) |
| State: | 8.0% (9,104) |
Number of families with income $150k - 200k:| Southwest San Gabriel Valley: | 6.8% (69) |
| California: | 9.5% (10,721) |
Median non-family income in Southwest San Gabriel Valley in 2022:| Southwest San Gabriel Valley: | $67,381 |
| State: | $51,296 |
Change in median non-family income between 2000 and 2022:| Southwest San Gabriel Valley, California: | +103.8% |
| State: | +114.0% |
Median per capita income in Southwest San Gabriel Valley in 2022:| Southwest San Gabriel Valley: | $30,717 |
| State: | $30,289 |
Change in median per capita income between 2000 and 2022:| Southwest San Gabriel Valley, California: | +111.4% |
| State: | +98.9% |
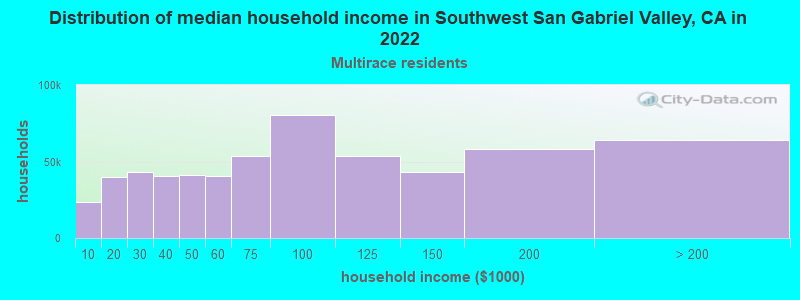
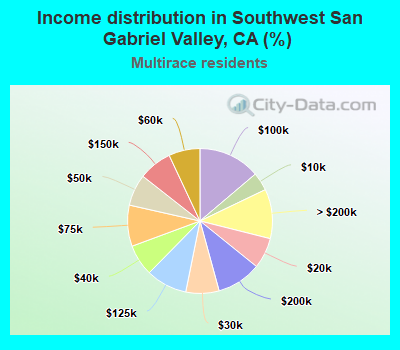
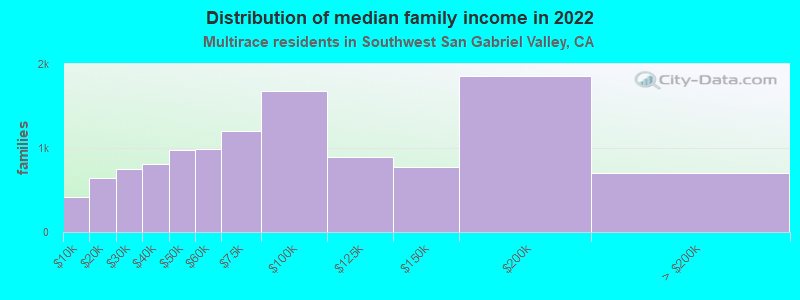
Income statistics for Multirace residents
Median household income in Southwest San Gabriel Valley, CA in 2022:| Southwest San Gabriel Valley: | $78,411 |
| State: | $83,153 |
Change in median household income between 2000 and 2022:| Southwest San Gabriel Valley, California: | +112.7% |
| California: | +106.0% |
Number of households with income < $10k:| Southwest San Gabriel Valley: | 4.1% (23,733) |
| State: | 4.2% (85,299) |
Number of households with income $10k - 20k:| Southwest San Gabriel Valley: | 6.9% (40,058) |
| State: | 6.1% (122,966) |
Number of households with income $20k - 30k:| Southwest San Gabriel Valley: | 7.4% (43,293) |
| State: | 6.4% (129,328) |
Number of households with income $30k - 40k:| Southwest San Gabriel Valley: | 7.0% (40,804) |
| State: | 6.4% (130,070) |
Number of households with income $40k - 50k:| Southwest San Gabriel Valley: | 7.0% (41,077) |
| State: | 6.5% (131,254) |
Number of households with income $50k - 60k:| Southwest San Gabriel Valley: | 7.0% (40,617) |
| California: | 6.5% (132,382) |
Number of households with income $60k - 75k:| Southwest San Gabriel Valley: | 9.2% (53,523) |
| State: | 9.4% (191,472) |
Number of households with income $75k - 100k:| Southwest San Gabriel Valley: | 13.8% (80,527) |
| California: | 13.3% (269,691) |
Number of households with income $100k - 125k:| Southwest San Gabriel Valley: | 9.2% (53,530) |
| State: | 10.2% (207,286) |
Number of households with income $125k - 150k:| Southwest San Gabriel Valley: | 7.4% (43,333) |
| California: | 7.8% (158,259) |
Number of households with income $150k - 200k:| Southwest San Gabriel Valley: | 9.9% (57,978) |
| State: | 10.3% (209,227) |
Number of households with income > $200k:| Southwest San Gabriel Valley: | 11.0% (64,311) |
| State: | 13.0% (263,210) |
Aggregate household income in Southwest San Gabriel Valley in 2022: $5,127,413,128
Median family income in Southwest San Gabriel Valley in 2022:| Southwest San Gabriel Valley: | $82,476 |
| State: | $87,642 |
Number of families with income < $10k:| Southwest San Gabriel Valley: | 3.5% (411) |
| California: | 3.2% (48,017) |
Number of families with income $10k - 20k:| Southwest San Gabriel Valley: | 5.5% (643) |
| State: | 4.1% (60,419) |
Number of families with income $20k - 30k:| Southwest San Gabriel Valley: | 6.4% (745) |
| State: | 6.1% (89,742) |
Number of families with income $30k - 40k:| Southwest San Gabriel Valley: | 7.0% (814) |
| California: | 6.2% (91,415) |
Number of families with income $40k - 50k:| Southwest San Gabriel Valley: | 8.4% (976) |
| State: | 6.8% (100,085) |
Number of families with income $50k - 60k:| Southwest San Gabriel Valley: | 8.5% (986) |
| State: | 6.7% (98,298) |
Number of families with income $60k - 75k:| Southwest San Gabriel Valley: | 10.3% (1,198) |
| California: | 9.5% (140,131) |
Number of families with income $75k - 100k:| Southwest San Gabriel Valley: | 14.4% (1,676) |
| California: | 13.8% (203,439) |
Number of families with income $100k - 125k:| Southwest San Gabriel Valley: | 7.6% (887) |
| California: | 10.4% (153,515) |
Number of families with income $125k - 150k:| Southwest San Gabriel Valley: | 6.6% (773) |
| State: | 8.4% (124,115) |
Number of families with income $150k - 200k:| Southwest San Gabriel Valley: | 15.9% (1,857) |
| State: | 10.9% (161,643) |
Number of families with income > $200k:| Southwest San Gabriel Valley: | 6.0% (703) |
| State: | 14.0% (207,317) |
Median non-family income in Southwest San Gabriel Valley in 2022:| Southwest San Gabriel Valley: | $43,660 |
| State: | $56,558 |
Change in median non-family income between 2000 and 2022:| Southwest San Gabriel Valley, California: | +100.0% |
| State: | +100.2% |
Median per capita income in Southwest San Gabriel Valley in 2022:| Southwest San Gabriel Valley: | $28,090 |
| California: | $32,124 |
Change in median per capita income between 2000 and 2022:| Southwest San Gabriel Valley, California: | +108.4% |
| State: | +120.4% |
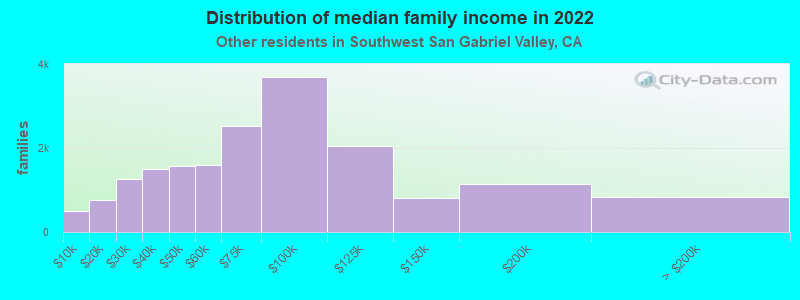
Income statistics for other residents
Number of households with income < $10k:| Southwest San Gabriel Valley: | 5.1% (11,896) |
| California: | 4.6% (93,035) |
Number of households with income $10k - 20k:| Southwest San Gabriel Valley: | 7.4% (17,466) |
| State: | 6.3% (126,222) |
Number of households with income $20k - 30k:| Southwest San Gabriel Valley: | 7.8% (18,358) |
| State: | 7.1% (142,656) |
Number of households with income $30k - 40k:| Southwest San Gabriel Valley: | 8.5% (20,046) |
| State: | 8.2% (165,018) |
Number of households with income $40k - 50k:| Southwest San Gabriel Valley: | 7.9% (18,705) |
| California: | 8.0% (161,732) |
Number of households with income $50k - 60k:| Southwest San Gabriel Valley: | 8.0% (18,855) |
| State: | 7.6% (152,152) |
Number of households with income $60k - 75k:| Southwest San Gabriel Valley: | 10.4% (24,613) |
| State: | 10.4% (209,951) |
Number of households with income $75k - 100k:| Southwest San Gabriel Valley: | 14.7% (34,585) |
| State: | 14.7% (296,102) |
Number of households with income $100k - 125k:| Southwest San Gabriel Valley: | 10.0% (23,540) |
| California: | 10.7% (214,281) |
Number of households with income $125k - 150k:| Southwest San Gabriel Valley: | 6.9% (16,170) |
| State: | 7.1% (143,092) |
Number of households with income $150k - 200k:| Southwest San Gabriel Valley: | 7.5% (17,626) |
| California: | 8.6% (172,215) |
Number of households with income > $200k:| Southwest San Gabriel Valley: | 5.8% (13,682) |
| California: | 6.7% (134,102) |
Aggregate household income in Southwest San Gabriel Valley in 2022: $19,779,262,597
Median family income in Southwest San Gabriel Valley in 2022:| Southwest San Gabriel Valley: | $80,802 |
| State: | $72,756 |
Number of families with income < $10k:| Southwest San Gabriel Valley: | 2.7% (493) |
| State: | 4.3% (69,090) |
Number of families with income $10k - 20k:| Southwest San Gabriel Valley: | 4.2% (758) |
| California: | 5.1% (82,116) |
Number of families with income $20k - 30k:| Southwest San Gabriel Valley: | 6.9% (1,256) |
| State: | 7.0% (112,854) |
Number of families with income $30k - 40k:| Southwest San Gabriel Valley: | 8.2% (1,504) |
| State: | 8.4% (135,938) |
Number of families with income $40k - 50k:| Southwest San Gabriel Valley: | 8.6% (1,579) |
| State: | 8.4% (135,353) |
Number of families with income $50k - 60k:| Southwest San Gabriel Valley: | 8.7% (1,593) |
| State: | 7.7% (124,826) |
Number of families with income $60k - 75k:| Southwest San Gabriel Valley: | 13.9% (2,533) |
| State: | 10.7% (173,628) |
Number of families with income $75k - 100k:| Southwest San Gabriel Valley: | 20.2% (3,687) |
| California: | 15.2% (245,724) |
Number of families with income $100k - 125k:| Southwest San Gabriel Valley: | 11.2% (2,051) |
| California: | 10.9% (176,716) |
Number of families with income $125k - 150k:| Southwest San Gabriel Valley: | 4.5% (818) |
| California: | 7.4% (119,985) |
Number of families with income $150k - 200k:| Southwest San Gabriel Valley: | 6.3% (1,153) |
| State: | 8.5% (137,332) |
Number of families with income > $200k:| Southwest San Gabriel Valley: | 4.5% (830) |
| State: | 6.6% (106,346) |
Median non-family income in Southwest San Gabriel Valley in 2022:| Southwest San Gabriel Valley: | $48,959 |
| State: | $43,881 |
Change in median non-family income between 2000 and 2022:| Southwest San Gabriel Valley, California: | +84.3% |
| State: | +84.6% |
Median per capita income in Southwest San Gabriel Valley in 2022:| Southwest San Gabriel Valley: | $29,564 |
| State: | $25,164 |
Change in median per capita income between 2000 and 2022:| Southwest San Gabriel Valley, California: | +144.3% |
| State: | +137.9% |