Southeast Nolichucky, TN (Tennessee) Houses and Residents
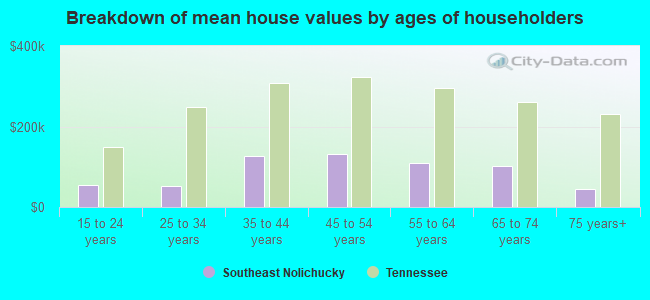
| Southeast Nolichucky: | $182,573 |
| Tennessee: | $284,800 |
Total population: 7,078 (Urban population: 0, Rural population: 6,775 (889 farm, 5,886 nonfarm))
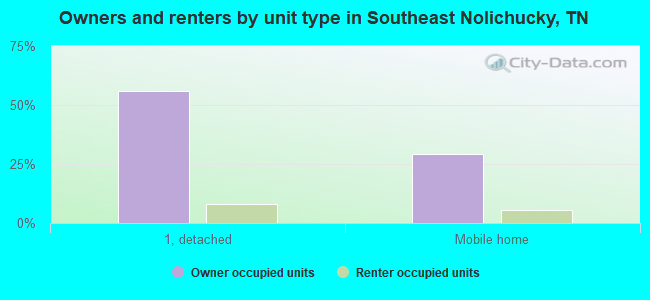
Houses: 2,927 (2,680 occupied: 2,287 owner occupied, 393 renter occupied)
| % of renters here: | 15% |
| State: | 33% |
Housing density: 25 houses/condos per square mile
Median price asked for vacant for-sale houses and condos in 2022 in this county: $235,663.
Median contract rent in 2022: $408 (lower quartile is $330, upper quartile is $559)
Median rent asked for vacant for-rent units in 2022: $393
Median gross rent in Southeast Nolichucky, TN in 2022: $571
Housing units in Southeast Nolichucky with a mortgage: 525 (29 second mortgage, 37 home equity loan, 11 both second mortgage and home equity loan)
Houses without a mortgage: 452
Compare current foreclosures near Southeast Nolichucky, TN:
| Photo | Address | Area | Beds / Baths | Price | Details |
|---|---|---|---|---|---|

|
#1
Ted Brown Rd
Chuckey, TN 37641
|
1,577 sq. feet
|
1 baths 4 beds |
show details | |

|
#2
Wagon Wheel Rd
Marshall, NC 28753
|
756 sq. feet
|
1 baths 2 beds |
show details | |

|
#3
Love Station Rd
Erwin, TN 37650
|
864 sq. feet
|
1 baths 2 beds |
show details | |

|
#4
Scenic Dr
Greeneville, TN 37743
|
1,117 sq. feet
|
1 baths 3 beds |
show details | |

|
#5
Hardin Dr
Jonesborough, TN 37659
|
1,344 sq. feet
|
1 baths - beds |
show details | |

|
#6
Old Tusculum Rd
Greeneville, TN 37745
|
1,455 sq. feet
|
2 baths - beds |
show details | |

|
#7
Crockett Timbers Rd
Limestone, TN 37681
|
1,092 sq. feet
|
1 baths - beds |
show details | |

|
#8
Davy Crockett Park Rd
Limestone, TN 37681
|
1,470 sq. feet
|
1 baths - beds |
show details | |

|
#9
Kingsport Hwy
Afton, TN 37616
|
840 sq. feet
|
1 baths - beds |
show details | |

|
#10
Fairview Rd
Afton, TN 37616
|
1,152 sq. feet
|
2 baths - beds |
show details |
| Photo | Address | Area | Beds / Baths | Price | Details |
|---|---|---|---|---|---|

|
#11
Pike Rd
Greeneville, TN 37745
|
1,188 sq. feet
|
2 baths - beds |
show details | |

|
#12
Houston Valley Rd
Greeneville, TN 37743
|
1,092 sq. feet
|
1 baths - beds |
show details | |

|
#13
W School St
Mosheim, TN 37818
|
1,380 sq. feet
|
1 baths - beds |
show details | |

|
#14
Corby Bridge Rd
Chuckey, TN 37641
|
1,344 sq. feet
|
2 baths - beds |
show details | |

|
#15
Kingsport Hwy
Afton, TN 37616
|
1,780 sq. feet
|
2 baths - beds |
show details | |

|
#16
Humphreys Rd
Greeneville, TN 37743
|
1,612 sq. feet
|
2 baths - beds |
show details | |

|
#17
Fillers Mill Rd
Greeneville, TN 37743
|
1,456 sq. feet
|
2 baths - beds |
show details | |

|
#18
E Brad St
Greeneville, TN 37743
|
1,075 sq. feet
|
1 baths - beds |
show details | |

|
#19
Cutshall Ave
Greeneville, TN 37743
|
1,300 sq. feet
|
1 baths - beds |
show details | |

|
#20
Floral St
Greeneville, TN 37743
|
1,232 sq. feet
|
1 baths - beds |
show details |
| Photo | Address | Area | Beds / Baths | Price | Details |
|---|---|---|---|---|---|

|
#21
Bowmantown Rd
Telford, TN 37690
|
1,812 sq. feet
|
2 baths - beds |
show details | |

|
#22
Poplar Springs Rd
Greeneville, TN 37743
|
984 sq. feet
|
1 baths - beds |
show details | |

|
#23
Gilland Way
Greeneville, TN 37743
|
1,218 sq. feet
|
1 baths - beds |
show details | |

|
#24
Hillrise Dr
Jonesborough, TN 37659
|
1,112 sq. feet
|
1 baths - beds |
show details | |

|
#25
Old Snapps Ferry Rd
Chuckey, TN 37641
|
1,620 sq. feet
|
2 baths - beds |
show details | |

|
#26
Milburnton Rd
Limestone, TN 37681
|
1,728 sq. feet
|
1 baths - beds |
show details | |

|
#27
Colvert Rd
Greeneville, TN 37743
|
1,860 sq. feet
|
2 baths - beds |
show details | |

|
#28
W Pines Rd
Afton, TN 37616
|
750 sq. feet
|
1 baths - beds |
show details | |

|
#29
W Hogan Ln
Greeneville, TN 37743
|
1,196 sq. feet
|
2 baths - beds |
show details | |

|
#30
Hoyle Fender Rd
Jonesborough, TN 37659
|
1,960 sq. feet
|
3 baths - beds |
show details |
| Photo | Address | Area | Beds / Baths | Price | Details |
|---|---|---|---|---|---|

|
#31
Saint James Rd
Greeneville, TN 37743
|
1,310 sq. feet
|
1 baths - beds |
show details | |

|
#32
Swatsell Ln
Greeneville, TN 37743
|
1,820 sq. feet
|
3 baths - beds |
show details | |

|
#33
Robertson Rd
Chuckey, TN 37641
|
1,092 sq. feet
|
1 baths - beds |
show details | |

|
#34
Railroad St
Greeneville, TN 37743
|
816 sq. feet
|
1 baths - beds |
show details | |

|
#35
Clarks Creek Rd
Jonesborough, TN 37659
|
728 sq. feet
|
1 baths - beds |
show details | |

|
#36
Bible Acres Ln
Greeneville, TN 37743
|
1,092 sq. feet
|
2 baths - beds |
show details | |

|
#37
Dulaney Rd
Greeneville, TN 37743
|
1,780 sq. feet
|
1 baths - beds |
show details | |

|
#38
Baileyton Rd
Greeneville, TN 37745
|
2,432 sq. feet
|
3 baths - beds |
show details | |

|
#39
Roaring Fork Rd
Greeneville, TN 37745
|
2,028 sq. feet
|
2 baths - beds |
show details | |

|
#40
Swanay Rd
Limestone, TN 37681
|
1,664 sq. feet
|
2 baths - beds |
show details |
| Photo | Address | Area | Beds / Baths | Price | Details |
|---|---|---|---|---|---|

|
#41
Roaring Fork Rd
Greeneville, TN 37745
|
1,820 sq. feet
|
1 baths - beds |
show details | |

|
#42
Fry St
Greeneville, TN 37745
|
720 sq. feet
|
1 baths - beds |
show details | |

|
#43
Asheville Hwy
Greeneville, TN 37743
|
1,344 sq. feet
|
2 baths - beds |
show details | |

|
#44
E Bernard Ave
Greeneville, TN 37745
|
1,272 sq. feet
|
1 baths - beds |
show details | |

|
#45
Morrow Ln
Greeneville, TN 37745
|
1,992 sq. feet
|
1 baths - beds |
show details | |

|
#46
Short Ln
Jonesborough, TN 37659
|
1,540 sq. feet
|
2 baths - beds |
show details | |

|
#47
Spring St
Greeneville, TN 37743
|
936 sq. feet
|
1 baths - beds |
show details | |

|
#48
Spring St
Greeneville, TN 37743
|
1,600 sq. feet
|
1 baths - beds |
show details | |

|
#49
Whirlwind Rd
Greeneville, TN 37743
|
1,008 sq. feet
|
1 baths - beds |
show details | |

|
Check over 1 million property listings on Foreclosure.com!
|
browse all offers | |||

Household type by relationship:
Households: 67,079- In family households: 56,675 (13,844 male householders, 5,378 female householders)
14,525 spouses, 17,250 children (15,402 natural, 628 adopted, 1,220 stepchildren), 1,954 grandchildren, 477 brothers or sisters, 529 parents, foster children, 697 other relatives, 1,564 non-relatives
- In nonfamily households: 10,404 (4,034 male householders (3,301 living alone)), 4,762 female householders (4,214 living alone)), 1,608 nonrelatives
- In group quarters: 1,752 (903 institutionalized population)
9,250 married couples with children.
3,195 single-parent households (797 men, 2,398 women).
97.9% of residents of Southeast Nolichucky speak English at home.
1.3% of residents speak Spanish at home (47% speak English very well, 40% speak English well, 13% speak English not well).
0.7% of residents speak other Indo-European language at home (50% speak English very well, 35% speak English well, 15% speak English not well).
0.1% of residents speak Asian or Pacific Island language at home (100% speak English not well).
Foreign born population: 67 (0.9%)
(31.3% of them are naturalized citizens)
| Here: | 6.3 |
| State: | 6.5 |
| Here: | 4.6 |
| State: | 4.4 |
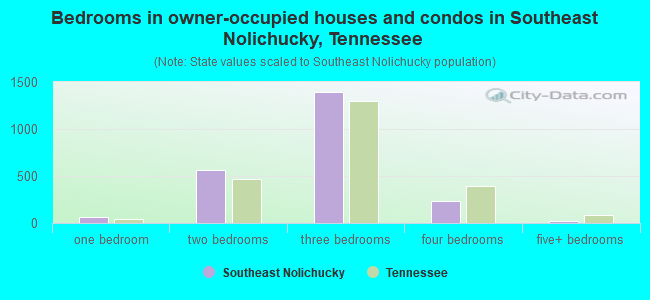
- Bedrooms in owner-occupied houses and condos in Southeast Nolichucky, Tennessee
- 0no bedroom
- 681 bedroom
- 5672 bedrooms
- 1,3933 bedrooms
- 2374 bedrooms
- 225+ bedrooms
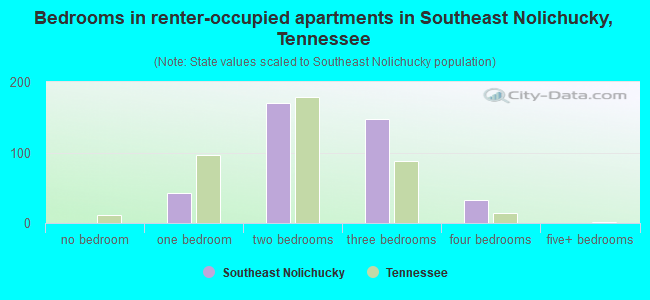
- Bedrooms in renter-occupied apartments in Southeast Nolichucky, Tennessee
- 0no bedroom
- 421 bedroom
- 1702 bedrooms
- 1483 bedrooms
- 334 bedrooms
- 05+ bedrooms
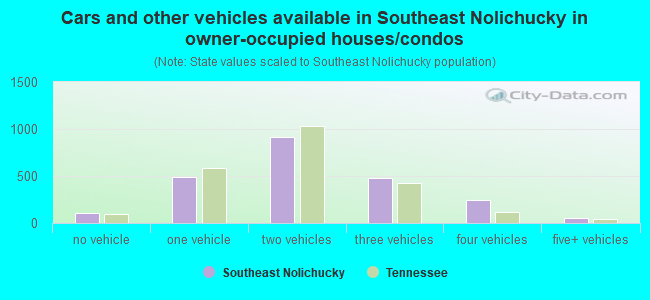
- Cars and other vehicles available in Southeast Nolichucky in owner-occupied houses/condos
- 111no vehicle
- 4851 vehicle
- 9112 vehicles
- 4813 vehicles
- 2414 vehicles
- 585+ vehicles
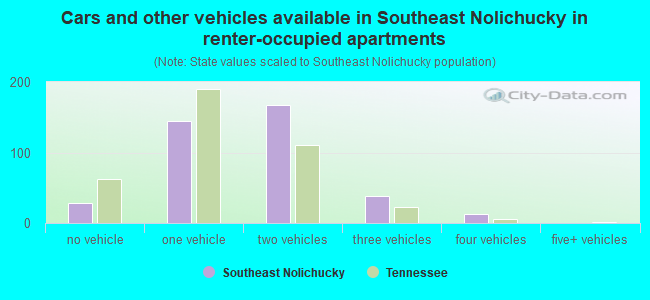
- Cars and other vehicles available in Southeast Nolichucky in renter-occupied apartments
- 29no vehicle
- 1441 vehicle
- 1682 vehicles
- 393 vehicles
- 134 vehicles
- 05+ vehicles
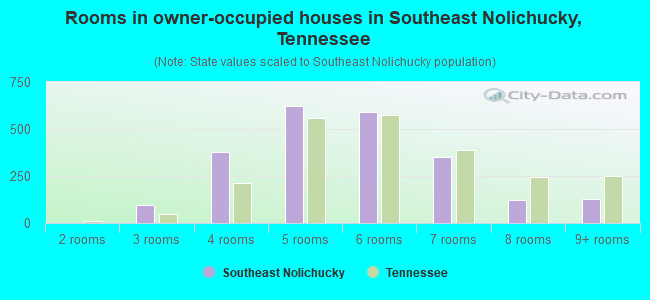
- Rooms in owner-occupied houses in Southeast Nolichucky, Tennessee
- 01 room
- 02 rooms
- 943 rooms
- 3764 rooms
- 6225 rooms
- 5906 rooms
- 3537 rooms
- 1248 rooms
- 1289+ rooms
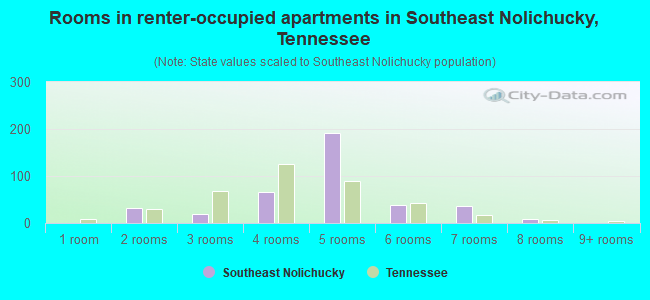
- Rooms in renter-occupied apartments in Southeast Nolichucky, Tennessee
- 01 room
- 322 rooms
- 193 rooms
- 664 rooms
- 1925 rooms
- 386 rooms
- 377 rooms
- 98 rooms
- 09+ rooms
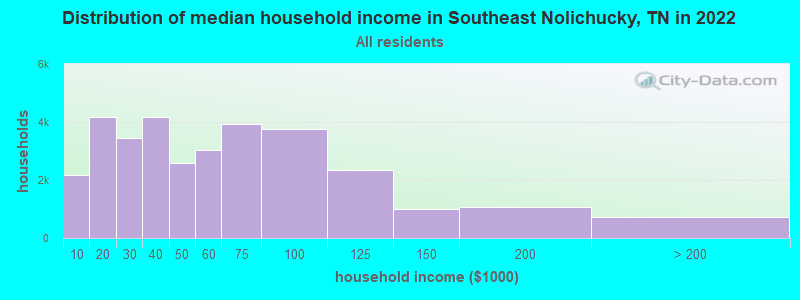
Southeast Nolichucky, TN household income distribution

- 2,168Less than $10,000
- 4,178$10,000 to $19,999
- 3,432$20,000 to $29,999
- 4,188$30,000 to $39,999
- 2,588$40,000 to $49,999
- 3,049$50,000 to $59,999
- 3,945$60,000 to $74,999
- 3,774$75,000 to $99,999
- 2,359$100,000 to $124,999
- 997$125,000 to $149,999
- 1,054$150,000 to $199,999
- 720$200,000 or more
Percentage of workers working in this county: 80.9%
Number of people working at home: 343 (9.8% of all workers)
Travel time to work (commute)
- Less than 5 minutes: 25
- 5 to 9 minutes: 111
- 10 to 14 minutes: 252
- 15 to 19 minutes: 477
- 20 to 24 minutes: 920
- 25 to 29 minutes: 341
- 30 to 34 minutes: 533
- 35 to 39 minutes: 40
- 40 to 44 minutes: 82
- 45 to 59 minutes: 114
- 60 to 89 minutes: 36
- 90 or more minutes: 92
Means of transportation to work:
- Drove a car alone: 2,482 (79.4%)
- Carpooled: 495 (15.8%)
- Bus or trolley bus: 12 (0.4%)
- Walked: 7 (0.2%)
- Other means: 27 (0.9%)
- Worked at home: 101 (3.2%)
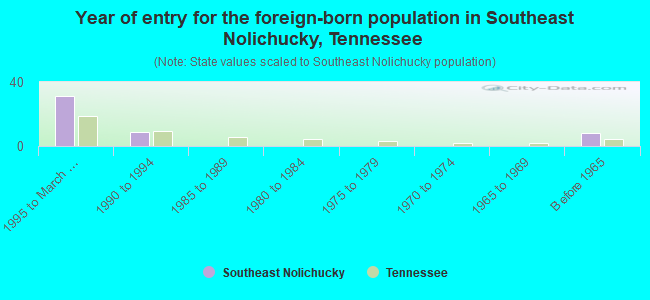
- Year of entry for the foreign-born population in Southeast Nolichucky, Tennessee
- 311995 to March 2000
- 91990 to 1994
- 01985 to 1989
- 01980 to 1984
- 01975 to 1979
- 01970 to 1974
- 01965 to 1969
- 8Before 1965
Most common places of birth for foreign-born residents (%):
| Southeast Nolichucky: | 33.3% (16) |
| Tennessee: | 4.4% (6,981) |
| Southeast Nolichucky: | 31.2% (15) |
| Tennessee: | 28.1% (44,682) |
| Southeast Nolichucky: | 18.8% (9) |
| Tennessee: | 0.2% (333) |
| Southeast Nolichucky: | 16.7% (8) |
| Tennessee: | 3.7% (5,949) |
Place of birth for U.S.-born residents:
- This state: 4,991
- Other state: 1,719
- Northeast: 339
- Midwest: 430
- South: 831
- West: 119
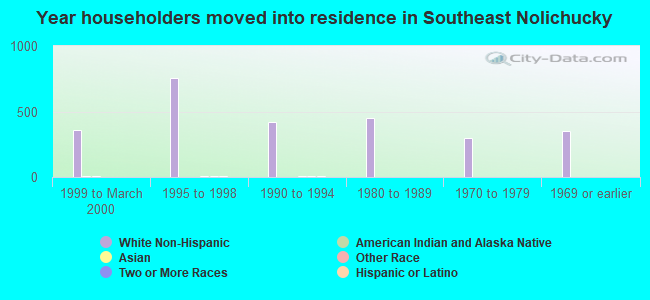
63% of Southeast Nolichucky residents lived in the same house 5 years ago.
Out of people who lived in different houses, 60% lived in this county.
Out of people who lived in different counties, 39% lived in Tennessee.
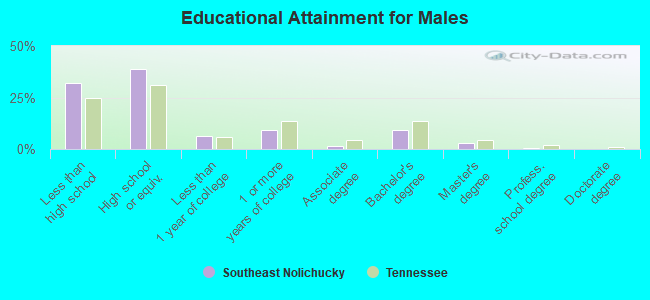
Education attainment for males 25 years and older:
- No schooling: 40
- Nursery to 4th grade: 19
- 5th and 6th grade: 85
- 7th and 8th grade: 237
- 9th grade: 69
- 10th grade: 147
- 11th grade: 70
- 12th grade, no diploma: 62
- High school graduate (or equivalency): 887
- Less than 1 year of college: 148
- Some college more than 1 year, no degree: 207
- Associate degree: 36
- Bachelor's degree: 205
- Master's degree: 61
- Professional school degree: 7
- Doctorate degree: 0
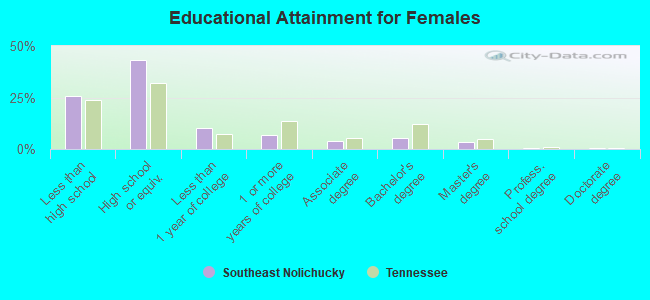
Education attainment for females 25 years and older:
- No schooling: 26
- Nursery to 4th grade: 0
- 5th and 6th grade: 66
- 7th and 8th grade: 163
- 9th grade: 89
- 10th grade: 87
- 11th grade: 127
- 12th grade, no diploma: 43
- High school graduate (or equivalency): 1,003
- Less than 1 year of college: 232
- Some college more than 1 year, no degree: 161
- Associate degree: 90
- Bachelor's degree: 123
- Master's degree: 83
- Professional school degree: 12
- Doctorate degree: 9


Housing units in structures:
- One, detached: 1,840
- One, attached: 9
- Two: 25
- 3 or 4: 9
- 10 to 19: 19
- Mobile homes: 1,025
Median worth of mobile homes: $99,664
Housing units lacking complete kitchen facilities: 2.0%
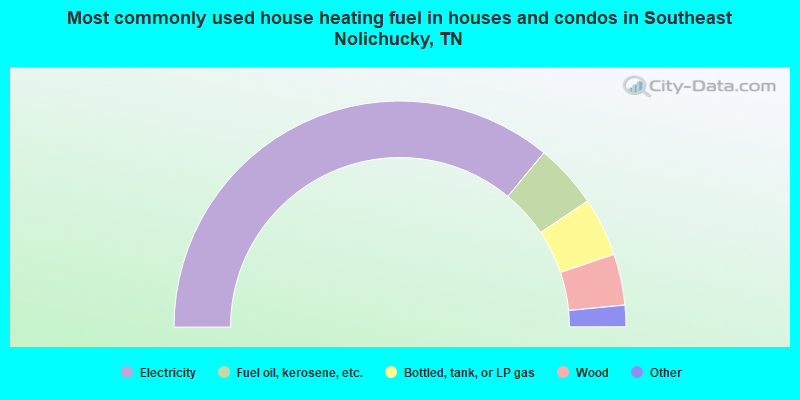
- 72.0%Electricity
- 9.2%Fuel oil, kerosene, etc.
- 8.4%Bottled, tank, or LP gas
- 7.3%Wood
- 1.7%No fuel used
- 1.4%Utility gas
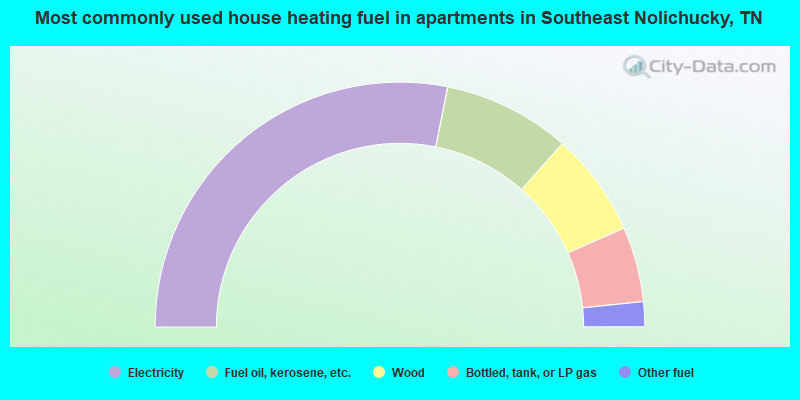
- 56.2%Electricity
- 16.8%Fuel oil, kerosene, etc.
- 13.7%Wood
- 9.9%Bottled, tank, or LP gas
- 3.3%Other fuel
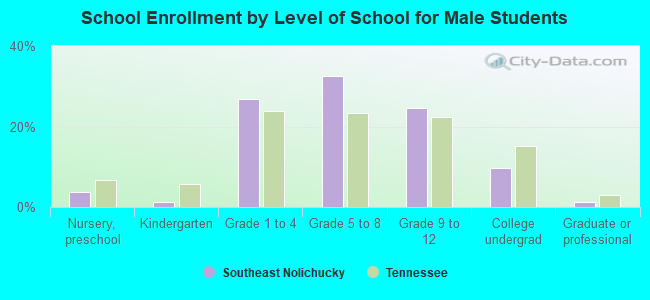
Private vs. public school enrollment:
| Here: | 11.7% |
| Tennessee: | 9.5% |
| Here: | 9.8% |
| Tennessee: | 10.4% |
| Here: | 19.0% |
| Tennessee: | 22.8% |