Southeast Nolichucky, Tennessee (TN) income map, earnings map, and wages data
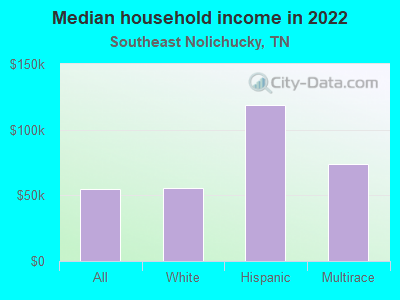
The median household income in Southeast Nolichucky, TN in 2022 was $54,622, which was 19.5% less than the median annual income of $65,254 across the entire state of Tennessee. Compared to the median income of $33,925 in 2000 this represents an increase of 37.9%. The per capita income in 2022 was $26,398, which means an increase of 39.8% compared to 2000 when it was $15,904.
Income statistics for all residents
Median household income in Southeast Nolichucky, TN in 2022:| Southeast Nolichucky: | $54,623 |
| Tennessee: | $65,254 |
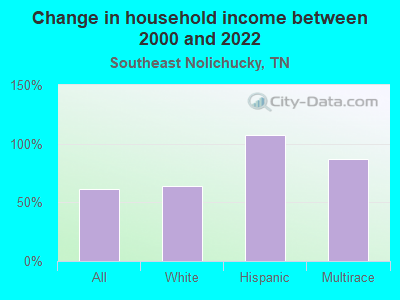
Change in median household income between 2000 and 2022:| Southeast Nolichucky, Tennessee: | +61.0% |
| State: | +79.5% |
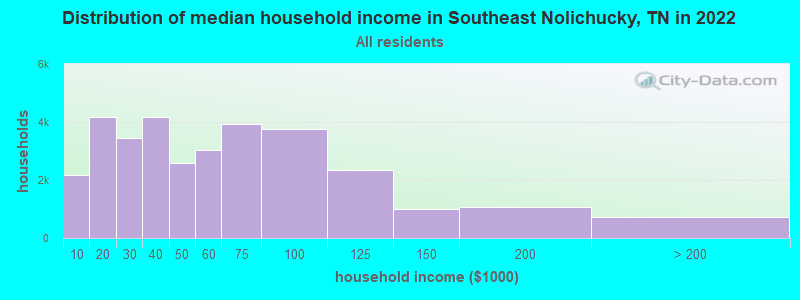
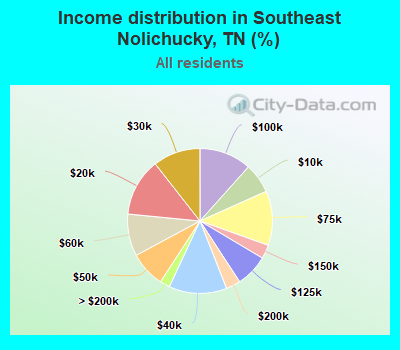
Number of households with income < $10k:| Southeast Nolichucky: | 6.7% (2,168) |
| State: | 5.4% (154,793) |
Number of households with income $10k - 20k:| Southeast Nolichucky: | 12.9% (4,178) |
| State: | 8.0% (228,599) |
Number of households with income $20k - 30k:| Southeast Nolichucky: | 10.6% (3,432) |
| State: | 7.9% (224,908) |
Number of households with income $30k - 40k:| Southeast Nolichucky: | 12.9% (4,188) |
| State: | 8.6% (244,297) |
Number of households with income $40k - 50k:| Southeast Nolichucky: | 8.0% (2,588) |
| State: | 8.4% (238,949) |
Number of households with income $50k - 60k:| Southeast Nolichucky: | 9.4% (3,049) |
| State: | 7.7% (218,438) |
Number of households with income $60k - 75k:| Southeast Nolichucky: | 12.2% (3,945) |
| State: | 10.3% (294,172) |
Number of households with income $75k - 100k:| Southeast Nolichucky: | 11.6% (3,774) |
| State: | 13.3% (377,310) |
Number of households with income $100k - 125k:| Southeast Nolichucky: | 7.3% (2,359) |
| State: | 9.5% (269,124) |
Number of households with income $125k - 150k:| Southeast Nolichucky: | 3.1% (997) |
| State: | 6.3% (178,328) |
Number of households with income $150k - 200k:| Southeast Nolichucky: | 3.2% (1,054) |
| Tennessee: | 7.2% (204,030) |
Number of households with income > $200k:| Southeast Nolichucky: | 2.2% (720) |
| State: | 7.5% (213,736) |
Aggregate household income in Southeast Nolichucky in 2022: $199,776,010
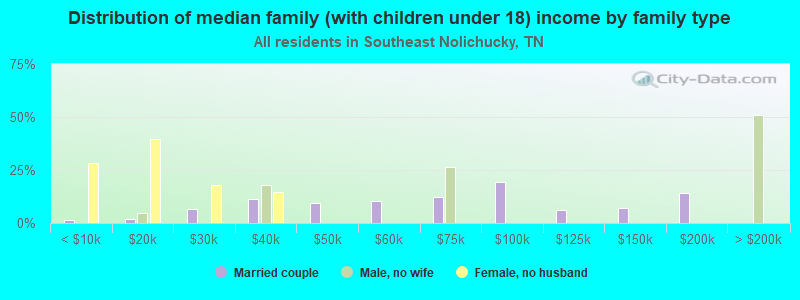
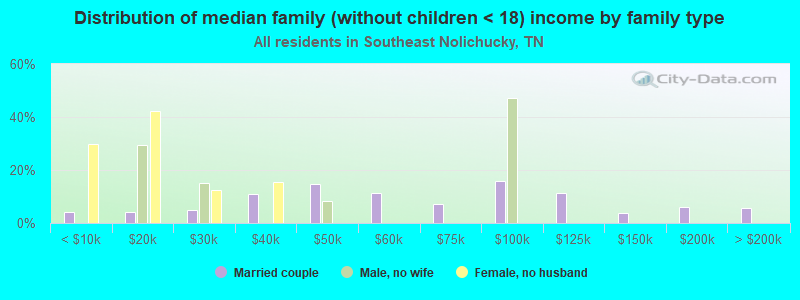
Median family income in Southeast Nolichucky in 2022:| Southeast Nolichucky: | $57,050 |
| State: | $80,910 |
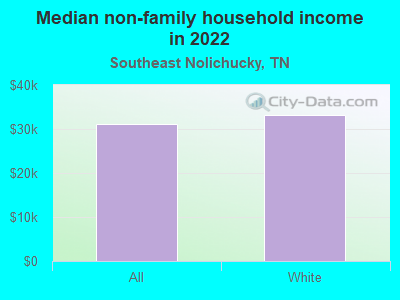
Median non-family income in Southeast Nolichucky in 2022:| Southeast Nolichucky: | $31,033 |
| State: | $40,285 |
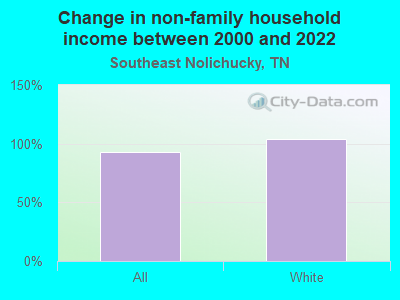
Change in median non-family income between 2000 and 2022:| Southeast Nolichucky, Tennessee: | +92.9% |
| State: | +91.5% |
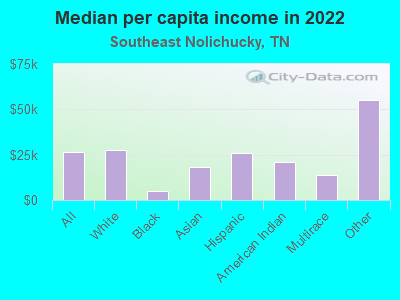
Median per capita income in Southeast Nolichucky in 2022:| Southeast Nolichucky: | $26,398 |
| State: | $36,704 |
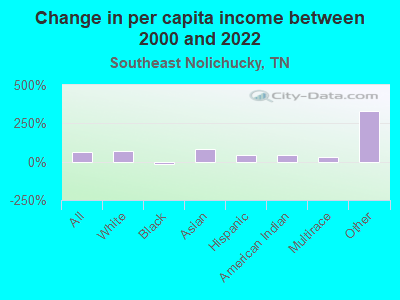
Change in median per capita income between 2000 and 2022:| Southeast Nolichucky, Tennessee: | +66.0% |
| Tennessee: | +89.3% |
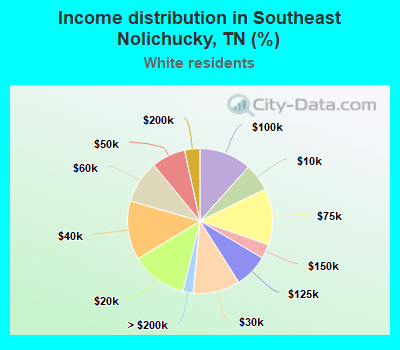
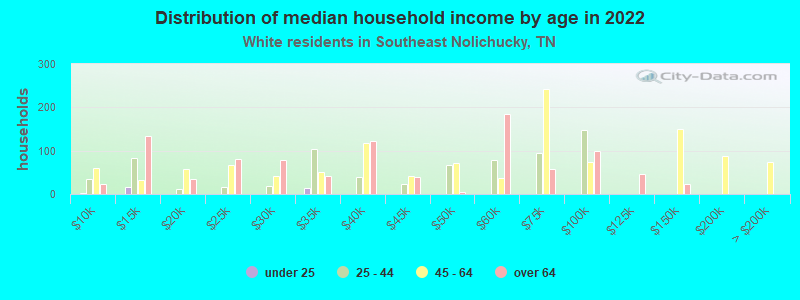
Income statistics for White residents
Median household income in Southeast Nolichucky, TN in 2022:| Southeast Nolichucky: | $55,528 |
| Tennessee: | $69,826 |
Change in median household income between 2000 and 2022:| Southeast Nolichucky, Tennessee: | +63.7% |
| Tennessee: | +82.9% |
Number of households with income < $10k:| Southeast Nolichucky: | 6.1% (1,894) |
| Tennessee: | 4.6% (100,279) |
Number of households with income $10k - 20k:| Southeast Nolichucky: | 12.5% (3,851) |
| State: | 7.6% (165,031) |
Number of households with income $20k - 30k:| Southeast Nolichucky: | 10.5% (3,222) |
| Tennessee: | 7.4% (160,229) |
Number of households with income $30k - 40k:| Southeast Nolichucky: | 13.1% (4,050) |
| State: | 8.1% (174,784) |
Number of households with income $40k - 50k:| Southeast Nolichucky: | 7.6% (2,340) |
| Tennessee: | 7.8% (169,622) |
Number of households with income $50k - 60k:| Southeast Nolichucky: | 9.5% (2,934) |
| Tennessee: | 7.6% (165,508) |
Number of households with income $60k - 75k:| Southeast Nolichucky: | 12.5% (3,860) |
| State: | 10.3% (223,937) |
Number of households with income $75k - 100k:| Southeast Nolichucky: | 11.6% (3,587) |
| State: | 13.5% (292,688) |
Number of households with income $100k - 125k:| Southeast Nolichucky: | 7.5% (2,312) |
| State: | 10.1% (219,251) |
Number of households with income $125k - 150k:| Southeast Nolichucky: | 3.2% (990) |
| State: | 6.6% (142,574) |
Number of households with income $150k - 200k:| Southeast Nolichucky: | 3.4% (1,046) |
| State: | 7.7% (166,039) |
Number of households with income > $200k:| Southeast Nolichucky: | 2.3% (715) |
| State: | 8.5% (184,546) |
Aggregate household income in Southeast Nolichucky in 2022: $197,058,503
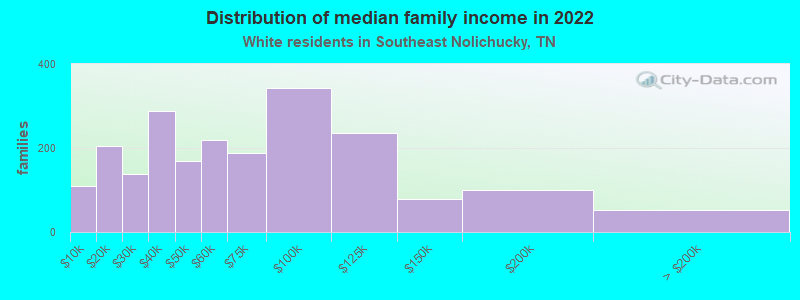
Median family income in Southeast Nolichucky in 2022:| Southeast Nolichucky: | $57,970 |
| State: | $86,015 |
Number of families with income < $10k:| Southeast Nolichucky: | 5.2% (110) |
| State: | 3.1% (43,751) |
Number of families with income $10k - 20k:| Southeast Nolichucky: | 9.6% (204) |
| State: | 3.5% (49,925) |
Number of families with income $20k - 30k:| Southeast Nolichucky: | 6.5% (139) |
| State: | 5.0% (70,431) |
Number of families with income $30k - 40k:| Southeast Nolichucky: | 13.6% (288) |
| State: | 6.6% (93,498) |
Number of families with income $40k - 50k:| Southeast Nolichucky: | 7.9% (169) |
| State: | 6.8% (96,726) |
Number of families with income $50k - 60k:| Southeast Nolichucky: | 10.3% (218) |
| Tennessee: | 7.2% (101,879) |
Number of families with income $60k - 75k:| Southeast Nolichucky: | 8.8% (187) |
| State: | 10.7% (151,997) |
Number of families with income $75k - 100k:| Southeast Nolichucky: | 16.1% (342) |
| Tennessee: | 15.4% (218,373) |
Number of families with income $100k - 125k:| Southeast Nolichucky: | 11.1% (236) |
| State: | 12.6% (178,761) |
Number of families with income $125k - 150k:| Southeast Nolichucky: | 3.7% (78) |
| Tennessee: | 8.2% (116,575) |
Number of families with income $150k - 200k:| Southeast Nolichucky: | 4.8% (101) |
| Tennessee: | 9.9% (141,123) |
Number of families with income > $200k:| Southeast Nolichucky: | 2.5% (53) |
| State: | 11.2% (159,431) |
Median non-family income in Southeast Nolichucky in 2022:| Southeast Nolichucky: | $33,124 |
| State: | $41,178 |
Change in median non-family income between 2000 and 2022:| Southeast Nolichucky, Tennessee: | +104.4% |
| State: | +91.1% |
Median per capita income in Southeast Nolichucky in 2022:| Southeast Nolichucky: | $27,375 |
| State: | $40,126 |
Change in median per capita income between 2000 and 2022:| Southeast Nolichucky, Tennessee: | +71.2% |
| State: | +92.6% |
Income statistics for Black or African American residents
Number of households with income < $10k:| Southeast Nolichucky: | 9.1% (8,253) |
| State: | 9.1% (39,909) |
Number of households with income $10k - 20k:| Southeast Nolichucky: | 10.5% (9,568) |
| State: | 10.5% (46,276) |
Number of households with income $20k - 30k:| Southeast Nolichucky: | 10.2% (9,320) |
| State: | 10.2% (45,072) |
Number of households with income $30k - 40k:| Southeast Nolichucky: | 10.0% (9,073) |
| Tennessee: | 10.0% (43,885) |
Number of households with income $40k - 50k:| Southeast Nolichucky: | 10.7% (9,774) |
| Tennessee: | 10.7% (47,267) |
Number of households with income $50k - 60k:| Southeast Nolichucky: | 7.7% (7,003) |
| Tennessee: | 7.7% (33,868) |
Number of households with income $60k - 75k:| Southeast Nolichucky: | 10.5% (9,563) |
| State: | 10.5% (46,247) |
Number of households with income $75k - 100k:| Southeast Nolichucky: | 12.6% (11,468) |
| State: | 12.6% (55,465) |
Number of households with income $100k - 125k:| Southeast Nolichucky: | 6.7% (6,102) |
| State: | 6.7% (29,515) |
Number of households with income $125k - 150k:| Southeast Nolichucky: | 4.8% (4,405) |
| State: | 4.8% (21,306) |
Number of households with income $150k - 200k:| Southeast Nolichucky: | 4.6% (4,222) |
| Tennessee: | 4.6% (20,425) |
Number of households with income > $200k:| Southeast Nolichucky: | 2.5% (2,312) |
| State: | 2.5% (11,183) |
Median per capita income in Southeast Nolichucky in 2022:| Southeast Nolichucky: | $4,758 |
| State: | $27,306 |
Income statistics for Asian residents
Aggregate household income in Southeast Nolichucky in 2022: $351,458
Median per capita income in Southeast Nolichucky in 2022:| Southeast Nolichucky: | $18,440 |
| State: | $46,931 |
Change in median per capita income between 2000 and 2022:| Southeast Nolichucky, Tennessee: | +84.4% |
| Tennessee: | +130.8% |
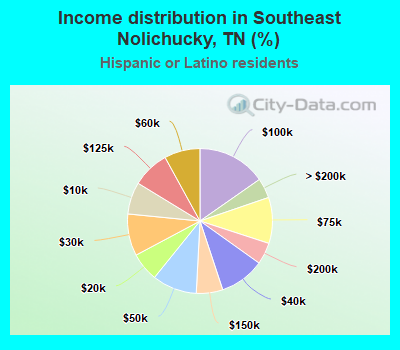
Income statistics for Hispanic or Latino residents
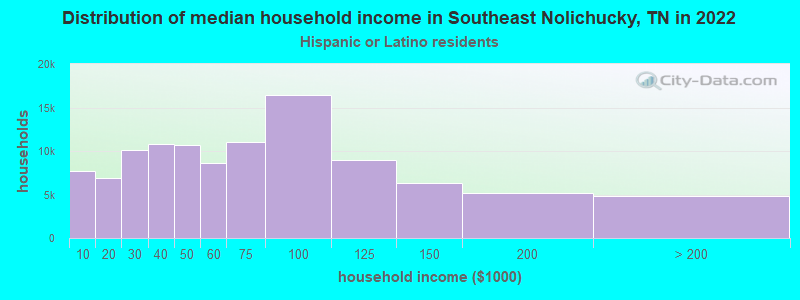
Median household income in Southeast Nolichucky, TN in 2022:| Southeast Nolichucky: | $119,082 |
| State: | $58,385 |
Change in median household income between 2000 and 2022:| Southeast Nolichucky, Tennessee: | +107.1% |
| State: | +82.3% |
Number of households with income < $10k:| Southeast Nolichucky: | 7.2% (7,707) |
| Tennessee: | 7.2% (8,567) |
Number of households with income $10k - 20k:| Southeast Nolichucky: | 6.4% (6,878) |
| State: | 6.4% (7,670) |
Number of households with income $20k - 30k:| Southeast Nolichucky: | 9.4% (10,062) |
| State: | 9.4% (11,247) |
Number of households with income $30k - 40k:| Southeast Nolichucky: | 10.1% (10,811) |
| Tennessee: | 10.1% (12,072) |
Number of households with income $40k - 50k:| Southeast Nolichucky: | 10.0% (10,717) |
| State: | 10.0% (11,947) |
Number of households with income $50k - 60k:| Southeast Nolichucky: | 8.0% (8,581) |
| State: | 8.0% (9,569) |
Number of households with income $60k - 75k:| Southeast Nolichucky: | 10.3% (11,031) |
| State: | 10.3% (12,315) |
Number of households with income $75k - 100k:| Southeast Nolichucky: | 15.3% (16,441) |
| State: | 15.3% (18,285) |
Number of households with income $100k - 125k:| Southeast Nolichucky: | 8.3% (8,913) |
| State: | 8.3% (9,886) |
Number of households with income $125k - 150k:| Southeast Nolichucky: | 5.9% (6,354) |
| State: | 5.9% (7,066) |
Number of households with income $150k - 200k:| Southeast Nolichucky: | 4.9% (5,224) |
| State: | 4.9% (5,822) |
Number of households with income > $200k:| Southeast Nolichucky: | 4.5% (4,790) |
| State: | 4.5% (5,337) |
Aggregate household income in Southeast Nolichucky in 2022: $4,382,223
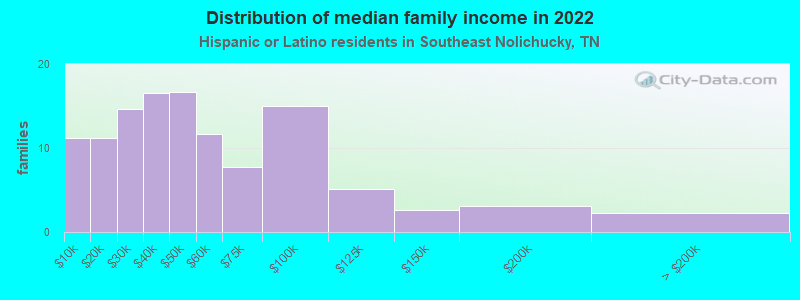
Median family income in Southeast Nolichucky in 2022:| Southeast Nolichucky: | $128,395 |
| State: | $64,014 |
Number of families with income < $10k:| Southeast Nolichucky: | 9.5% (11) |
| Tennessee: | 6.5% (5,773) |
Number of families with income $10k - 20k:| Southeast Nolichucky: | 9.5% (11) |
| State: | 5.4% (4,773) |
Number of families with income $20k - 30k:| Southeast Nolichucky: | 12.4% (15) |
| Tennessee: | 9.2% (8,233) |
Number of families with income $30k - 40k:| Southeast Nolichucky: | 14.1% (17) |
| State: | 9.6% (8,514) |
Number of families with income $40k - 50k:| Southeast Nolichucky: | 14.2% (17) |
| State: | 8.8% (7,850) |
Number of families with income $50k - 60k:| Southeast Nolichucky: | 9.9% (12) |
| State: | 7.9% (7,017) |
Number of families with income $60k - 75k:| Southeast Nolichucky: | 6.6% (8) |
| State: | 10.8% (9,605) |
Number of families with income $75k - 100k:| Southeast Nolichucky: | 12.8% (15) |
| State: | 16.6% (14,820) |
Number of families with income $100k - 125k:| Southeast Nolichucky: | 4.3% (5) |
| Tennessee: | 8.4% (7,480) |
Number of families with income $125k - 150k:| Southeast Nolichucky: | 2.2% (3) |
| Tennessee: | 6.3% (5,594) |
Number of families with income $150k - 200k:| Southeast Nolichucky: | 2.7% (3) |
| State: | 5.4% (4,817) |
Number of families with income > $200k:| Southeast Nolichucky: | 1.9% (2) |
| State: | 5.1% (4,577) |
Median per capita income in Southeast Nolichucky in 2022:| Southeast Nolichucky: | $25,936 |
| State: | $21,276 |
Change in median per capita income between 2000 and 2022:| Southeast Nolichucky, Tennessee: | +44.7% |
| Tennessee: | +76.0% |
Income statistics for American Indian and Alaska Native residents
Aggregate household income in Southeast Nolichucky in 2022: $150,333
Median per capita income in Southeast Nolichucky in 2022:| Southeast Nolichucky: | $21,153 |
| Tennessee: | $25,981 |
Change in median per capita income between 2000 and 2022:| Southeast Nolichucky, Tennessee: | +41.0% |
| State: | +40.2% |
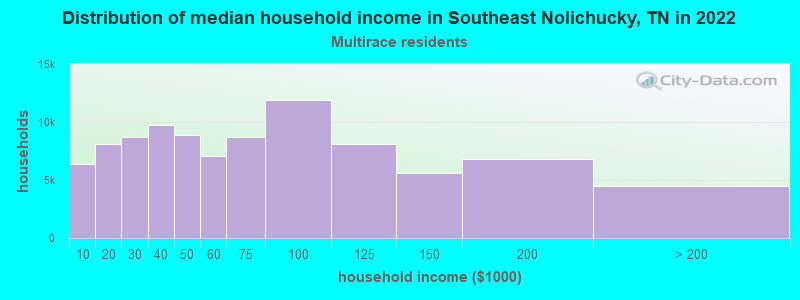
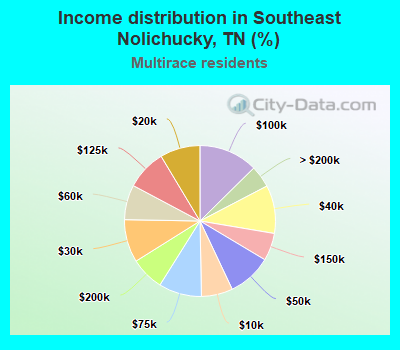
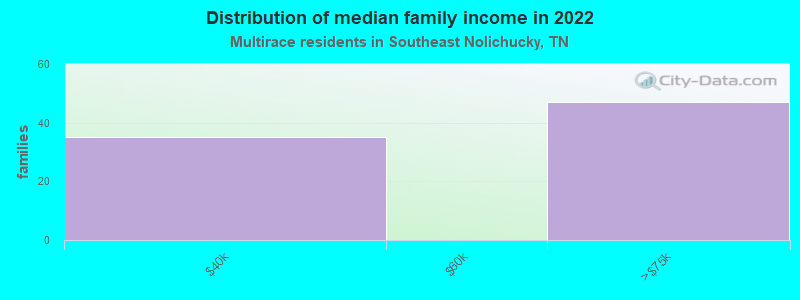
Income statistics for Multirace residents
Median household income in Southeast Nolichucky, TN in 2022:| Southeast Nolichucky: | $73,948 |
| State: | $57,741 |
Change in median household income between 2000 and 2022:| Southeast Nolichucky, Tennessee: | +86.6% |
| State: | +87.1% |
Number of households with income < $10k:| Southeast Nolichucky: | 6.7% (6,337) |
| State: | 6.7% (9,867) |
Number of households with income $10k - 20k:| Southeast Nolichucky: | 8.6% (8,101) |
| State: | 8.6% (12,639) |
Number of households with income $20k - 30k:| Southeast Nolichucky: | 9.2% (8,669) |
| State: | 9.2% (13,555) |
Number of households with income $30k - 40k:| Southeast Nolichucky: | 10.3% (9,717) |
| State: | 10.3% (15,117) |
Number of households with income $40k - 50k:| Southeast Nolichucky: | 9.4% (8,865) |
| Tennessee: | 9.4% (13,829) |
Number of households with income $50k - 60k:| Southeast Nolichucky: | 7.5% (7,035) |
| State: | 7.5% (10,969) |
Number of households with income $60k - 75k:| Southeast Nolichucky: | 9.2% (8,672) |
| State: | 9.2% (13,568) |
Number of households with income $75k - 100k:| Southeast Nolichucky: | 12.6% (11,897) |
| Tennessee: | 12.6% (18,516) |
Number of households with income $100k - 125k:| Southeast Nolichucky: | 8.6% (8,137) |
| State: | 8.6% (12,656) |
Number of households with income $125k - 150k:| Southeast Nolichucky: | 5.9% (5,565) |
| Tennessee: | 5.9% (8,674) |
Number of households with income $150k - 200k:| Southeast Nolichucky: | 7.2% (6,771) |
| Tennessee: | 7.2% (10,611) |
Number of households with income > $200k:| Southeast Nolichucky: | 4.7% (4,452) |
| Tennessee: | 4.8% (6,986) |
Aggregate household income in Southeast Nolichucky in 2022: $6,193,145
Median family income in Southeast Nolichucky in 2022:| Southeast Nolichucky: | $60,525 |
| Tennessee: | $70,058 |
Number of families with income $30k - 40k:| Southeast Nolichucky: | 42.8% (35) |
| State: | 9.0% (8,699) |
Number of families with income $60k - 75k:| Southeast Nolichucky: | 57.2% (47) |
| State: | 9.6% (9,232) |
Median per capita income in Southeast Nolichucky in 2022:| Southeast Nolichucky: | $13,968 |
| State: | $24,436 |
Change in median per capita income between 2000 and 2022:| Southeast Nolichucky, Tennessee: | +33.1% |
| State: | +84.3% |
Income statistics for other residents
Number of households with income < $10k:| Southeast Nolichucky: | 6.0% (5) |
| Tennessee: | 6.8% (2,986) |
Number of households with income $10k - 20k:| Southeast Nolichucky: | 6.0% (5) |
| Tennessee: | 6.3% (2,777) |
Number of households with income $20k - 30k:| Southeast Nolichucky: | 8.4% (7) |
| Tennessee: | 9.2% (4,034) |
Number of households with income $30k - 40k:| Southeast Nolichucky: | 13.3% (11) |
| State: | 13.2% (5,819) |
Number of households with income $40k - 50k:| Southeast Nolichucky: | 9.6% (8) |
| State: | 11.9% (5,244) |
Number of households with income $50k - 60k:| Southeast Nolichucky: | 8.4% (7) |
| State: | 7.3% (3,232) |
Number of households with income $60k - 75k:| Southeast Nolichucky: | 9.6% (8) |
| State: | 12.2% (5,384) |
Number of households with income $75k - 100k:| Southeast Nolichucky: | 12.0% (10) |
| Tennessee: | 13.1% (5,771) |
Number of households with income $100k - 125k:| Southeast Nolichucky: | 12.0% (10) |
| Tennessee: | 7.8% (3,429) |
Number of households with income $125k - 150k:| Southeast Nolichucky: | 4.8% (4) |
| State: | 4.3% (1,881) |
Number of households with income $150k - 200k:| Southeast Nolichucky: | 3.6% (3) |
| State: | 3.4% (1,486) |
Number of households with income > $200k:| Southeast Nolichucky: | 6.0% (5) |
| Tennessee: | 4.6% (2,040) |
Aggregate household income in Southeast Nolichucky in 2022: $6,235,911
Median per capita income in Southeast Nolichucky in 2022:| Southeast Nolichucky: | $54,948 |
| State: | $21,430 |