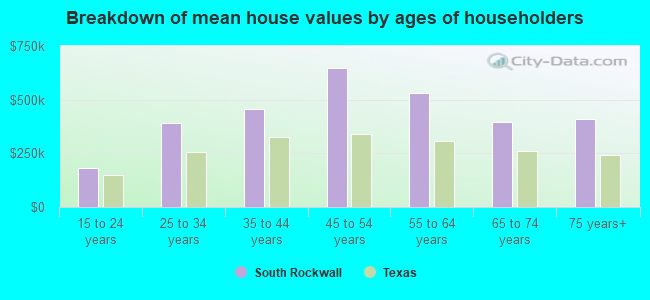
Median price asked for vacant for-sale houses and condos in 2022 in this county: $348,800.
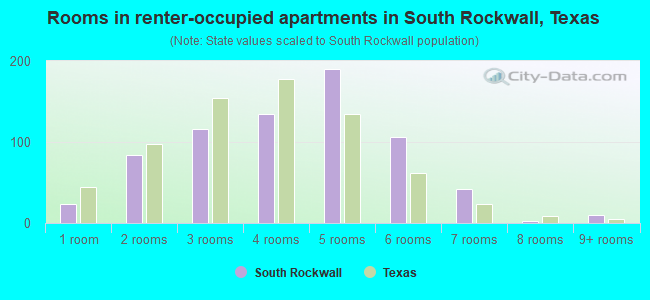
Median contract rent in 2022: $1,861 (lower quartile is $1,485, upper quartile is over $2,000)
Median rent asked for vacant for-rent units in 2022: $1,754
Median gross rent in South Rockwall, TX in 2022: over $2,000
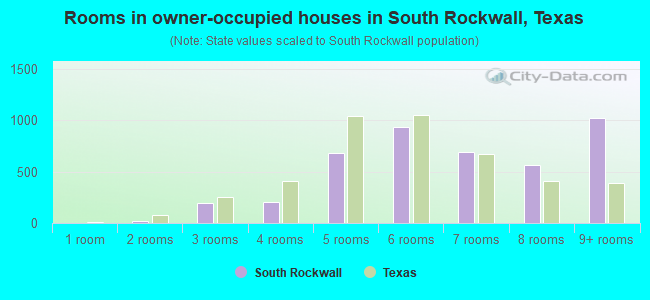
Housing units in South Rockwall with a mortgage: 2,761 (253 second mortgage, 130 home equity loan, 0 both second mortgage and home equity loan) Houses without a mortgage: 686
Compare current foreclosures near South Rockwall, TX:
In family households: 71,461 (16,531 male householders, 4,806 female householders)
17,816 spouses, 26,890 children (24,591 natural, 717 adopted, 1,582 stepchildren), 1,402 grandchildren, 531 brothers or sisters, 729 parents, foster children, 902 other relatives, 1,235 non-relatives
In nonfamily households: 6,217 (2,335 male householders (1,825 living alone)), 2,776 female householders (2,415 living alone)), 1,106 nonrelatives
In group quarters: 659 (all institutionalized)
10,457 married couples with children.
1,638 single-parent households (450 men, 1,188 women).
84.8% of residents of South Rockwall speak English at home.
12.3% of residents speak Spanish at home (51% speak English very well, 19% speak English well, 23% speak English not well, 7% don't speak English at all).
1.2% of residents speak other Indo-European language at home (87% speak English very well, 9% speak English well, 4% speak English not well).
1.4% of residents speak Asian or Pacific Island language at home (68% speak English very well, 26% speak English well, 5% speak English not well).
0.4% of residents speak other language at home (77% speak English very well, 23% speak English well).
Foreign born population: 5,056 (11.9%)
(72.3% of them are naturalized citizens)
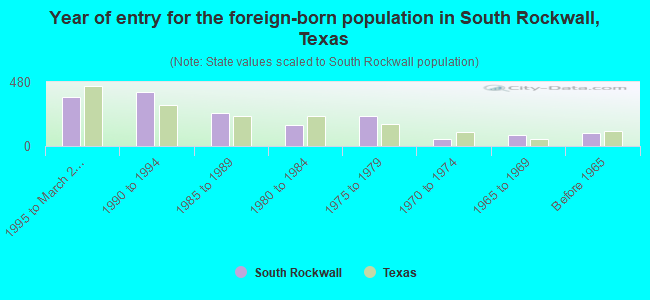
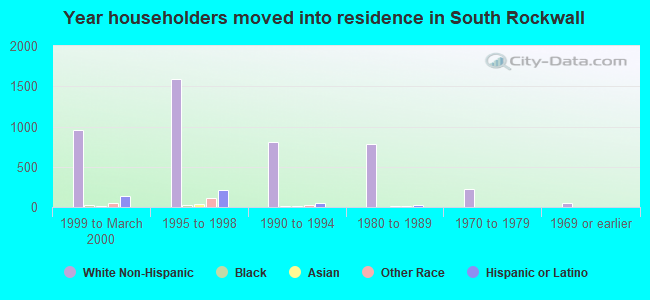
Year of entry for the foreign-born population in South Rockwall, Texas
3681995 to March 2000
4061990 to 1994
2461985 to 1989
1581980 to 1984
2251975 to 1979
531970 to 1974
841965 to 1969
99Before 1965
Most common places of birth for foreign-born residents (%):
Mexico
South Rockwall:
59.5% (975)
Texas:
64.8% (1,879,369)
United Kingdom
South Rockwall:
5.4% (89)
Texas:
1.2% (36,176)
El Salvador
South Rockwall:
4.0% (65)
Texas:
3.5% (101,259)
Philippines
South Rockwall:
3.6% (59)
Texas:
1.6% (45,907)
Canada
South Rockwall:
2.1% (34)
Texas:
1.3% (36,802)
Vietnam
South Rockwall:
2.0% (33)
Texas:
3.7% (107,027)
Germany
South Rockwall:
2.0% (32)
Texas:
1.4% (39,249)
Netherlands
South Rockwall:
2.0% (32)
Texas:
0.2% (4,590)
Cambodia
South Rockwall:
1.9% (31)
Texas:
0.2% (6,793)
Chile
South Rockwall:
1.8% (29)
Texas:
0.1% (3,880)
Place of birth for U.S.-born residents:
This state: 8,345
Other state: 4,641
Northeast: 584
Midwest: 1,862
South: 1,529
West: 666
45% of South Rockwall residents lived in the same house 5 years ago. Out of people who lived in different houses, 31% lived in this county. Out of people who lived in different counties, 74% lived in Texas.
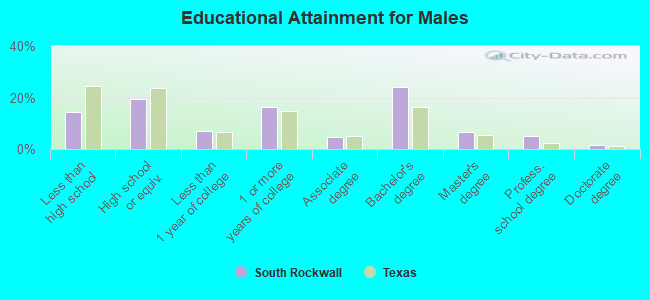
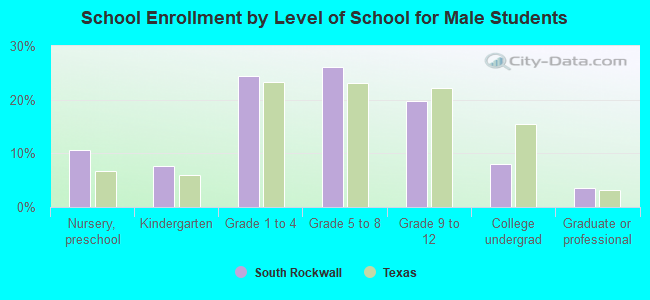
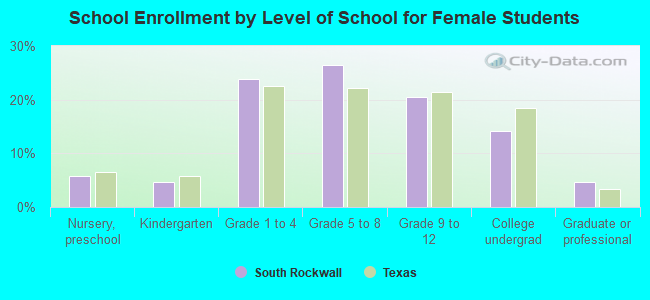
Education attainment for males 25 years and older:
No schooling: 40
Nursery to 4th grade: 82
5th and 6th grade: 114
7th and 8th grade: 119
9th grade: 68
10th grade: 89
11th grade: 46
12th grade, no diploma: 125
High school graduate (or equivalency): 926
Less than 1 year of college: 340
Some college more than 1 year, no degree: 780
Associate degree: 229
Bachelor's degree: 1,142
Master's degree: 322
Professional school degree: 245
Doctorate degree: 74
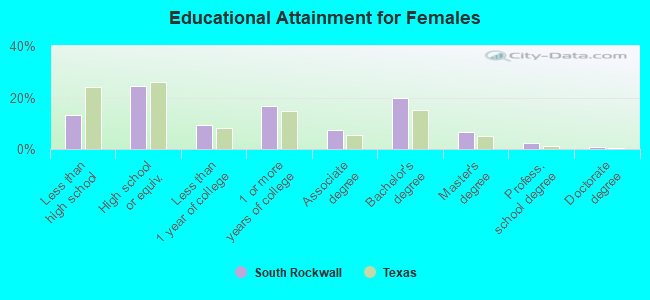
Education attainment for females 25 years and older:
No schooling: 24
Nursery to 4th grade: 6
5th and 6th grade: 77
7th and 8th grade: 88
9th grade: 80
10th grade: 110
11th grade: 87
12th grade, no diploma: 127
High school graduate (or equivalency): 1,124
Less than 1 year of college: 431
Some college more than 1 year, no degree: 767
Associate degree: 338
Bachelor's degree: 913
Master's degree: 297
Professional school degree: 99
Doctorate degree: 32
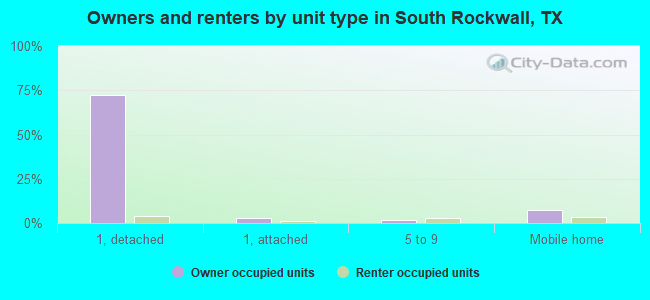
Housing units in structures:
One, detached: 4,036
One, attached: 205
Two: 34
3 or 4: 128
5 to 9: 272
10 to 19: 84
20 to 49: 7
50 or more: 12
Mobile homes: 581
Median worth of mobile homes: $58,827
Housing units lacking complete plumbing facilities: 0.3%
Housing units lacking complete kitchen facilities: 0.4%