South Rockwall, Texas (TX) income map, earnings map, and wages data
The median household income in South Rockwall, TX in 2022 was $134,475, which was 46.2% greater than the median annual income of $72,284 across the entire state of Texas. Compared to the median income of $70,802 in 2000 this represents an increase of 47.3%. The per capita income in 2022 was $61,333, which means an increase of 44.1% compared to 2000 when it was $34,316.
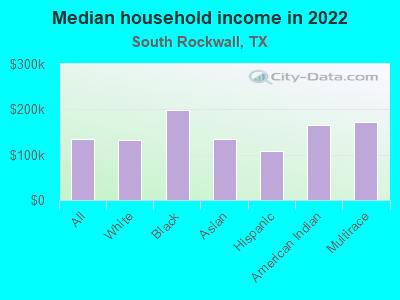
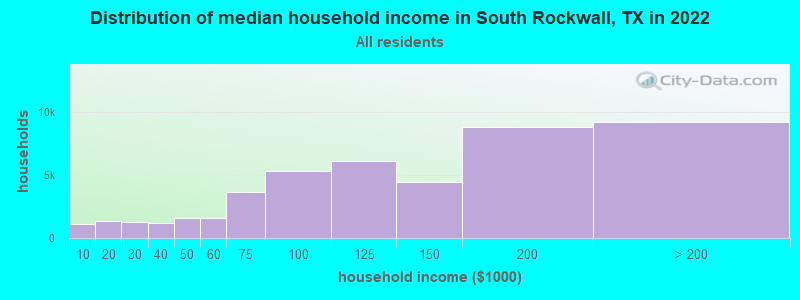
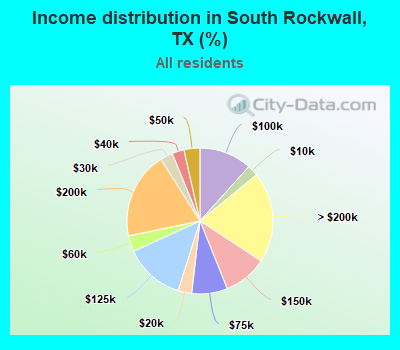
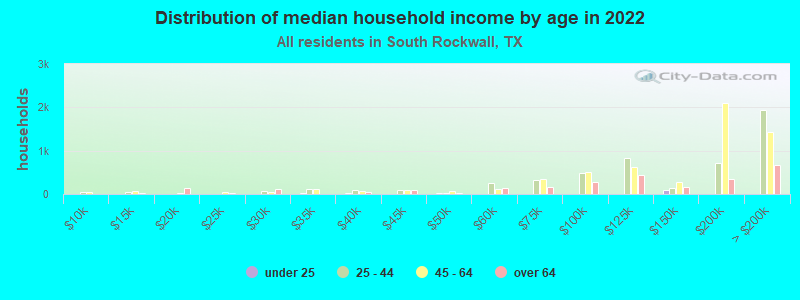
Income statistics for all residents
Median household income in South Rockwall, TX in 2022:| South Rockwall: | $134,475 |
| Texas: | $72,284 |
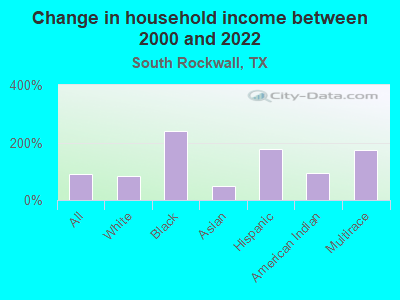
Change in median household income between 2000 and 2022:| South Rockwall, Texas: | +89.9% |
| State: | +81.0% |
Number of households with income < $10k:| South Rockwall: | 2.5% (1,122) |
| State: | 5.5% (611,011) |
Number of households with income $10k - 20k:| South Rockwall: | 3.0% (1,376) |
| State: | 6.7% (743,157) |
Number of households with income $20k - 30k:| South Rockwall: | 2.8% (1,264) |
| State: | 7.2% (803,381) |
Number of households with income $30k - 40k:| South Rockwall: | 2.7% (1,212) |
| State: | 7.8% (866,080) |
Number of households with income $40k - 50k:| South Rockwall: | 3.5% (1,603) |
| Texas: | 7.3% (810,440) |
Number of households with income $50k - 60k:| South Rockwall: | 3.5% (1,613) |
| State: | 7.2% (799,783) |
Number of households with income $60k - 75k:| South Rockwall: | 7.9% (3,605) |
| State: | 9.9% (1,095,384) |
Number of households with income $75k - 100k:| South Rockwall: | 11.6% (5,308) |
| State: | 12.8% (1,419,057) |
Number of households with income $100k - 125k:| South Rockwall: | 13.4% (6,091) |
| State: | 9.5% (1,054,577) |
Number of households with income $125k - 150k:| South Rockwall: | 9.7% (4,423) |
| State: | 6.7% (741,518) |
Number of households with income $150k - 200k:| South Rockwall: | 19.3% (8,796) |
| State: | 8.7% (961,776) |
Number of households with income > $200k:| South Rockwall: | 20.1% (9,172) |
| State: | 10.7% (1,181,544) |
Aggregate household income in South Rockwall in 2022: $2,581,257,877
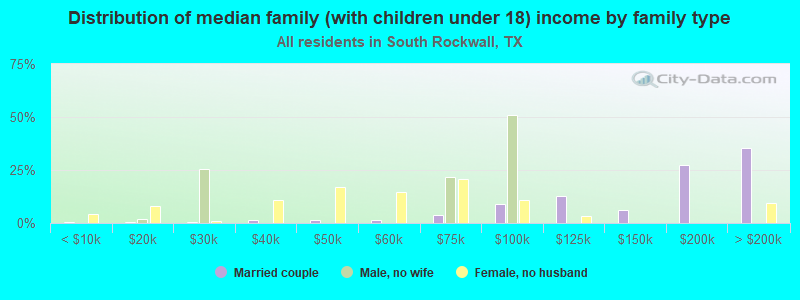
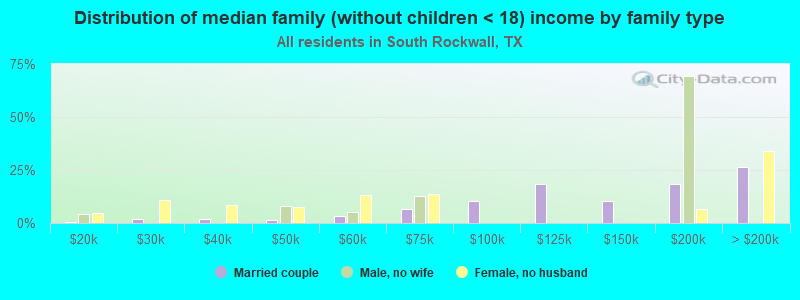
Median family income in South Rockwall in 2022:| South Rockwall: | $146,892 |
| State: | $86,267 |
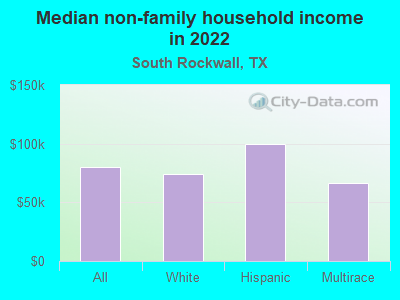
Median non-family income in South Rockwall in 2022:| South Rockwall: | $80,490 |
| Texas: | $45,999 |
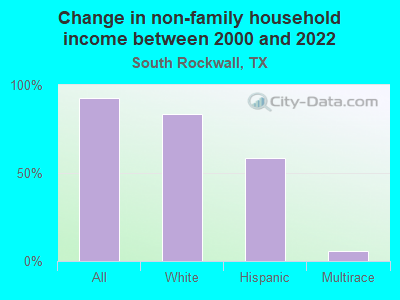
Change in median non-family income between 2000 and 2022:| South Rockwall, Texas: | +92.4% |
| Texas: | +79.5% |
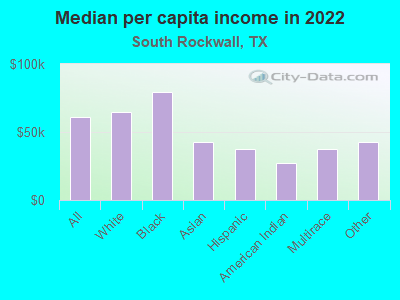
Median per capita income in South Rockwall in 2022:| South Rockwall: | $61,334 |
| State: | $38,123 |
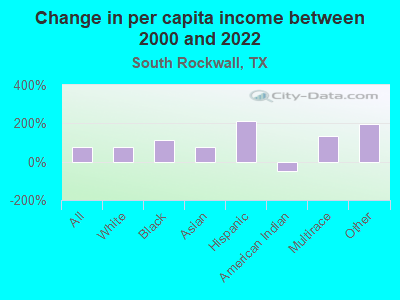
Change in median per capita income between 2000 and 2022:| South Rockwall, Texas: | +78.7% |
| Texas: | +94.3% |
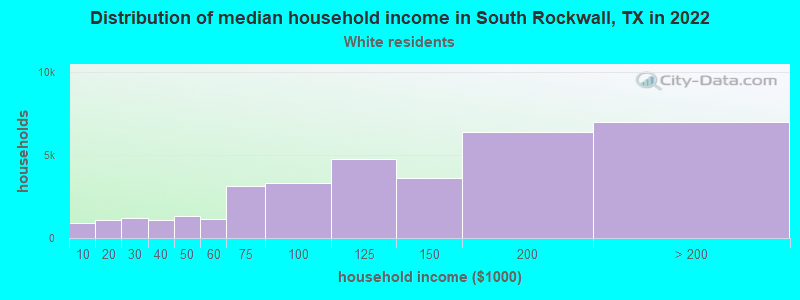
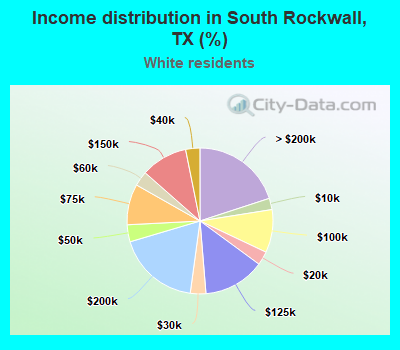
Income statistics for White residents
Median household income in South Rockwall, TX in 2022:| South Rockwall: | $133,404 |
| State: | $82,032 |
Change in median household income between 2000 and 2022:| South Rockwall, Texas: | +84.2% |
| State: | +91.0% |
Number of households with income < $10k:| South Rockwall: | 2.5% (877) |
| State: | 4.7% (273,716) |
Number of households with income $10k - 20k:| South Rockwall: | 3.0% (1,060) |
| Texas: | 5.5% (322,702) |
Number of households with income $20k - 30k:| South Rockwall: | 3.4% (1,204) |
| Texas: | 6.2% (363,947) |
Number of households with income $30k - 40k:| South Rockwall: | 3.2% (1,101) |
| State: | 6.8% (399,275) |
Number of households with income $40k - 50k:| South Rockwall: | 3.8% (1,320) |
| State: | 6.5% (383,417) |
Number of households with income $50k - 60k:| South Rockwall: | 3.3% (1,141) |
| State: | 6.6% (388,535) |
Number of households with income $60k - 75k:| South Rockwall: | 9.0% (3,157) |
| State: | 9.7% (566,295) |
Number of households with income $75k - 100k:| South Rockwall: | 9.5% (3,328) |
| Texas: | 13.0% (760,276) |
Number of households with income $100k - 125k:| South Rockwall: | 13.6% (4,760) |
| State: | 10.2% (597,596) |
Number of households with income $125k - 150k:| South Rockwall: | 10.4% (3,616) |
| Texas: | 7.4% (436,830) |
Number of households with income $150k - 200k:| South Rockwall: | 18.3% (6,372) |
| State: | 9.9% (583,067) |
Number of households with income > $200k:| South Rockwall: | 20.0% (6,979) |
| State: | 13.5% (792,647) |
Aggregate household income in South Rockwall in 2022: $1,986,712,266
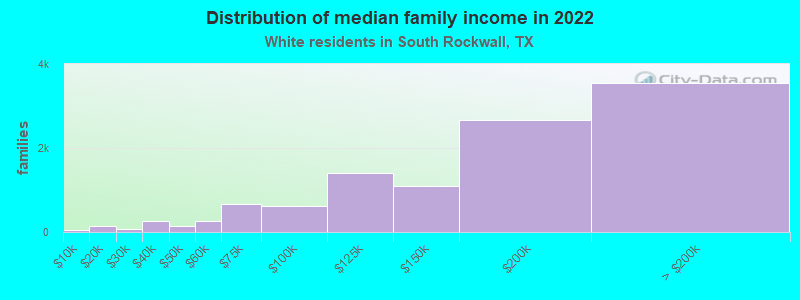
Median family income in South Rockwall in 2022:| South Rockwall: | $150,480 |
| State: | $101,788 |
Number of families with income < $10k:| South Rockwall: | 0.5% (54) |
| State: | 2.8% (108,142) |
Number of families with income $10k - 20k:| South Rockwall: | 1.2% (136) |
| Texas: | 2.9% (113,421) |
Number of families with income $20k - 30k:| South Rockwall: | 0.6% (70) |
| State: | 4.1% (157,688) |
Number of families with income $30k - 40k:| South Rockwall: | 2.3% (256) |
| State: | 5.2% (198,847) |
Number of families with income $40k - 50k:| South Rockwall: | 1.3% (145) |
| State: | 5.6% (216,490) |
Number of families with income $50k - 60k:| South Rockwall: | 2.4% (262) |
| State: | 5.7% (220,689) |
Number of families with income $60k - 75k:| South Rockwall: | 6.0% (656) |
| Texas: | 9.0% (346,106) |
Number of families with income $75k - 100k:| South Rockwall: | 5.6% (610) |
| Texas: | 13.7% (527,363) |
Number of families with income $100k - 125k:| South Rockwall: | 12.8% (1,396) |
| Texas: | 11.6% (448,411) |
Number of families with income $125k - 150k:| South Rockwall: | 10.0% (1,095) |
| State: | 9.2% (355,798) |
Number of families with income $150k - 200k:| South Rockwall: | 24.5% (2,666) |
| Texas: | 12.5% (480,185) |
Number of families with income > $200k:| South Rockwall: | 32.6% (3,551) |
| State: | 17.6% (677,490) |
Median non-family income in South Rockwall in 2022:| South Rockwall: | $74,454 |
| State: | $50,587 |
Change in median non-family income between 2000 and 2022:| South Rockwall, Texas: | +83.6% |
| State: | +87.7% |
Median per capita income in South Rockwall in 2022:| South Rockwall: | $64,549 |
| State: | $47,740 |
Change in median per capita income between 2000 and 2022:| South Rockwall, Texas: | +79.1% |
| State: | +114.3% |
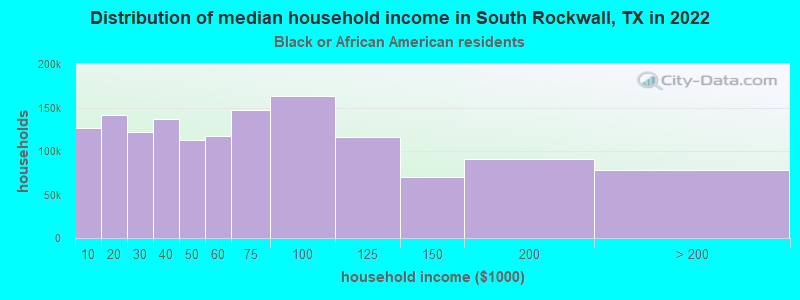
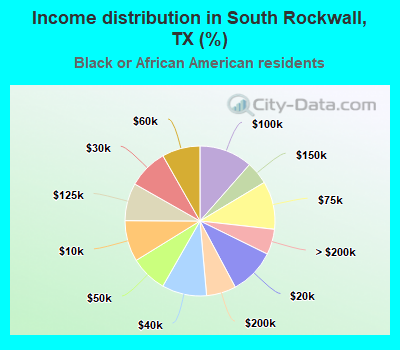
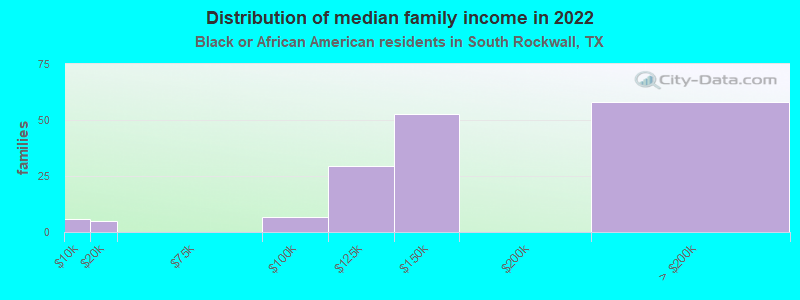
Income statistics for Black or African American residents
Median household income in South Rockwall, TX in 2022:| South Rockwall: | $199,597 |
| Texas: | $55,759 |
Number of households with income < $10k:| South Rockwall: | 8.9% (126,216) |
| State: | 8.9% (126,378) |
Number of households with income $10k - 20k:| South Rockwall: | 9.9% (141,109) |
| State: | 9.9% (140,369) |
Number of households with income $20k - 30k:| South Rockwall: | 8.5% (121,402) |
| State: | 8.5% (120,639) |
Number of households with income $30k - 40k:| South Rockwall: | 9.7% (137,258) |
| State: | 9.7% (137,517) |
Number of households with income $40k - 50k:| South Rockwall: | 7.9% (112,760) |
| Texas: | 8.0% (112,973) |
Number of households with income $50k - 60k:| South Rockwall: | 8.2% (116,841) |
| State: | 8.3% (117,156) |
Number of households with income $60k - 75k:| South Rockwall: | 10.4% (147,494) |
| State: | 10.4% (147,462) |
Number of households with income $75k - 100k:| South Rockwall: | 11.5% (162,858) |
| Texas: | 11.5% (162,718) |
Number of households with income $100k - 125k:| South Rockwall: | 8.1% (115,631) |
| State: | 8.2% (115,829) |
Number of households with income $125k - 150k:| South Rockwall: | 4.9% (70,070) |
| State: | 4.9% (69,556) |
Number of households with income $150k - 200k:| South Rockwall: | 6.4% (90,752) |
| Texas: | 6.4% (90,701) |
Number of households with income > $200k:| South Rockwall: | 5.5% (77,968) |
| Texas: | 5.5% (77,988) |
Aggregate household income in South Rockwall in 2022: $76,693,960
Median family income in South Rockwall in 2022:| South Rockwall: | $135,072 |
| State: | $69,134 |
Number of families with income < $10k:| South Rockwall: | 3.8% (6) |
| State: | 6.8% (55,625) |
Number of families with income $10k - 20k:| South Rockwall: | 3.1% (5) |
| Texas: | 6.8% (55,300) |
Number of families with income $75k - 100k:| South Rockwall: | 4.1% (7) |
| Texas: | 12.7% (103,723) |
Number of families with income $100k - 125k:| South Rockwall: | 18.6% (29) |
| State: | 9.4% (76,609) |
Number of families with income $125k - 150k:| South Rockwall: | 33.5% (53) |
| Texas: | 6.8% (55,615) |
Number of families with income > $200k:| South Rockwall: | 36.8% (58) |
| State: | 7.9% (64,439) |
Median per capita income in South Rockwall in 2022:| South Rockwall: | $79,151 |
| Texas: | $30,490 |
Change in median per capita income between 2000 and 2022:| South Rockwall, Texas: | +115.3% |
| Texas: | +113.9% |
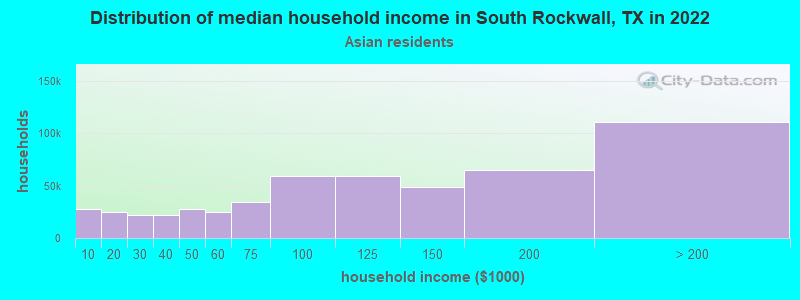
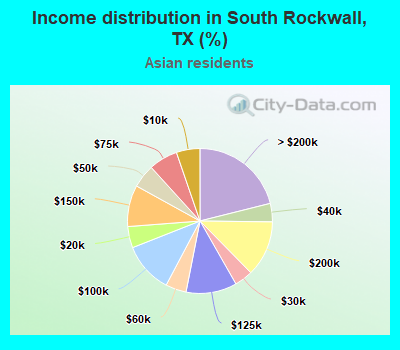
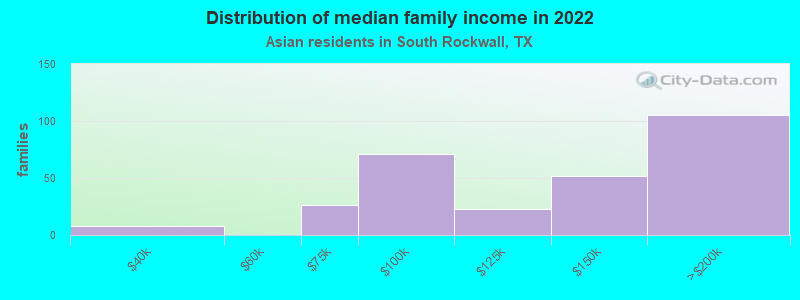
Income statistics for Asian residents
Median household income in South Rockwall, TX in 2022:| South Rockwall: | $134,905 |
| State: | $107,673 |
Change in median household income between 2000 and 2022:| South Rockwall, Texas: | +46.6% |
| Texas: | +115.1% |
Number of households with income < $10k:| South Rockwall: | 5.3% (27,504) |
| State: | 5.2% (29,885) |
Number of households with income $10k - 20k:| South Rockwall: | 4.8% (24,886) |
| Texas: | 4.7% (27,044) |
Number of households with income $20k - 30k:| South Rockwall: | 4.1% (21,448) |
| Texas: | 4.1% (23,363) |
Number of households with income $30k - 40k:| South Rockwall: | 4.1% (21,442) |
| State: | 4.1% (23,309) |
Number of households with income $40k - 50k:| South Rockwall: | 5.2% (27,411) |
| State: | 5.2% (29,826) |
Number of households with income $50k - 60k:| South Rockwall: | 4.6% (24,315) |
| State: | 4.7% (26,512) |
Number of households with income $60k - 75k:| South Rockwall: | 6.5% (33,960) |
| State: | 6.5% (36,905) |
Number of households with income $75k - 100k:| South Rockwall: | 11.3% (59,052) |
| State: | 11.3% (64,350) |
Number of households with income $100k - 125k:| South Rockwall: | 11.3% (59,429) |
| State: | 11.4% (64,714) |
Number of households with income $125k - 150k:| South Rockwall: | 9.3% (48,449) |
| State: | 9.3% (52,719) |
Number of households with income $150k - 200k:| South Rockwall: | 12.5% (65,218) |
| State: | 12.5% (70,953) |
Number of households with income > $200k:| South Rockwall: | 21.1% (110,532) |
| State: | 21.1% (120,260) |
Aggregate household income in South Rockwall in 2022: $75,380,085
Median family income in South Rockwall in 2022:| South Rockwall: | $105,031 |
| State: | $123,328 |
Number of families with income $30k - 40k:| South Rockwall: | 2.8% (8) |
| State: | 3.4% (15,033) |
Number of families with income $60k - 75k:| South Rockwall: | 9.0% (26) |
| State: | 6.1% (26,637) |
Number of families with income $75k - 100k:| South Rockwall: | 24.9% (71) |
| Texas: | 10.7% (46,626) |
Number of families with income $100k - 125k:| South Rockwall: | 7.9% (23) |
| State: | 11.3% (49,585) |
Number of families with income $125k - 150k:| South Rockwall: | 18.4% (52) |
| Texas: | 9.8% (43,043) |
Number of families with income $150k - 200k:| South Rockwall: | 37.0% (105) |
| State: | 14.7% (64,203) |
Median per capita income in South Rockwall in 2022:| South Rockwall: | $42,992 |
| State: | $48,626 |
Change in median per capita income between 2000 and 2022:| South Rockwall, Texas: | +75.5% |
| Texas: | +132.0% |
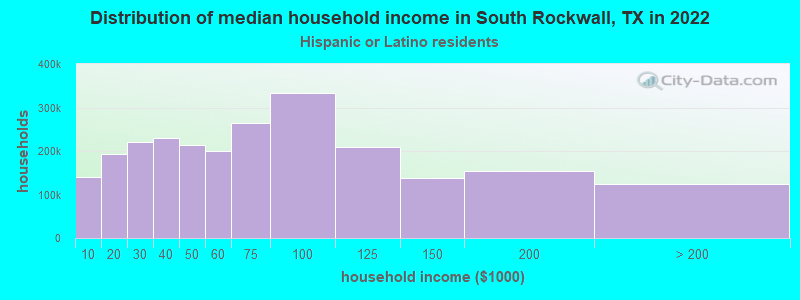
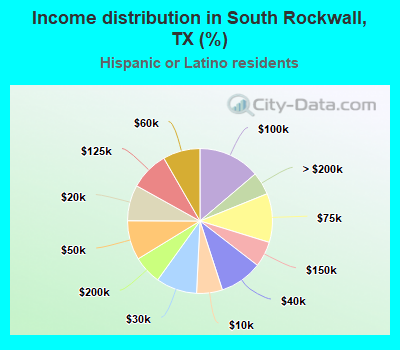
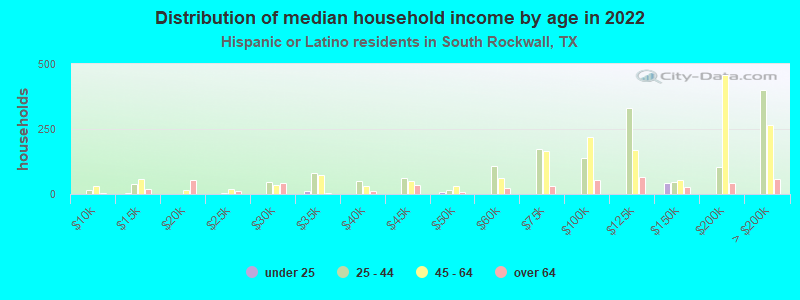
Income statistics for Hispanic or Latino residents
Median household income in South Rockwall, TX in 2022:| South Rockwall: | $108,328 |
| Texas: | $60,504 |
Number of households with income < $10k:| South Rockwall: | 5.8% (139,217) |
| State: | 5.8% (213,953) |
Number of households with income $10k - 20k:| South Rockwall: | 8.0% (193,617) |
| State: | 8.0% (297,456) |
Number of households with income $20k - 30k:| South Rockwall: | 9.2% (221,221) |
| Texas: | 9.2% (340,166) |
Number of households with income $30k - 40k:| South Rockwall: | 9.5% (230,646) |
| State: | 9.5% (354,336) |
Number of households with income $40k - 50k:| South Rockwall: | 8.8% (212,716) |
| State: | 8.8% (327,013) |
Number of households with income $50k - 60k:| South Rockwall: | 8.3% (200,762) |
| Texas: | 8.3% (308,818) |
Number of households with income $60k - 75k:| South Rockwall: | 10.9% (263,593) |
| Texas: | 10.9% (405,109) |
Number of households with income $75k - 100k:| South Rockwall: | 13.8% (333,057) |
| State: | 13.8% (511,639) |
Number of households with income $100k - 125k:| South Rockwall: | 8.6% (208,145) |
| Texas: | 8.6% (319,728) |
Number of households with income $125k - 150k:| South Rockwall: | 5.7% (137,436) |
| Texas: | 5.7% (210,932) |
Number of households with income $150k - 200k:| South Rockwall: | 6.4% (153,491) |
| Texas: | 6.4% (236,055) |
Number of households with income > $200k:| South Rockwall: | 5.1% (123,232) |
| State: | 5.1% (189,259) |
Aggregate household income in South Rockwall in 2022: $344,875,807
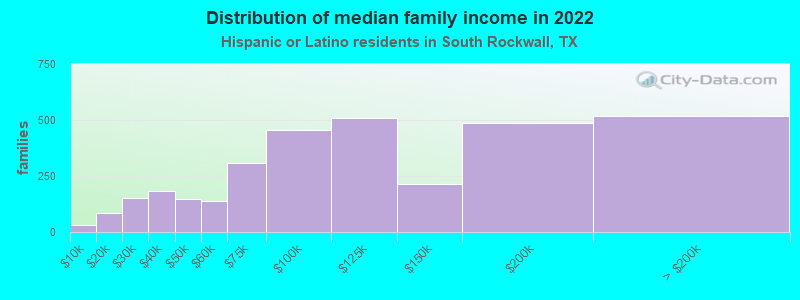
Median family income in South Rockwall in 2022:| South Rockwall: | $109,323 |
| State: | $65,080 |
Number of families with income < $10k:| South Rockwall: | 1.0% (31) |
| Texas: | 5.3% (147,493) |
Number of families with income $10k - 20k:| South Rockwall: | 2.6% (86) |
| State: | 6.3% (174,531) |
Number of families with income $20k - 30k:| South Rockwall: | 4.7% (153) |
| Texas: | 8.6% (238,528) |
Number of families with income $30k - 40k:| South Rockwall: | 5.7% (183) |
| State: | 9.1% (251,999) |
Number of families with income $40k - 50k:| South Rockwall: | 4.6% (149) |
| State: | 8.6% (240,188) |
Number of families with income $50k - 60k:| South Rockwall: | 4.3% (140) |
| Texas: | 8.0% (223,566) |
Number of families with income $60k - 75k:| South Rockwall: | 9.5% (308) |
| Texas: | 10.9% (302,688) |
Number of families with income $75k - 100k:| South Rockwall: | 14.1% (456) |
| State: | 14.3% (398,554) |
Number of families with income $100k - 125k:| South Rockwall: | 15.8% (510) |
| State: | 9.5% (264,007) |
Number of families with income $125k - 150k:| South Rockwall: | 6.6% (214) |
| State: | 6.2% (171,274) |
Number of families with income $150k - 200k:| South Rockwall: | 15.0% (486) |
| State: | 7.3% (202,259) |
Number of families with income > $200k:| South Rockwall: | 16.0% (517) |
| State: | 5.9% (165,129) |
Median non-family income in South Rockwall in 2022:| South Rockwall: | $100,077 |
| State: | $39,934 |
Change in median non-family income between 2000 and 2022:| South Rockwall, Texas: | +58.8% |
| Texas: | +109.1% |
Median per capita income in South Rockwall in 2022:| South Rockwall: | $37,706 |
| State: | $24,862 |
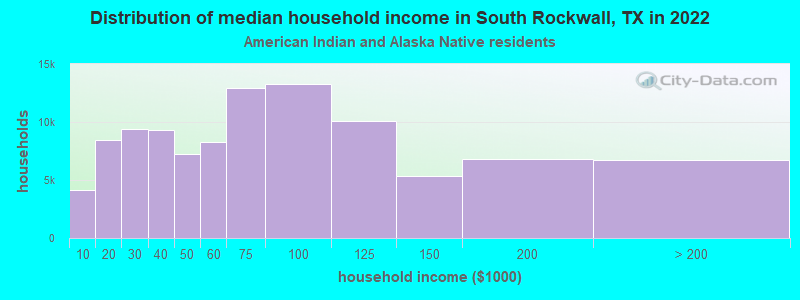
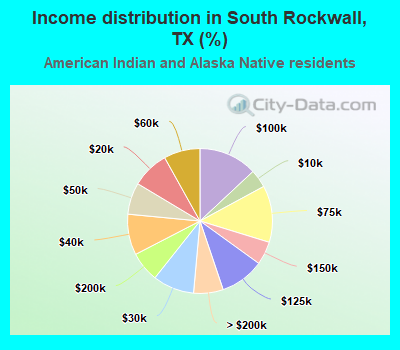
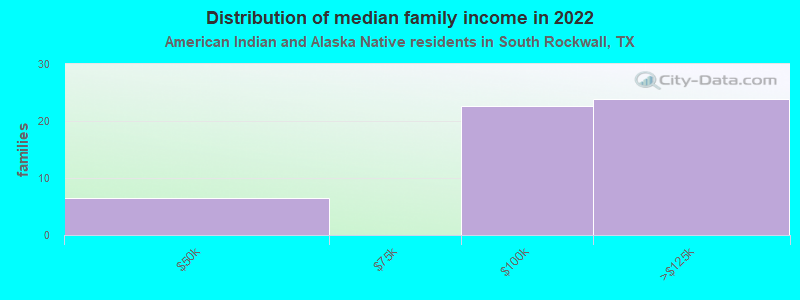
Income statistics for American Indian and Alaska Native residents
Median household income in South Rockwall, TX in 2022:| South Rockwall: | $164,663 |
| State: | $65,765 |
Change in median household income between 2000 and 2022:| South Rockwall, Texas: | +93.7% |
| Texas: | +88.3% |
Number of households with income < $10k:| South Rockwall: | 4.1% (4,142) |
| State: | 4.1% (3,398) |
Number of households with income $10k - 20k:| South Rockwall: | 8.3% (8,470) |
| Texas: | 8.3% (6,949) |
Number of households with income $20k - 30k:| South Rockwall: | 9.3% (9,437) |
| State: | 9.3% (7,742) |
Number of households with income $30k - 40k:| South Rockwall: | 9.1% (9,286) |
| State: | 9.1% (7,627) |
Number of households with income $40k - 50k:| South Rockwall: | 7.1% (7,226) |
| State: | 7.1% (5,922) |
Number of households with income $50k - 60k:| South Rockwall: | 8.1% (8,244) |
| Texas: | 8.1% (6,761) |
Number of households with income $60k - 75k:| South Rockwall: | 12.7% (12,901) |
| Texas: | 12.7% (10,588) |
Number of households with income $75k - 100k:| South Rockwall: | 13.0% (13,294) |
| State: | 13.0% (10,903) |
Number of households with income $100k - 125k:| South Rockwall: | 9.9% (10,065) |
| Texas: | 9.9% (8,256) |
Number of households with income $125k - 150k:| South Rockwall: | 5.2% (5,305) |
| State: | 5.2% (4,355) |
Number of households with income $150k - 200k:| South Rockwall: | 6.7% (6,847) |
| Texas: | 6.7% (5,623) |
Number of households with income > $200k:| South Rockwall: | 6.6% (6,722) |
| Texas: | 6.6% (5,522) |
Aggregate household income in South Rockwall in 2022: $11,173,877
Median family income in South Rockwall in 2022:| South Rockwall: | $156,153 |
| Texas: | $72,369 |
Number of families with income $40k - 50k:| South Rockwall: | 12.3% (7) |
| State: | 7.9% (4,855) |
Number of families with income $75k - 100k:| South Rockwall: | 42.6% (23) |
| Texas: | 14.4% (8,852) |
Number of families with income $100k - 125k:| South Rockwall: | 45.1% (24) |
| Texas: | 11.4% (6,997) |
Median per capita income in South Rockwall in 2022:| South Rockwall: | $27,283 |
| State: | $28,166 |
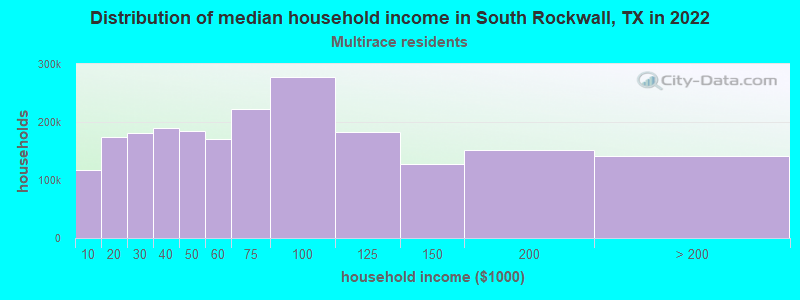
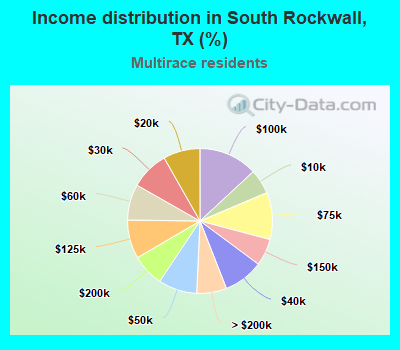
Income statistics for Multirace residents
Median household income in South Rockwall, TX in 2022:| South Rockwall: | $171,425 |
| State: | $62,748 |
Number of households with income < $10k:| South Rockwall: | 5.5% (117,200) |
| State: | 5.5% (122,324) |
Number of households with income $10k - 20k:| South Rockwall: | 8.2% (174,602) |
| Texas: | 8.2% (182,232) |
Number of households with income $20k - 30k:| South Rockwall: | 8.5% (181,333) |
| Texas: | 8.5% (189,456) |
Number of households with income $30k - 40k:| South Rockwall: | 8.9% (189,177) |
| Texas: | 8.9% (197,499) |
Number of households with income $40k - 50k:| South Rockwall: | 8.7% (183,753) |
| State: | 8.7% (191,735) |
Number of households with income $50k - 60k:| South Rockwall: | 8.0% (169,956) |
| State: | 8.0% (177,535) |
Number of households with income $60k - 75k:| South Rockwall: | 10.5% (222,764) |
| State: | 10.5% (232,479) |
Number of households with income $75k - 100k:| South Rockwall: | 13.1% (278,218) |
| Texas: | 13.1% (290,448) |
Number of households with income $100k - 125k:| South Rockwall: | 8.7% (183,609) |
| Texas: | 8.6% (191,595) |
Number of households with income $125k - 150k:| South Rockwall: | 6.0% (127,889) |
| State: | 6.0% (133,361) |
Number of households with income $150k - 200k:| South Rockwall: | 7.2% (152,322) |
| Texas: | 7.2% (159,195) |
Number of households with income > $200k:| South Rockwall: | 6.7% (141,821) |
| Texas: | 6.7% (148,064) |
Aggregate household income in South Rockwall in 2022: $156,364,587
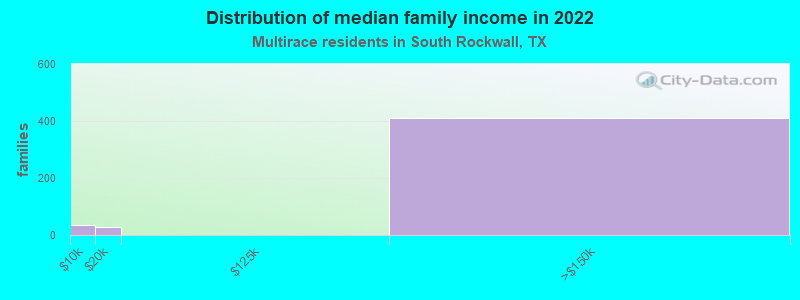
Median family income in South Rockwall in 2022:| South Rockwall: | $73,067 |
| State: | $69,780 |
Number of families with income < $10k:| South Rockwall: | 7.1% (34) |
| State: | 4.4% (70,825) |
Number of families with income $10k - 20k:| South Rockwall: | 6.2% (29) |
| Texas: | 5.9% (95,279) |
Number of families with income $125k - 150k:| South Rockwall: | 86.7% (412) |
| State: | 6.7% (107,900) |
Median non-family income in South Rockwall in 2022:| South Rockwall: | $66,512 |
| Texas: | $40,634 |
Change in median non-family income between 2000 and 2022:| South Rockwall, Texas: | +5.5% |
| State: | +77.2% |
Median per capita income in South Rockwall in 2022:| South Rockwall: | $37,529 |
| State: | $26,785 |
Change in median per capita income between 2000 and 2022:| South Rockwall, Texas: | +135.7% |
| Texas: | +110.9% |
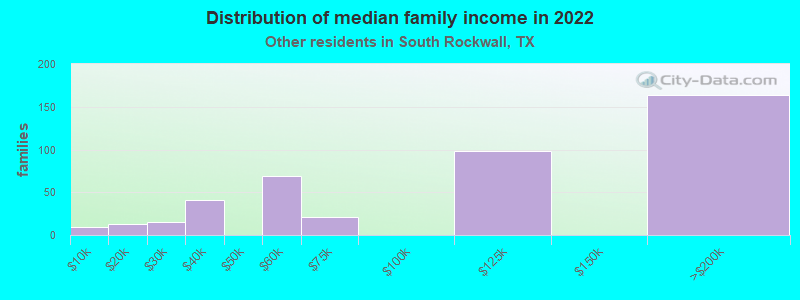
Income statistics for other residents
Number of households with income < $10k:| South Rockwall: | 5.9% (116) |
| State: | 5.9% (54,162) |
Number of households with income $10k - 20k:| South Rockwall: | 6.8% (134) |
| Texas: | 6.8% (62,891) |
Number of households with income $20k - 30k:| South Rockwall: | 10.6% (208) |
| State: | 10.6% (97,294) |
Number of households with income $30k - 40k:| South Rockwall: | 10.9% (214) |
| Texas: | 10.8% (99,670) |
Number of households with income $40k - 50k:| South Rockwall: | 9.3% (182) |
| Texas: | 9.3% (85,548) |
Number of households with income $50k - 60k:| South Rockwall: | 9.0% (177) |
| State: | 9.0% (82,757) |
Number of households with income $60k - 75k:| South Rockwall: | 10.9% (215) |
| Texas: | 10.9% (100,326) |
Number of households with income $75k - 100k:| South Rockwall: | 14.0% (275) |
| State: | 14.0% (128,767) |
Number of households with income $100k - 125k:| South Rockwall: | 8.2% (161) |
| Texas: | 8.2% (75,218) |
Number of households with income $125k - 150k:| South Rockwall: | 4.8% (95) |
| State: | 4.8% (44,223) |
Number of households with income $150k - 200k:| South Rockwall: | 5.6% (110) |
| State: | 5.6% (51,376) |
Number of households with income > $200k:| South Rockwall: | 4.0% (78) |
| State: | 4.0% (36,393) |
Aggregate household income in South Rockwall in 2022: $65,145,384
Median family income in South Rockwall in 2022:| South Rockwall: | $108,205 |
| Texas: | $60,064 |
Number of families with income < $10k:| South Rockwall: | 2.2% (9) |
| State: | 6.8% (47,502) |
Number of families with income $10k - 20k:| South Rockwall: | 3.0% (13) |
| State: | 6.0% (41,763) |
Number of families with income $20k - 30k:| South Rockwall: | 3.4% (15) |
| Texas: | 9.9% (68,761) |
Number of families with income $30k - 40k:| South Rockwall: | 9.6% (41) |
| State: | 9.7% (67,685) |
Number of families with income $50k - 60k:| South Rockwall: | 16.0% (69) |
| State: | 8.5% (59,321) |
Number of families with income $60k - 75k:| South Rockwall: | 4.9% (21) |
| State: | 11.2% (77,588) |
Number of families with income $100k - 125k:| South Rockwall: | 22.7% (98) |
| State: | 8.8% (61,439) |
Number of families with income $150k - 200k:| South Rockwall: | 38.1% (164) |
| State: | 5.9% (41,211) |
Median per capita income in South Rockwall in 2022:| South Rockwall: | $42,470 |
| State: | $23,899 |