Socastee, SC (South Carolina) Houses and Residents
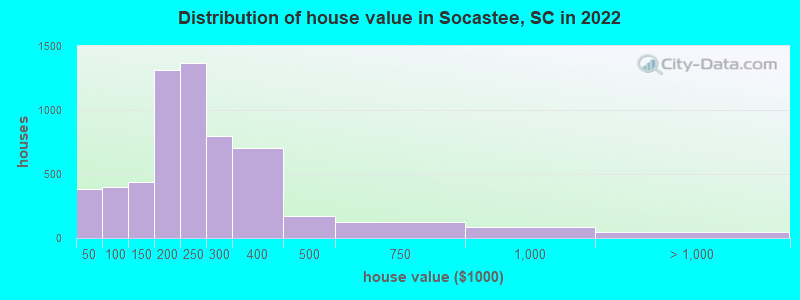
Estimated median house or condo value in 2022: $244,058 (it was $90,500 in 2000 )
Socastee:
$244,058South Carolina:
$254,600
Lower value quartile - upper value quartile: $181,924 - $278,703Mean price in 2022: Detached houses: $279,312 Here:
$279,312State:
$368,255
Townhouses or other attached units: $170,060 Here:
$170,060State:
$292,023
In 5-or-more-unit structures: $216,955 Here:
$216,955State:
$326,361
Mobile homes: $73,910 Here:
$73,910State:
$102,531
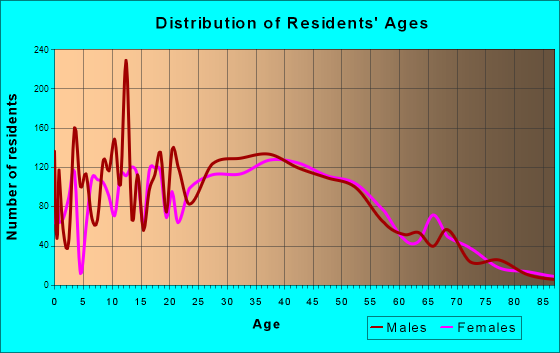
Total population: 19,952 (Urban population: 12,779, Rural population: 1,450 (9 farm, 1,441 nonfarm ))
Houses: 10,406 (9,267 occupied: 6,670 owner occupied, 3,370 renter occupied )
% of renters here:
34%State:
28%
Housing density: 778 houses/condos per square mile
Median price asked for vacant for-sale houses and condos in 2022: $2,928,819.
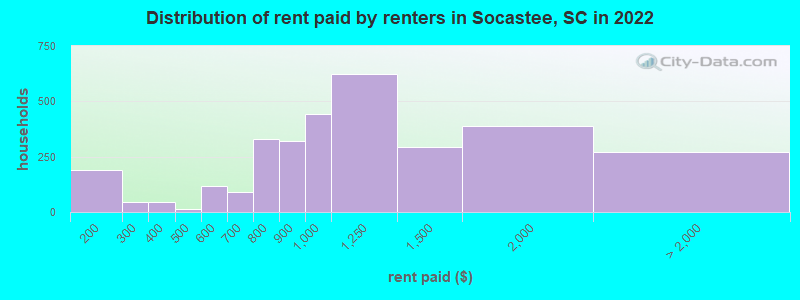
Median contract rent in 2022: $994 (lower quartile is $789, upper quartile is $1,309)
Median rent asked for vacant for-rent units in 2022: $1,063
Median gross rent in Socastee, SC in 2022: $1,185
Housing units in Socastee with a mortgage: 3,928 (264 second mortgage, 10 home equity loan, 182 both second mortgage and home equity loan )Houses without a mortgage: 339
Median household income for houses/condos with a mortgage: $66,873
Median household income for apartments without a mortgage: $50,568
Median monthly housing costs: $1,002
Data:
Median house or condo value ($)
Median house or condo value ($ change since 2000)
Median house or condo value ($) - White
Median house or condo value ($) - Black or African American
Median house or condo value ($) - Asian
Median house or condo value ($) - Hispanic or Latino
Median house or condo value ($) - American Indian and Alaska Native
Median house or condo value ($) - Multirace
Median house or condo value ($) - Other Race
Median price asked for mobile homes ($)
Household density (households per square mile)
Mean house or condo value by units in structure - 1, detached ($)
Mean house or condo value by units in structure - 1, attached ($)
Mean house or condo value by units in structure - 2 ($)
Mean house or condo value by units in structure by units in structure - 3 or 4 ($)
Mean house or condo value by units in structure - 5 or more ($)
Mean house or condo value by units in structure - Boat, RV, van, etc. ($)
Mean house or condo value by units in structure - Mobile home ($)
Median contract rent ($)
Median contract rent - Lower quartile ($)
Median contract rent - Upper quartile ($)
Median gross rent ($)
Urban houses (%)
Rural houses (%)
Houses occupied (%)
Houses occupied (% change since 2000)
Houses owner occupied (%)
Houses owner occupied (% change since 2000)
Houses renter occupied (%)
Houses renter occupied (% change since 2000)
Vacant housing units - For rent (%)
Vacant housing units - For rent (% change since 2000)
Vacant housing units - For sale only (%)
Vacant housing units - For sale only (% change since 2000)
Vacant housing units - Rented or sold, not occupied (%)
Vacant housing units - Rented or sold, not occupied (% change since 2000)
Vacant housing units - For seasonal, recreational, or occasional use (%)
Vacant housing units - For seasonal, recreational, or occasional use (% change since 2000)
Vacant housing units - For migrant workers (%)
Vacant housing units - For migrant workers (% change since 2000)
Vacant housing units - Other vacant (%)
Vacant housing units - Other vacant (% change since 2000)
Median monthly housing costs ($)
Median household income for houses/condos with a mortgage ($)
Median household income for houses/condos without a mortgage ($)
Median household income ($)
Median household income ($) - White
Median household income ($) - Black or African American
Median household income ($) - Asian
Median household income ($) - Hispanic or Latino
Median household income ($) - American Indian and Alaska Native
Median household income ($) - Multirace
Median household income ($) - Other Race
Mortgage status - with mortgage (%)
Mortgage status - with second mortgage (%)
Mortgage status - with home equity loan (%)
Mortgage status - with both second mortgage and home equity loan (%)
Mortgage status - without a mortgage (%)
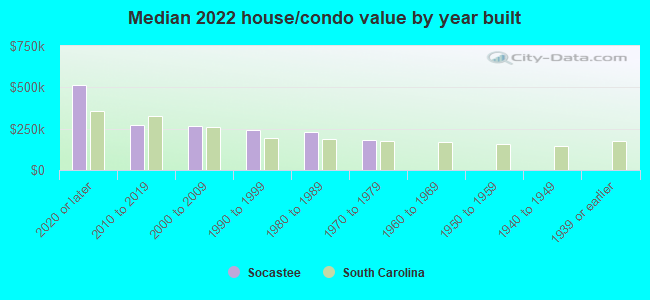
Median year house/condo built
Median year apartment built
Household type by relationship - Male householder living alone (%)
Household type by relationship - Male householder not living alone (%)
Household type by relationship - Female householder living alone (%)
Household type by relationship - Female householder not living alone (%)
Household type by relationship - Opposite-Sex spouse (%)
Household type by relationship - Same-Sex spouse (%)
Household type by relationship - Opposite-Sex unmarried partner (%)
Household type by relationship - Same-Sex unmarried partner (%)
Household type by relationship - In group quarters (%)
Size of family households - 2-person household (%)
Size of family households - 3-person household (%)
Size of family households - 4-person household (%)
Size of family households - 5-person household (%)
Size of family households - 6-person household (%)
Size of family households - 7-or-more-person household (%)
Size of nonfamily households - 1-person household (%)
Size of nonfamily households - 2-person household (%)
Size of nonfamily households - 3-person household (%)
Size of nonfamily households - 4-person household (%)
Size of nonfamily households - 5-person household (%)
Size of nonfamily households - 6-person household (%)
Size of nonfamily households - 7-or-moreperson household (%)
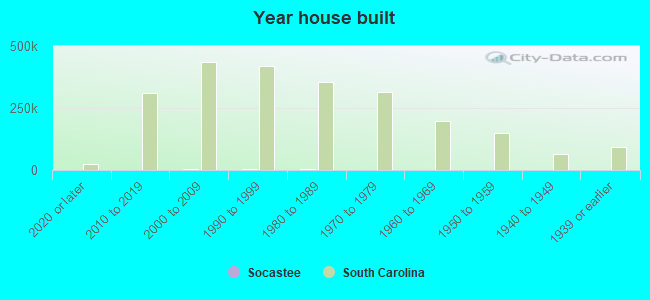
Year house built - Built 2010 or later (%)
Year house built - Built 2000 to 2009 (%)
Year house built - Built 1990 to 1999 (%)
Year house built - Built 1980 to 1989 (%)
Year house built - Built 1970 to 1979 (%)
Year house built - Built 1960 to 1969 (%)
Year house built - Built 1950 to 1959 (%)
Year house built - Built 1940 to 1949 (%)
Year house built - Built 1939 or earlier (%)
Median number of rooms in houses and condos
Median number of rooms in apartments
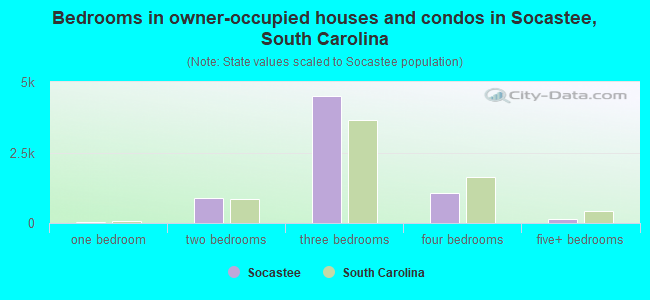
Median number of bedrooms in owner occupied houses
Mean number of bedrooms in owner occupied houses
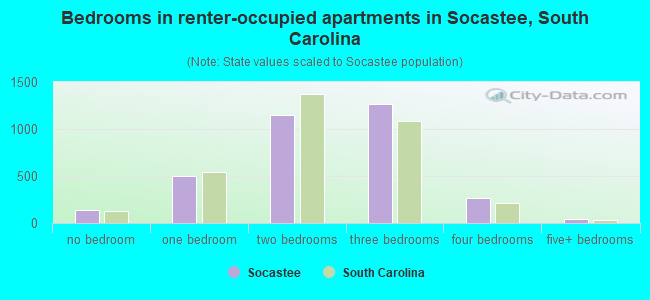
Median number of bedrooms in renter occupied houses
Mean number of bedrooms in renter occupied houses
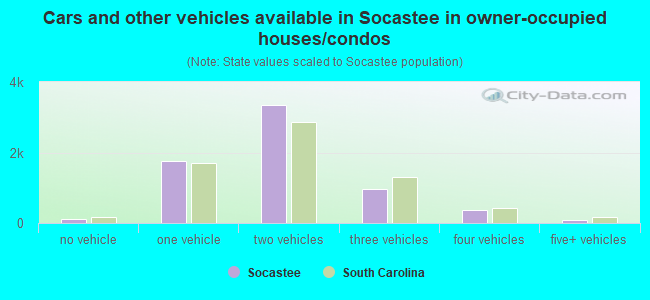
Median number of vehichles in owner occupied houses
Mean number of vehichles in owner occupied houses
Median number of vehichles in renter occupied houses
Mean number of vehichles in renter occupied houses
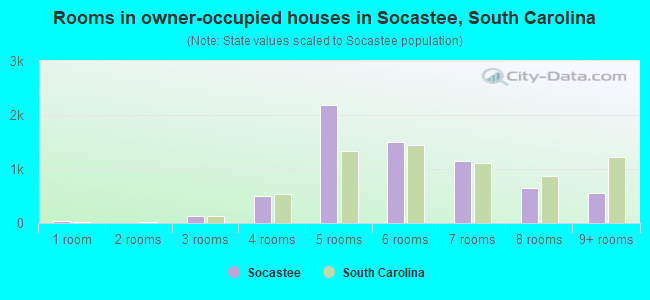
Rooms in owner-occupied houses - 1 room (%)
Rooms in owner-occupied houses - 2 rooms (%)
Rooms in owner-occupied houses - 3 rooms (%)
Rooms in owner-occupied houses - 4 rooms (%)
Rooms in owner-occupied houses - 5 rooms (%)
Rooms in owner-occupied houses - 6 rooms (%)
Rooms in owner-occupied houses - 7 rooms (%)
Rooms in owner-occupied houses - 8 rooms (%)
Rooms in owner-occupied houses - 9+ rooms (%)
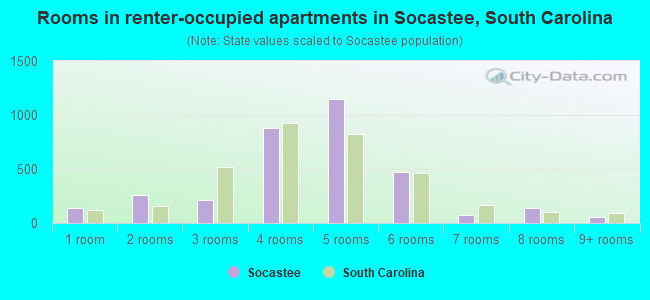
Rooms in renter-occupied houses - 1 room (%)
Rooms in renter-occupied houses - 2 rooms (%)
Rooms in renter-occupied houses - 3 rooms (%)
Rooms in renter-occupied houses - 4 rooms (%)
Rooms in renter-occupied houses - 5 rooms (%)
Rooms in renter-occupied houses - 6 rooms (%)
Rooms in renter-occupied houses - 7 rooms (%)
Rooms in renter-occupied houses - 8 rooms (%)
Rooms in renter-occupied houses - 9+ rooms (%)
Bedrooms in owner-occupied houses - no bedrooms (%)
Bedrooms in owner-occupied houses - 1 bedroom (%)
Bedrooms in owner-occupied houses - 2 bedrooms (%)
Bedrooms in owner-occupied houses - 3 bedrooms (%)
Bedrooms in owner-occupied houses - 4 bedrooms (%)
Bedrooms in owner-occupied houses - 5+ bedrooms (%)
Bedrooms in renter-occupied houses - no bedrooms (%)
Bedrooms in renter-occupied houses - 1 bedroom (%)
Bedrooms in renter-occupied houses - 2 bedrooms (%)
Bedrooms in renter-occupied houses - 3 bedrooms (%)
Bedrooms in renter-occupied houses - 4 bedrooms (%)
Bedrooms in renter-occupied houses - 5+ bedrooms (%)
Vehicles available in owner-occupied houses - no vehicle available (%)
Vehicles available in owner-occupied houses - 1 vehicle available(%)
Vehicles available in owner-occupied houses - 2 Vehicles available (%)
Vehicles available in owner-occupied houses - 3 Vehicles available (%)
Vehicles available in owner-occupied houses - 4 Vehicles available (%)
Vehicles available in owner-occupied houses - 5+ Vehicles available (%)
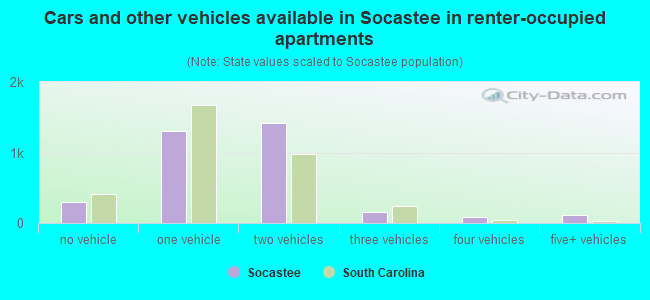
Vehicles available in renter-occupied houses - no vehicle available (%)
Vehicles available in renter-occupied houses - 1 vehicle available (%)
Vehicles available in renter-occupied houses - 2 Vehicles available (%)
Vehicles available in renter-occupied houses - 3 Vehicles available (%)
Vehicles available in renter-occupied houses - 4 Vehicles available (%)
Vehicles available in renter-occupied houses - 5+ Vehicles available (%)
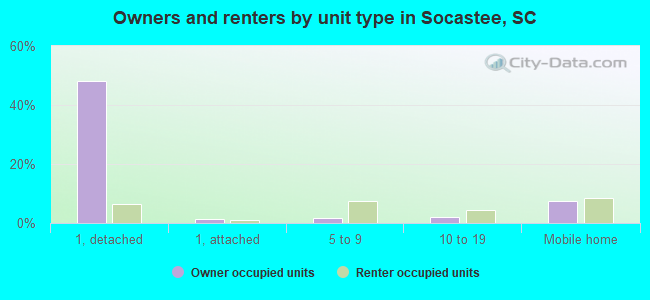
Housing units in structures - 1, detached (%)
Housing units in structures - 1, attached (%)
Housing units in structures - 2 (%)
Housing units in structures - 3 or 4 (%)
Housing units in structures - 5 to 9 (%)
Housing units in structures - 10 to 19 (%)
Housing units in structures - 20 to 49 (%)
Housing units in structures - 50 or more (%)
Housing units in structures - Mobile home (%)
Housing units in structures - Boat, RV, van, etc. (%)
Housing units in structures - Owners - 1, detached (%)
Housing units in structures - Owners - 1, attached (%)
Housing units in structures - Owners - 2 (%)
Housing units in structures - Owners - 3 or 4 (%)
Housing units in structures - Owners - 5 to 9 (%)
Housing units in structures - Owners - 10 to 19 (%)
Housing units in structures - Owners - 20 to 49 (%)
Housing units in structures - Owners - 50 or more (%)
Housing units in structures - Owners - Mobile home (%)
Housing units in structures - Owners - Boat, RV, van, etc. (%)
Housing units in structures - Renters - 1, detached (%)
Housing units in structures - Renters - 1, attached (%)
Housing units in structures - Renters - 2 (%)
Housing units in structures - Renters - 3 or 4 (%)
Housing units in structures - Renters - 5 to 9 (%)
Housing units in structures - Renters - 10 to 19 (%)
Housing units in structures - Renters - 20 to 49 (%)
Housing units in structures - Renters - 50 or more (%)
Housing units in structures - Renters - Mobile home (%)
Housing units in structures - Renters - Boat, RV, van, etc. (%)
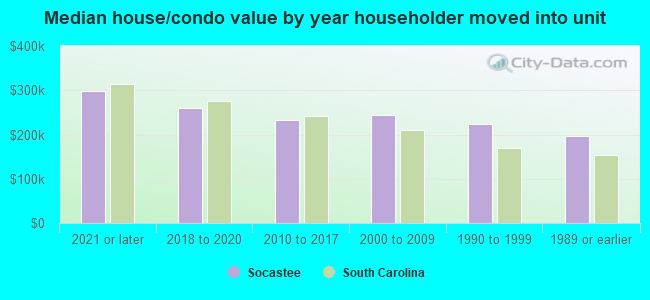
House/condo owner moved in on average (years ago)
Renter moved in on average (years ago)
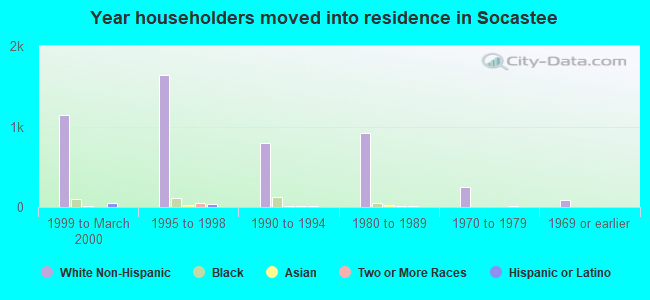
Year householder moved into unit - Moved in 1999 to March 2000 (%)
Year householder moved into unit - Moved in 1999 to March 2000 (%) - White
Year householder moved into unit - Moved in 1999 to March 2000 (%) - Black or African American
Year householder moved into unit - Moved in 1999 to March 2000 (%) - Asian
Year householder moved into unit - Moved in 1999 to March 2000 (%) - Hispanic or Latino
Year householder moved into unit - Moved in 1999 to March 2000 (%) - American Indian and Alaska Native
Year householder moved into unit - Moved in 1999 to March 2000 (%) - Multirace
Year householder moved into unit - Moved in 1999 to March 2000 (%) - Other Race
Year householder moved into unit - Moved in 1995 to 1998 (%)
Year householder moved into unit - Moved in 1995 to 1998 (%) - White
Year householder moved into unit - Moved in 1995 to 1998 (%) - Black or African American
Year householder moved into unit - Moved in 1995 to 1998 (%) - Asian
Year householder moved into unit - Moved in 1995 to 1998 (%) - Hispanic or Latino
Year householder moved into unit - Moved in 1995 to 1998 (%) - American Indian and Alaska Native
Year householder moved into unit - Moved in 1995 to 1998 (%) - Multirace
Year householder moved into unit - Moved in 1995 to 1998 (%) - Other Race
Year householder moved into unit - Moved in 1990 to 1994 (%)
Year householder moved into unit - Moved in 1990 to 1994 (%) - White
Year householder moved into unit - Moved in 1990 to 1994 (%) - Black or African American
Year householder moved into unit - Moved in 1990 to 1994 (%) - Asian
Year householder moved into unit - Moved in 1990 to 1994 (%) - Hispanic or Latino
Year householder moved into unit - Moved in 1990 to 1994 (%) - American Indian and Alaska Native
Year householder moved into unit - Moved in 1990 to 1994 (%) - Multirace
Year householder moved into unit - Moved in 1990 to 1994 (%) - Other Race
Year householder moved into unit - Moved in 1980 to 1989 (%)
Year householder moved into unit - Moved in 1980 to 1989 (%) - White
Year householder moved into unit - Moved in 1980 to 1989 (%) - Black or African American
Year householder moved into unit - Moved in 1980 to 1989 (%) - Asian
Year householder moved into unit - Moved in 1980 to 1989 (%) - Hispanic or Latino
Year householder moved into unit - Moved in 1980 to 1989 (%) - American Indian and Alaska Native
Year householder moved into unit - Moved in 1980 to 1989 (%) - Multirace
Year householder moved into unit - Moved in 1980 to 1989 (%) - Other Race
Year householder moved into unit - Moved in 1970 to 1979 (%)
Year householder moved into unit - Moved in 1970 to 1979 (%) - White
Year householder moved into unit - Moved in 1970 to 1979 (%) - Black or African American
Year householder moved into unit - Moved in 1970 to 1979 (%) - Asian
Year householder moved into unit - Moved in 1970 to 1979 (%) - Hispanic or Latino
Year householder moved into unit - Moved in 1970 to 1979 (%) - American Indian and Alaska Native
Year householder moved into unit - Moved in 1970 to 1979 (%) - Multirace
Year householder moved into unit - Moved in 1970 to 1979 (%) - Other Race
Year householder moved into unit - Moved in 1969 or earlier (%)
Year householder moved into unit - Moved in 1969 or earlier (%) - White
Year householder moved into unit - Moved in 1969 or earlier (%) - Black or African American
Year householder moved into unit - Moved in 1969 or earlier (%) - Asian
Year householder moved into unit - Moved in 1969 or earlier (%) - Hispanic or Latino
Year householder moved into unit - Moved in 1969 or earlier (%) - American Indian and Alaska Native
Year householder moved into unit - Moved in 1969 or earlier (%) - Multirace
Year householder moved into unit - Moved in 1969 or earlier (%) - Other Race
Housing units lacking complete plumbing facilities (%)
Housing units lacking complete kitchen facilities (%)
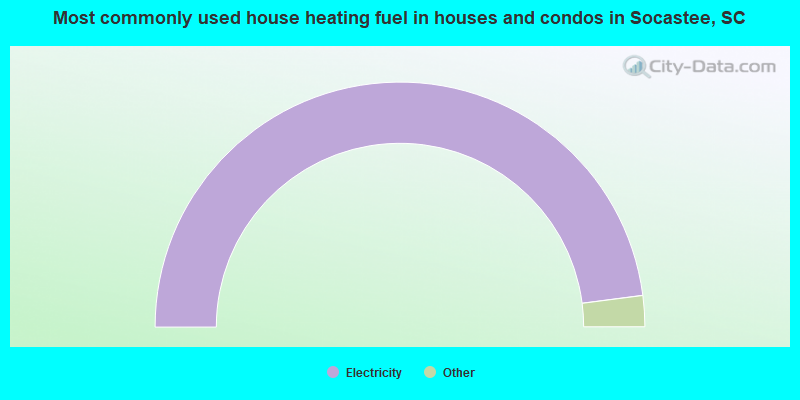
House heating fuel used in houses and condos - Utility gas (%)
House heating fuel used in houses and condos - Bottled, tank, or LP gas (%)
House heating fuel used in houses and condos - Electricity (%)
House heating fuel used in houses and condos - Fuel oil, kerosene, etc. (%)
House heating fuel used in houses and condos - Coal or coke (%)
House heating fuel used in houses and condos - Wood (%)
House heating fuel used in houses and condos - Solar energy (%)
House heating fuel used in houses and condos - Other fuel (%)
House heating fuel used in houses and condos - No fuel used (%)
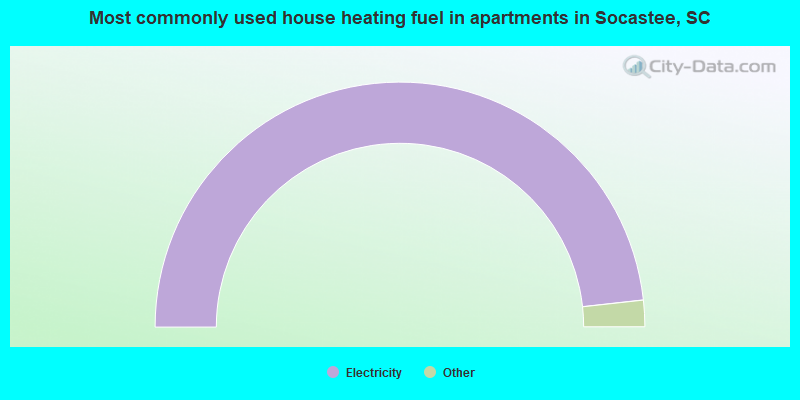
House heating fuel used in apartments - Utility gas (%)
House heating fuel used in apartments - Bottled, tank, or LP gas (%)
House heating fuel used in apartments - Electricity (%)
House heating fuel used in apartments - Fuel oil, kerosene, etc. (%)
House heating fuel used in apartments - Coal or coke (%)
House heating fuel used in apartments - Wood (%)
House heating fuel used in apartments - Solar energy (%)
House heating fuel used in apartments - Other fuel (%)
House heating fuel used in apartments - No fuel used (%)
Latest news about housing in Socastee, SC collected exclusively by city-data.com from local newspapers, TV, and radio stations
Median year house/condo built: 1998Median year apartment built: 1996Household type by relationship:
Households: 26,283
Male householders: 4,525 (1,284 living alone ), Female householders: 4,948 (1,270 living alone )4,495 spouses (4,470 opposite-sex spouses ), 987 unmarried partners , (975 opposite-sex unmarried partners ), 6,524 children (6,242 natural , 80 adopted , 201 stepchildren ), 908 grandchildren , 428 brothers or sisters , 545 parents , 0 foster children , 564 other relatives , 2,263 non-relatives In group quarters: 91
Size of family households: 3,930 2-persons , 1,253 3-persons , 700 4-persons , 417 5-persons , 56 6-persons , 60 7-or-more-persons .
Size of nonfamily households: 2,573 1-person , 671 2-persons , 93 3-persons , 209 4-persons .
2,928 married couples with children. single-parent households (235 men , 769 women ).
87.3% of residents of Socastee speak English at home. of residents speak Spanish at home (54% speak English very well , 27% speak English well , 17% speak English not well , 2% don't speak English at all ).of residents speak other Indo-European language at home (46% speak English very well , 23% speak English well , 30% don't speak English at all ).of residents speak Asian or Pacific Island language at home (58% speak English very well , 25% speak English well , 14% speak English not well , 3% don't speak English at all ).of residents speak other language at home (100% speak English very well ).
Foreign born population: 2,713 (10.3%)of them are naturalized citizens )
Median number of rooms in houses and condos:
Median number of rooms in apartments
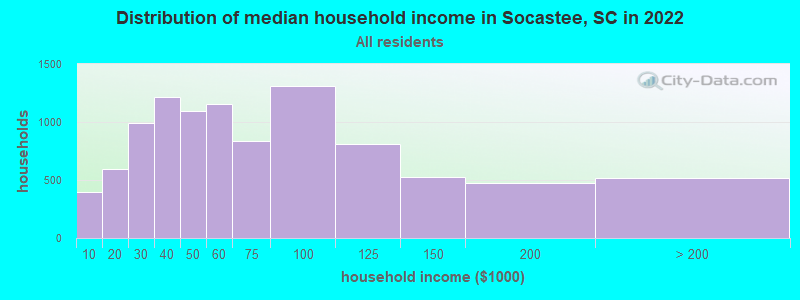
Socastee, SC household income distribution 399 Less than $10,000599 $10,000 to $19,999991 $20,000 to $29,9991,217 $30,000 to $39,9991,095 $40,000 to $49,9991,158 $50,000 to $59,999835 $60,000 to $74,9991,313 $75,000 to $99,999807 $100,000 to $124,999528 $125,000 to $149,999473 $150,000 to $199,999515 $200,000 or more
Home value of owner - occupied houses in 2022 in Socastee, SC 58 Less than $10,00080 $10,000 to $14,99956 $15,000 to $19,99944 $20,000 to $24,99919 $25,000 to $29,99923 $30,000 to $34,99927 $35,000 to $39,99970 $40,000 to $49,99996 $50,000 to $59,99983 $60,000 to $69,99973 $70,000 to $79,99952 $80,000 to $89,99924 $90,000 to $99,999189 $100,000 to $124,999248 $125,000 to $149,999506 $150,000 to $174,999804 $175,000 to $199,9991,370 $200,000 to $249,999796 $250,000 to $299,999706 $300,000 to $399,999174 $400,000 to $499,999124 $500,000 to $749,99989 $750,000 to $999,99944 $1,000,000 to $1,499,999Rent paid by renters in 2022 in Socastee, SC 143 $100 to $14946 $150 to $19938 $200 to $2496 $250 to $29928 $300 to $34917 $350 to $39913 $450 to $49981 $500 to $54935 $550 to $59950 $600 to $64942 $650 to $699217 $700 to $749111 $750 to $799323 $800 to $899441 $900 to $999623 $1,000 to $1,249293 $1,250 to $1,499388 $1,500 to $1,99924 $2,500 to $2,999244 No cash rent
Percentage of workers working in this county: 93.1%Number of people working at home: 1,184 (9.4% of all workers )
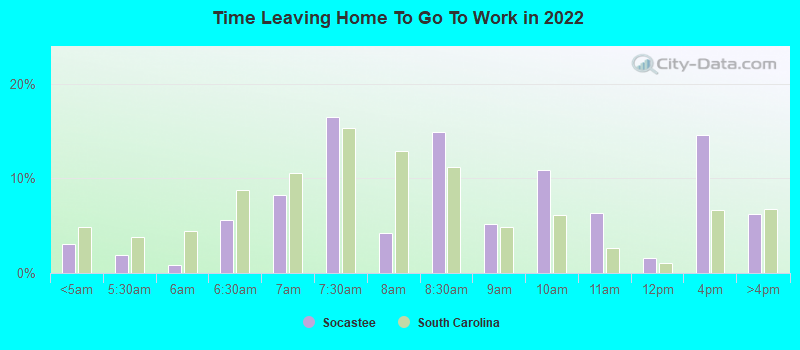
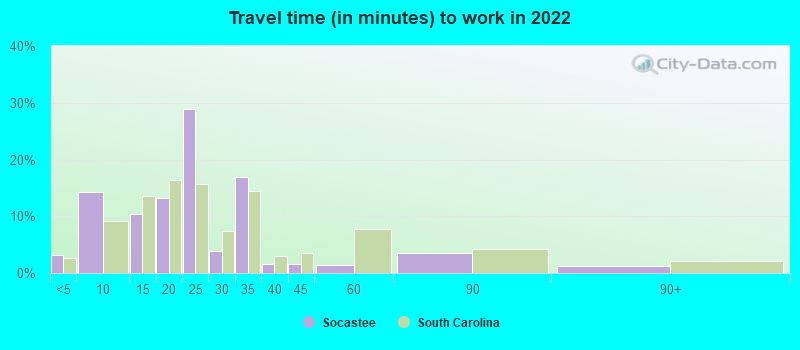
Travel time to work (commute)
Less than 5 minutes: 1025 to 9 minutes: 66010 to 14 minutes: 1,30715 to 19 minutes: 2,15720 to 24 minutes: 3,85225 to 29 minutes: 78630 to 34 minutes: 1,48435 to 39 minutes: 4440 to 44 minutes: 16845 to 59 minutes: 46260 to 89 minutes: 9690 or more minutes: 120
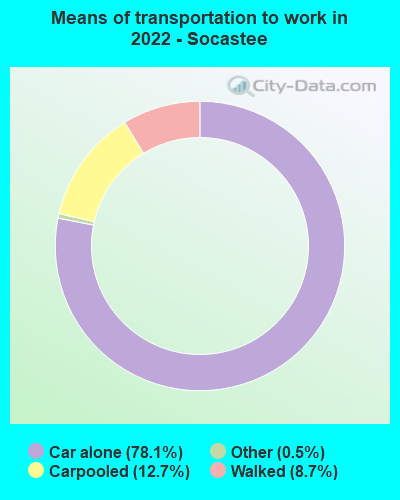
Means of transportation to work:
Drove a car alone: 2,876 (60.0%)Carpooled: 573 (12.0%)Taxi: 34 (0.7%)Walked: 324 (6.8%)Worked at home: 1,184 (24.7%)
Unemployment by race in 2022
Unemployment rate for White non-Hispanic residents 2.9% Males3.2% FemalesUnemployment rate for Black residents 34.7% FemalesUnemployment rate for Asian residents 4.1% MalesUnemployment rate for other race residents 10.8% MalesUnemployment rate for Hispanic or Latino residents 4.3% Males
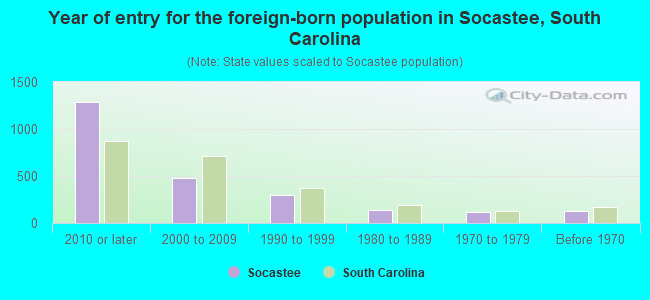
Year of entry for the foreign-born population in Socastee, South Carolina
1,292 2010 or later 474 2000 to 2009 294 1990 to 1999 139 1980 to 1989 113 1970 to 1979 128 Before 1970
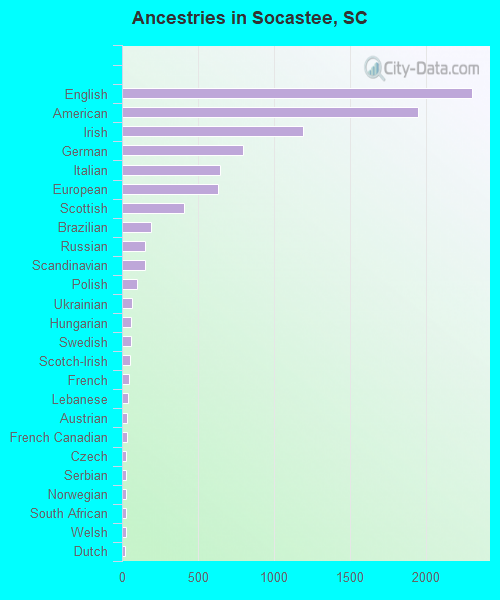
First ancestries reported:
English: 2,300 (15.7%)
American: 1,949 (13.3%)
Irish: 1,194 (8.2%)
German: 797 (5.5%)
Italian: 647 (4.4%)
European: 629 (4.3%)
Scottish: 406 (2.8%)
Brazilian: 191 (1.3%)
Russian: 150 (1.0%)
Scandinavian: 149 (1.0%)
Polish: 101 (0.7%)
Ukrainian: 63 (0.4%)
Hungarian: 58 (0.4%)
Swedish: 58 (0.4%)
Scotch-Irish: 51 (0.3%)
French: 45 (0.3%)
Lebanese: 37 (0.3%)
Austrian: 33 (0.2%)
French Canadian: 32 (0.2%)
Czech: 29 (0.2%)
Serbian: 29 (0.2%)
Norwegian: 28 (0.2%)
South African: 27 (0.2%)
Welsh: 26 (0.2%)
Dutch: 23 (0.2%)
African: 21 (0.1%)
British: 20 (0.1%)
Finnish: 18 (0.1%)
Eastern European: 16 (0.1%)
Canadian: 10 (0.07%)
Lithuanian: 8 (0.05%)
Danish: 8 (0.05%)
Albanian: 5 (0.03%) Most common places of birth for foreign-born residents (%): Mexico Socastee:
38.7% (930)South Carolina:
22.5% (60,774)
Moldova Socastee:
17.2% (414)South Carolina:
0.3% (770)
Guatemala Socastee:
8.0% (192)South Carolina:
3.4% (9,058)
Brazil Socastee:
7.2% (172)South Carolina:
2.0% (5,344)
Honduras Socastee:
5.5% (133)South Carolina:
4.8% (12,834)
Serbia Socastee:
4.6% (110)South Carolina:
0.1% (136)
Chile Socastee:
4.2% (102)South Carolina:
0.2% (567)
Costa Rica Socastee:
3.6% (87)South Carolina:
0.5% (1,395)
Dominican Republic Socastee:
3.5% (85)South Carolina:
0.9% (2,357)
Philippines Socastee:
2.0% (47)South Carolina:
4.1% (11,031)
Place of birth for U.S.-born residents:
This state: 8,932Other state: 14,456Northeast: 6,365Midwest: 1,845South: 5,177West: 1,049 85.2% of Socastee residents lived in the same house 1 years ago.
Out of people who lived in different houses, 37.0% lived in this county.
Out of people who lived in different counties, 34.7% lived in South Carolina.
Socastee:
85.2%State average:
86.5%
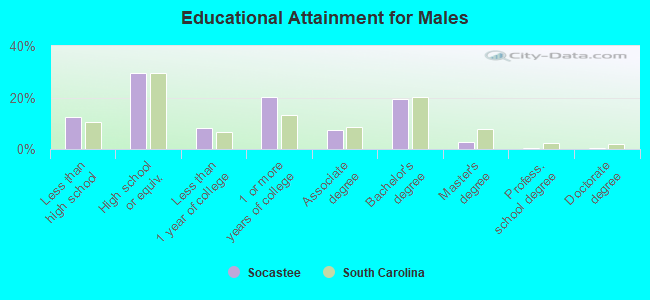
Education attainment for males 25 years and older:
No schooling: 427Nursery to 4th grade: 85th and 6th grade: 337th and 8th grade: 1289th grade: 16110th grade: 12711th grade: 15012th grade, no diploma: 174High school graduate (or equivalency): 2,895Less than 1 year of college: 791Some college more than 1 year, no degree: 1,971Associate degree: 715Bachelor's degree: 1,896Master's degree: 253Professional school degree: 33Doctorate degree: 29
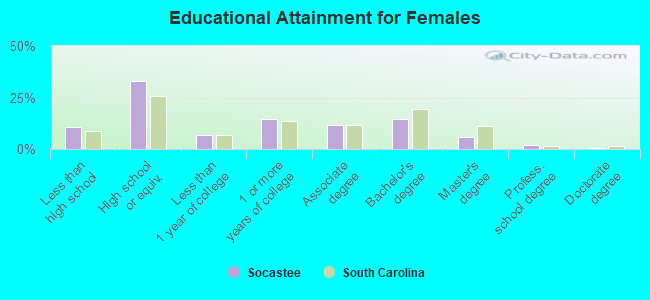
Education attainment for females 25 years and older:
No schooling: 44Nursery to 4th grade: 905th and 6th grade: 1217th and 8th grade: 809th grade: 27310th grade: 11511th grade: 17712th grade, no diploma: 146High school graduate (or equivalency): 3,206Less than 1 year of college: 677Some college more than 1 year, no degree: 1,434Associate degree: 1,151Bachelor's degree: 1,406Master's degree: 588Professional school degree: 185Doctorate degree: 41
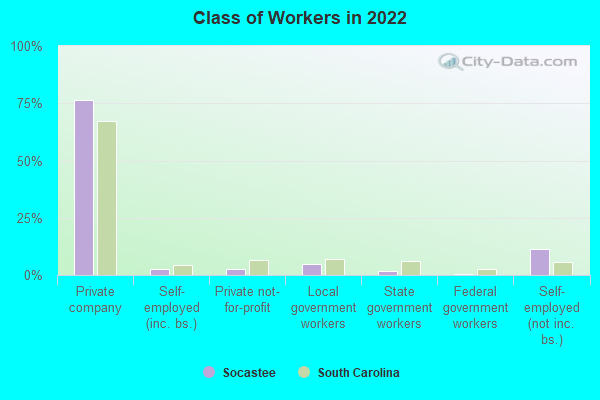
Housing units in structures:
One, detached: 6,095One, attached: 189Two: 803 or 4: 4705 to 9: 68410 to 19: 68920 to 49: 46550 or more: 154Mobile homes: 1,575Median worth of mobile homes: $69,085
Housing units lacking complete plumbing facilities in 2022: 0.1%Housing units lacking complete kitchen facilities in 2022: 0.4%House/condo owner moved in on average 10 years ago
Renter moved in on average 4 years ago
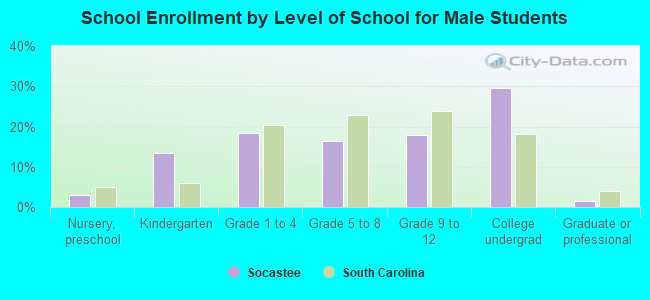
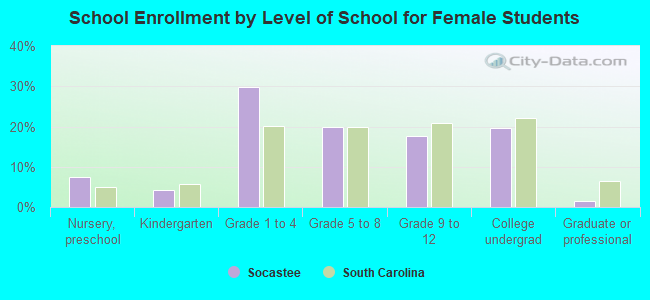
Private vs. public school enrollment:
Students in private schools in grades 1 to 8 (elementary and middle school): 295 Here:
15.1%South Carolina:
14.4%
Students in private schools in grades 9 to 12 (high school): 41 Here:
5.4%South Carolina:
11.1%
Students in private undergraduate colleges: 98 Here:
8.5%South Carolina:
21.9%