Races in Socastee, South Carolina (SC) Detailed Stats
Data:
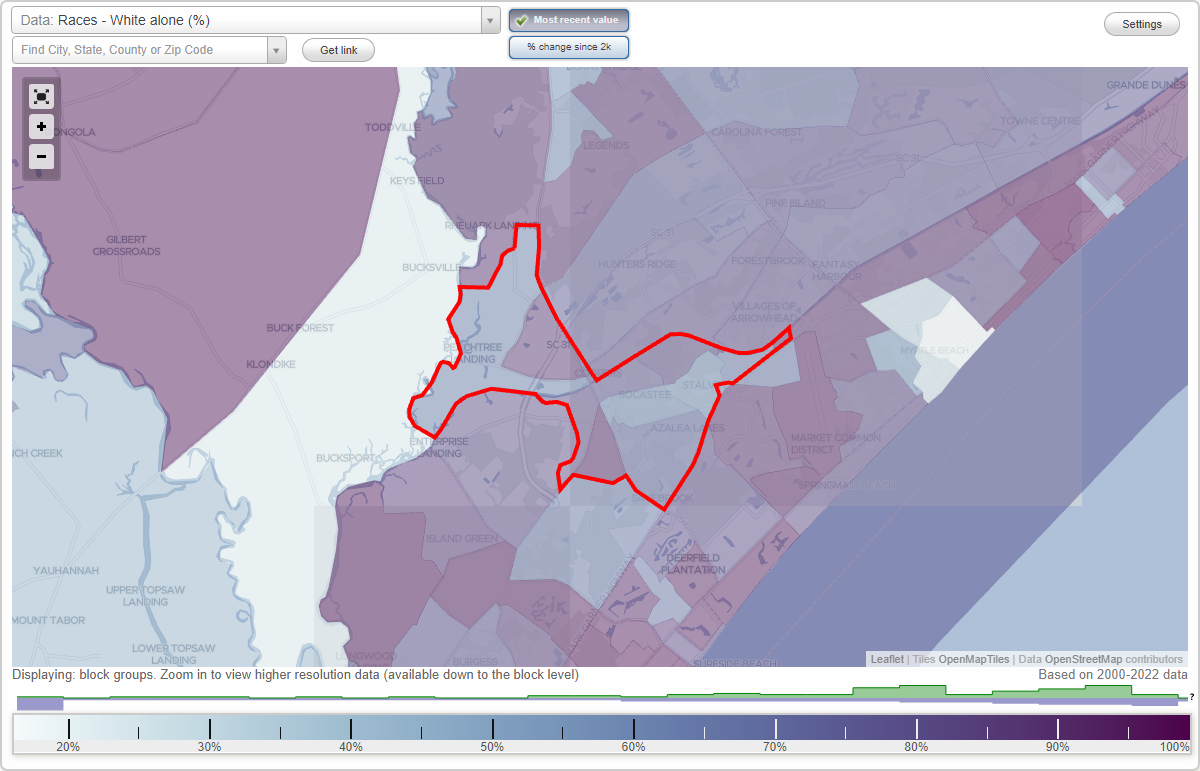
Races - White alone (%)
Races - White alone (% change since 2000)
Races - Black alone (%)
Races - Black alone (% change since 2000)
Races - American Indian alone (%)
Races - American Indian alone (% change since 2000)
Races - Asian alone (%)
Races - Asian alone (% change since 2000)
Races - Hispanic (%)
Races - Hispanic (% change since 2000)
Races - Native Hawaiian and Other Pacific Islander alone (%)
Races - Native Hawaiian and Other Pacific Islander alone (% change since 2000)
Races - Two or more races(%)
Races - Two or more races(% change since 2000)
Races - Other race alone (%)
Races - Other race alone (% change since 2000)
Racial diversity
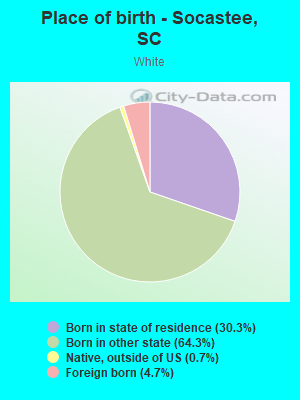
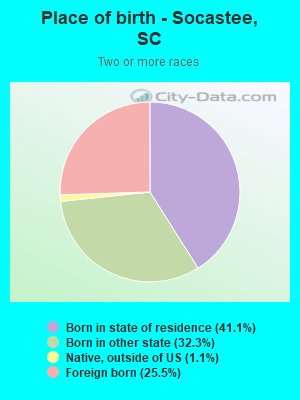
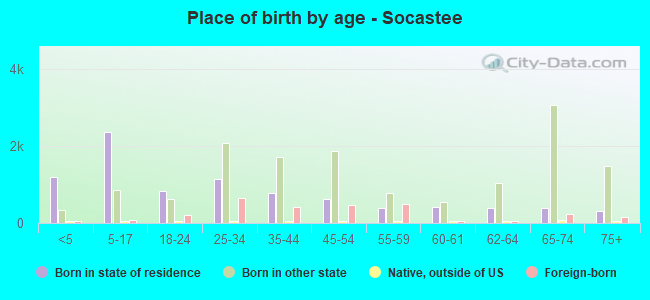
Place of birth - Born in state of residence (%)
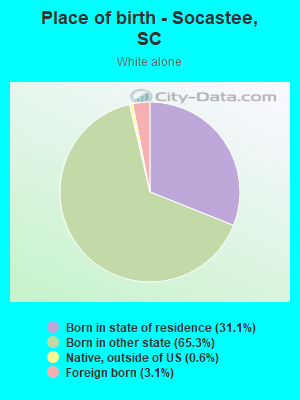
Place of birth - Born in state of residence (%) - White
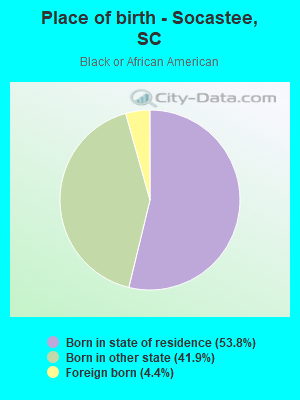
Place of birth - Born in state of residence (%) - Black or African American
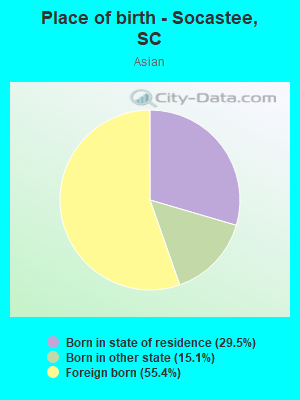
Place of birth - Born in state of residence (%) - Asian
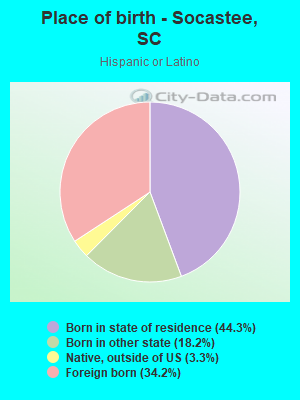
Place of birth - Born in state of residence (%) - Hispanic or Latino
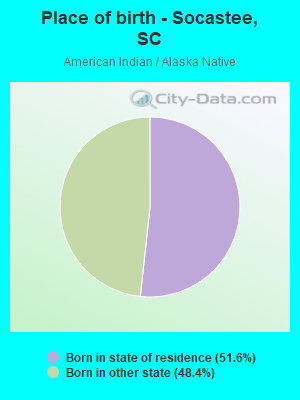
Place of birth - Born in state of residence (%) - American Indian and Alaska Native
Place of birth - Born in state of residence (%) - Multirace
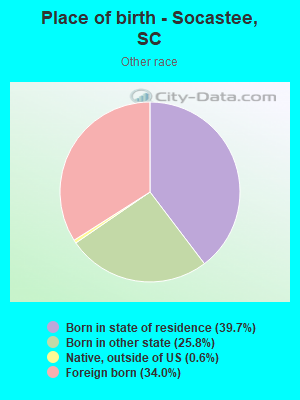
Place of birth - Born in state of residence (%) - Other Race
Place of birth - Born in other state (%)
Place of birth - Born in other state (%) - White
Place of birth - Born in other state (%) - Black or African American
Place of birth - Born in other state (%) - Asian
Place of birth - Born in other state (%) - Hispanic or Latino
Place of birth - Born in other state (%) - American Indian and Alaska Native
Place of birth - Born in other state (%) - Multirace
Place of birth - Born in other state (%) - Other Race
Place of birth - Native, outside of US (%)
Place of birth - Native, outside of US (%) - White
Place of birth - Native, outside of US (%) - Black or African American
Place of birth - Native, outside of US (%) - Asian
Place of birth - Native, outside of US (%) - Hispanic or Latino
Place of birth - Native, outside of US (%) - American Indian and Alaska Native
Place of birth - Native, outside of US (%) - Multirace
Place of birth - Native, outside of US (%) - Other Race
Place of birth - Foreign born (%)
Place of birth - Foreign born (%) - White
Place of birth - Foreign born (%) - Black or African American
Place of birth - Foreign born (%) - Asian
Place of birth - Foreign born (%) - Hispanic or Latino
Place of birth - Foreign born (%) - American Indian and Alaska Native
Place of birth - Foreign born (%) - Multirace
Place of birth - Foreign born (%) - Other Race
Residents speaking English at home (%)
Residents speaking English at home - Born in the United States (%)
Residents speaking English at home - Native, born elsewhere (%)
Residents speaking English at home - Foreign born (%)
Residents speaking Spanish at home (%)
Residents speaking Spanish at home - Born in the United States (%)
Residents speaking Spanish at home - Native, born elsewhere (%)
Residents speaking Spanish at home - Foreign born (%)
Residents speaking other language at home (%)
Residents speaking other language at home - Born in the United States (%)
Residents speaking other language at home - Native, born elsewhere (%)
Residents speaking other language at home - Foreign born (%)
Marital status - Never married (%)
Marital status - Now married (%)
Marital status - Separated (%)
Marital status - Widowed (%)
Marital status - Divorced (%)
Ancestries Reported - Arab (%)
Ancestries Reported - Czech (%)
Ancestries Reported - Danish (%)
Ancestries Reported - Dutch (%)
Ancestries Reported - English (%)
Ancestries Reported - French (%)
Ancestries Reported - French Canadian (%)
Ancestries Reported - German (%)
Ancestries Reported - Greek (%)
Ancestries Reported - Hungarian (%)
Ancestries Reported - Irish (%)
Ancestries Reported - Italian (%)
Ancestries Reported - Lithuanian (%)
Ancestries Reported - Norwegian (%)
Ancestries Reported - Polish (%)
Ancestries Reported - Portuguese (%)
Ancestries Reported - Russian (%)
Ancestries Reported - Scotch-Irish (%)
Ancestries Reported - Scottish (%)
Ancestries Reported - Slovak (%)
Ancestries Reported - Subsaharan African (%)
Ancestries Reported - Swedish (%)
Ancestries Reported - Swiss (%)
Ancestries Reported - Ukrainian (%)
Ancestries Reported - United States (%)
Ancestries Reported - Welsh (%)
Ancestries Reported - West Indian (%)
Ancestries Reported - Other (%)
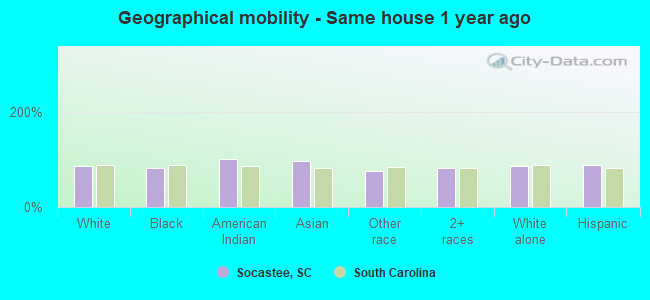
Geographical mobility - Same house 1 year ago (%)
Geographical mobility - Same house 1 year ago (%) - White
Geographical mobility - Same house 1 year ago (%) - Black or African American
Geographical mobility - Same house 1 year ago (%) - Asian
Geographical mobility - Same house 1 year ago (%) - Hispanic or Latino
Geographical mobility - Same house 1 year ago (%) - American Indian and Alaska Native
Geographical mobility - Same house 1 year ago (%) - Multirace
Geographical mobility - Same house 1 year ago (%) - Other Race
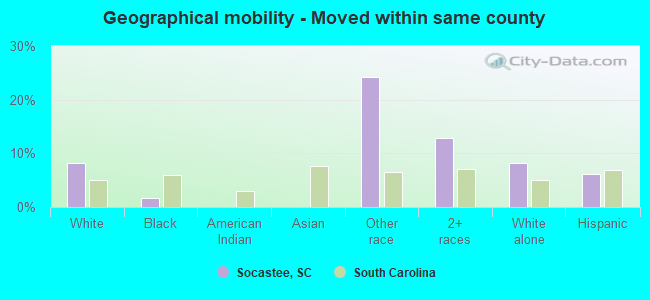
Geographical mobility - Moved within same county (%)
Geographical mobility - Moved within same county (%) - White
Geographical mobility - Moved within same county (%) - Black or African American
Geographical mobility - Moved within same county (%) - Asian
Geographical mobility - Moved within same county (%) - Hispanic or Latino
Geographical mobility - Moved within same county (%) - American Indian and Alaska Native
Geographical mobility - Moved within same county (%) - Multirace
Geographical mobility - Moved within same county (%) - Other Race
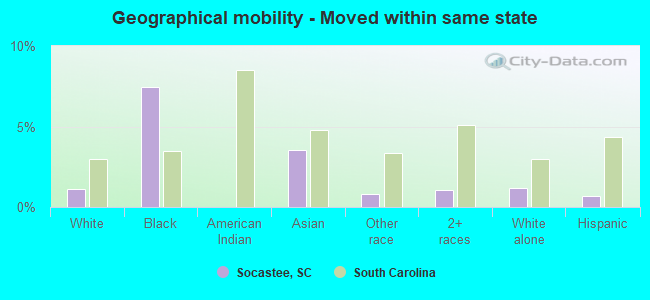
Geographical mobility - Moved from different county within same state (%)
Geographical mobility - Moved from different county within same state (%) - White
Geographical mobility - Moved from different county within same state (%) - Black or African American
Geographical mobility - Moved from different county within same state (%) - Asian
Geographical mobility - Moved from different county within same state (%) - Hispanic or Latino
Geographical mobility - Moved from different county within same state (%) - American Indian and Alaska Native
Geographical mobility - Moved from different county within same state (%) - Multirace
Geographical mobility - Moved from different county within same state (%) - Other Race
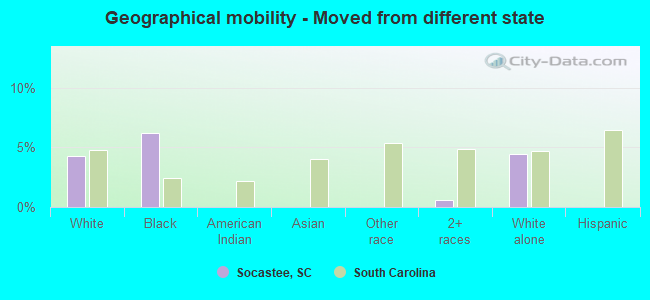
Geographical mobility - Moved from different state (%)
Geographical mobility - Moved from different state (%) - White
Geographical mobility - Moved from different state (%) - Black or African American
Geographical mobility - Moved from different state (%) - Asian
Geographical mobility - Moved from different state (%) - Hispanic or Latino
Geographical mobility - Moved from different state (%) - American Indian and Alaska Native
Geographical mobility - Moved from different state (%) - Multirace
Geographical mobility - Moved from different state (%) - Other Race
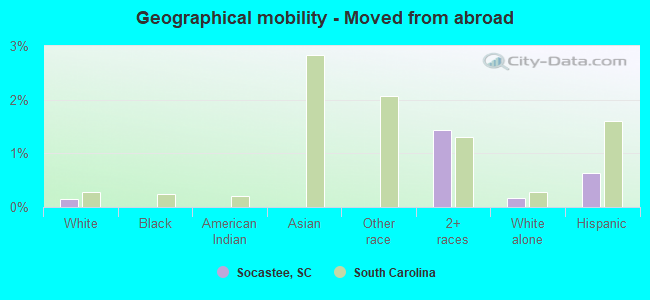
Geographical mobility - Moved from abroad (%)
Geographical mobility - Moved from abroad (%) - White
Geographical mobility - Moved from abroad (%) - Black or African American
Geographical mobility - Moved from abroad (%) - Asian
Geographical mobility - Moved from abroad (%) - Hispanic or Latino
Geographical mobility - Moved from abroad (%) - American Indian and Alaska Native
Geographical mobility - Moved from abroad (%) - Multirace
Geographical mobility - Moved from abroad (%) - Other Race
Place of birth for the foreign-born population - Ireland (%)
Place of birth for the foreign-born population - Denmark (%)
Place of birth for the foreign-born population - Norway (%)
Place of birth for the foreign-born population - Sweden (%)
Place of birth for the foreign-born population - United Kingdom (%)
Place of birth for the foreign-born population - England (%)
Place of birth for the foreign-born population - Scotland (%)
Place of birth for the foreign-born population - Other Northern Europe (%)
Place of birth for the foreign-born population - Austria (%)
Place of birth for the foreign-born population - Belgium (%)
Place of birth for the foreign-born population - France (%)
Place of birth for the foreign-born population - Germany (%)
Place of birth for the foreign-born population - Netherlands (%)
Place of birth for the foreign-born population - Switzerland (%)
Place of birth for the foreign-born population - Other Western Europe (%)
Place of birth for the foreign-born population - Greece (%)
Place of birth for the foreign-born population - Italy (%)
Place of birth for the foreign-born population - Portugal (%)
Place of birth for the foreign-born population - Spain (%)
Place of birth for the foreign-born population - Other Southern Europe (%)
Place of birth for the foreign-born population - Albania (%)
Place of birth for the foreign-born population - Belarus (%)
Place of birth for the foreign-born population - Bosnia and Herzegovina (%)
Place of birth for the foreign-born population - Bulgaria (%)
Place of birth for the foreign-born population - Croatia (%)
Place of birth for the foreign-born population - Czechoslovakia (%)
Place of birth for the foreign-born population - Hungary (%)
Place of birth for the foreign-born population - Latvia (%)
Place of birth for the foreign-born population - Lithuania (%)
Place of birth for the foreign-born population - North Macedonia (Macedonia) (%)
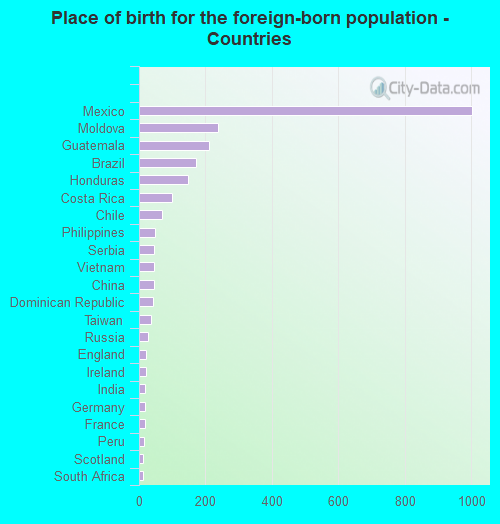
Place of birth for the foreign-born population - Moldova (%)
Place of birth for the foreign-born population - Poland (%)
Place of birth for the foreign-born population - Romania (%)
Place of birth for the foreign-born population - Russia (%)
Place of birth for the foreign-born population - Serbia (%)
Place of birth for the foreign-born population - Ukraine (%)
Place of birth for the foreign-born population - Other Eastern Europe (%)
Place of birth for the foreign-born population - China (%)
Place of birth for the foreign-born population - Hong Kong (%)
Place of birth for the foreign-born population - Taiwan (%)
Place of birth for the foreign-born population - Japan (%)
Place of birth for the foreign-born population - Korea (%)
Place of birth for the foreign-born population - Other Eastern Asia (%)
Place of birth for the foreign-born population - Afghanistan (%)
Place of birth for the foreign-born population - Bangladesh (%)
Place of birth for the foreign-born population - India (%)
Place of birth for the foreign-born population - Iran (%)
Place of birth for the foreign-born population - Kazakhstan (%)
Place of birth for the foreign-born population - Nepal (%)
Place of birth for the foreign-born population - Pakistan (%)
Place of birth for the foreign-born population - Sri Lanka (%)
Place of birth for the foreign-born population - Uzbekistan (%)
Place of birth for the foreign-born population - Other South Central Asia (%)
Place of birth for the foreign-born population - Burma (%)
Place of birth for the foreign-born population - Cambodia (%)
Place of birth for the foreign-born population - Indonesia (%)
Place of birth for the foreign-born population - Laos (%)
Place of birth for the foreign-born population - Malaysia (%)
Place of birth for the foreign-born population - Philippines (%)
Place of birth for the foreign-born population - Singapore (%)
Place of birth for the foreign-born population - Thailand (%)
Place of birth for the foreign-born population - Vietnam (%)
Place of birth for the foreign-born population - Other South Eastern Asia (%)
Place of birth for the foreign-born population - Armenia (%)
Place of birth for the foreign-born population - Iraq (%)
Place of birth for the foreign-born population - Israel (%)
Place of birth for the foreign-born population - Jordan (%)
Place of birth for the foreign-born population - Kuwait (%)
Place of birth for the foreign-born population - Lebanon (%)
Place of birth for the foreign-born population - Saudi Arabia (%)
Place of birth for the foreign-born population - Syria (%)
Place of birth for the foreign-born population - Turkey (%)
Place of birth for the foreign-born population - Yemen (%)
Place of birth for the foreign-born population - Other Western Asia (%)
Place of birth for the foreign-born population - Eritrea (%)
Place of birth for the foreign-born population - Ethiopia (%)
Place of birth for the foreign-born population - Kenya (%)
Place of birth for the foreign-born population - Somalia (%)
Place of birth for the foreign-born population - Uganda (%)
Place of birth for the foreign-born population - Zimbabwe (%)
Place of birth for the foreign-born population - Other Eastern Africa (%)
Place of birth for the foreign-born population - Cameroon (%)
Place of birth for the foreign-born population - Congo (%)
Place of birth for the foreign-born population - Democratic Republic of Congo (Zaire) (%)
Place of birth for the foreign-born population - Other Middle Africa (%)
Place of birth for the foreign-born population - Egypt (%)
Place of birth for the foreign-born population - Morocco (%)
Place of birth for the foreign-born population - Sudan (%)
Place of birth for the foreign-born population - Other Northern Africa (%)
Place of birth for the foreign-born population - South Africa (%)
Place of birth for the foreign-born population - Other Southern Africa (%)
Place of birth for the foreign-born population - Cabo Verde (%)
Place of birth for the foreign-born population - Ghana (%)
Place of birth for the foreign-born population - Liberia (%)
Place of birth for the foreign-born population - Nigeria (%)
Place of birth for the foreign-born population - Senegal (%)
Place of birth for the foreign-born population - Sierra Leone (%)
Place of birth for the foreign-born population - Other Western Africa (%)
Place of birth for the foreign-born population - Australia (%)
Place of birth for the foreign-born population - New Zealand (%)
Place of birth for the foreign-born population - Fiji (%)
Place of birth for the foreign-born population - Micronesia (%)
Place of birth for the foreign-born population - Bahamas (%)
Place of birth for the foreign-born population - Barbados (%)
Place of birth for the foreign-born population - Cuba (%)
Place of birth for the foreign-born population - Dominica (%)
Place of birth for the foreign-born population - Dominican Republic (%)
Place of birth for the foreign-born population - Grenada (%)
Place of birth for the foreign-born population - Haiti (%)
Place of birth for the foreign-born population - Jamaica (%)
Place of birth for the foreign-born population - St. Vincent and the Grenadines (%)
Place of birth for the foreign-born population - Trinidad and Tobago (%)
Place of birth for the foreign-born population - West Indies (%)
Place of birth for the foreign-born population - Other Caribbean (%)
Place of birth for the foreign-born population - Belize (%)
Place of birth for the foreign-born population - Costa Rica (%)
Place of birth for the foreign-born population - El Salvador (%)
Place of birth for the foreign-born population - Guatemala (%)
Place of birth for the foreign-born population - Honduras (%)
Place of birth for the foreign-born population - Mexico (%)
Place of birth for the foreign-born population - Nicaragua (%)
Place of birth for the foreign-born population - Panama (%)
Place of birth for the foreign-born population - Other Central America (%)
Place of birth for the foreign-born population - Argentina (%)
Place of birth for the foreign-born population - Bolivia (%)
Place of birth for the foreign-born population - Brazil (%)
Place of birth for the foreign-born population - Chile (%)
Place of birth for the foreign-born population - Colombia (%)
Place of birth for the foreign-born population - Ecuador (%)
Place of birth for the foreign-born population - Guyana (%)
Place of birth for the foreign-born population - Peru (%)
Place of birth for the foreign-born population - Uruguay (%)
Place of birth for the foreign-born population - Venezuela (%)
Place of birth for the foreign-born population - Other South America (%)
Place of birth for the foreign-born population - Canada (%)
Place of birth for the foreign-born population - Other Northern America (%)
Place of birth for the foreign-born population - Other (%)
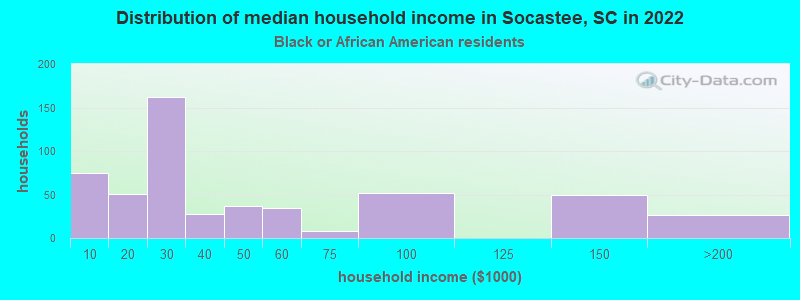
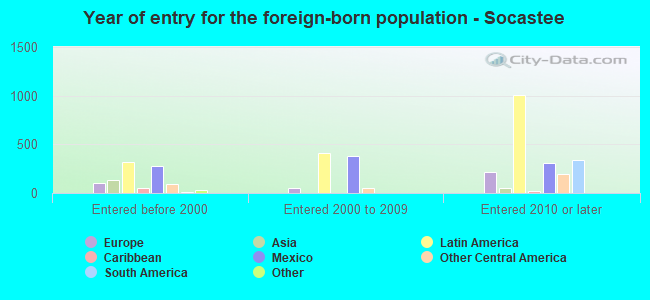
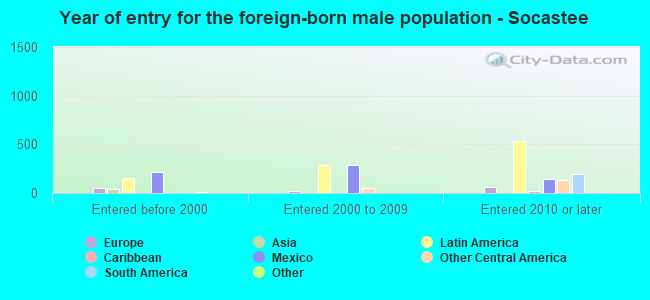
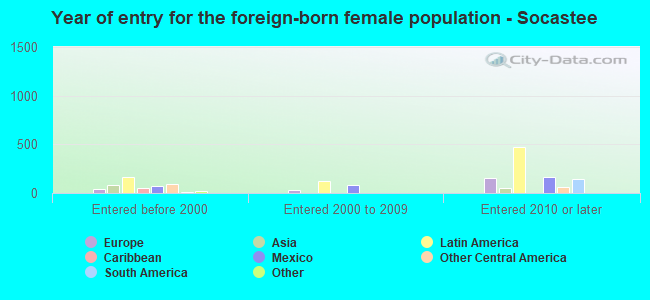
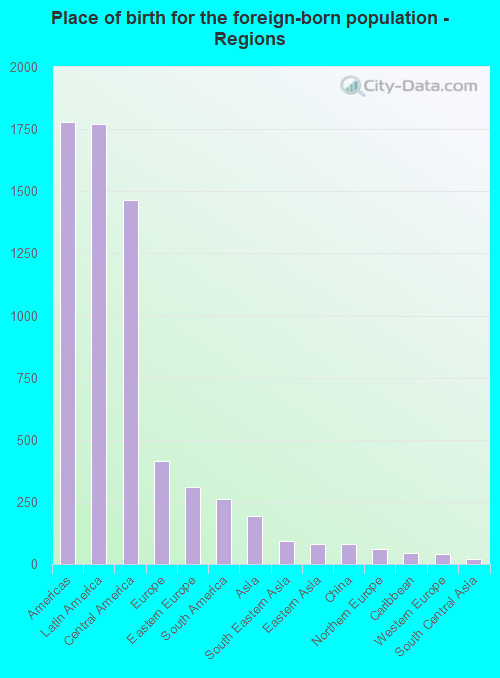
According to 2022 data, the most numerous races in Socastee, SC are White alone (18,605 residents), Black alone (1,278 residents), and Hispanic (4,031 residents). 87.5% of Socastee residents speak English at home. 9.1% of Socastee, SC residents are foreign-born (7.2% born in Latin America, 1.7% born in Europe), which is 45.3% greater than the foreign-born rate of 5.0% across the entire state of South Carolina.
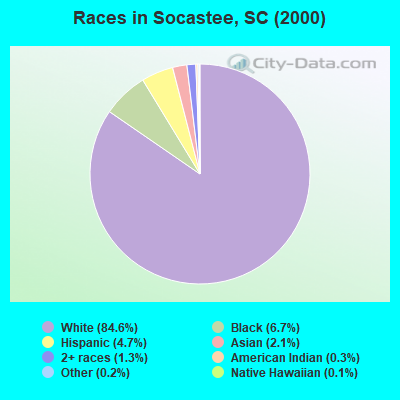
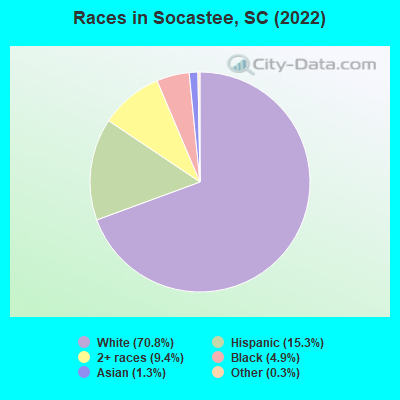
Race distribution in Socastee
2000 2022
2,652,291 66.1% White alone 1,178,486 29.4% Black alone 95,076 2.4% Hispanic 35,568 0.9% Asian alone 33,290 0.8% Two or more races 12,765 0.3% American Indian alone 3,266 0.08% Other race alone 1,270 0.03% Native Hawaiian and Other
3,301,739 62.5% White alone 1,313,290 24.9% Black alone 343,783 6.5% Hispanic 190,508 3.6% Two or more races 89,888 1.7% Asian alone 29,390 0.6% Other race alone 12,112 0.2% American Indian alone 1,924 0.04% Native Hawaiian and Other
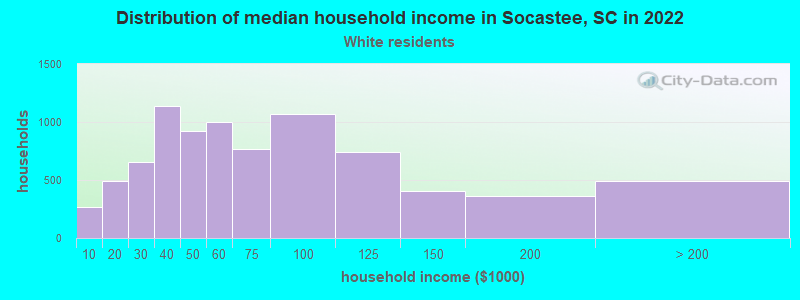
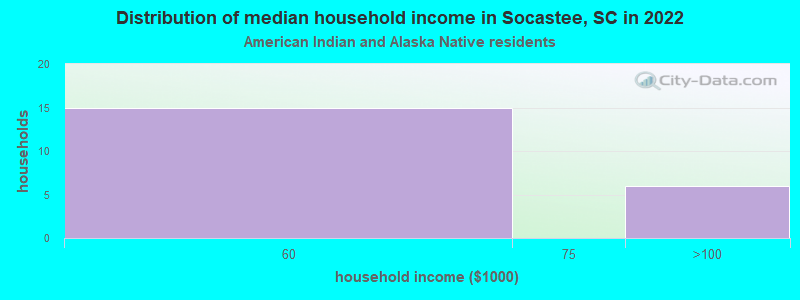
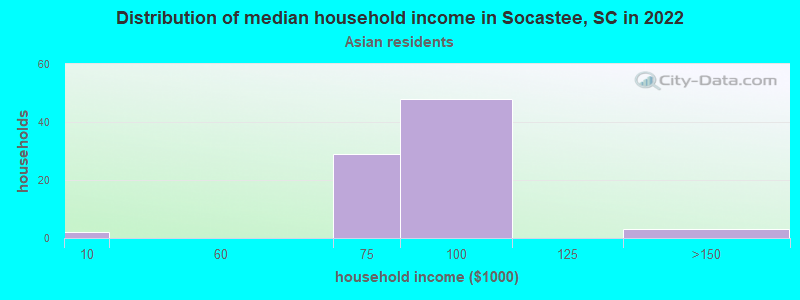
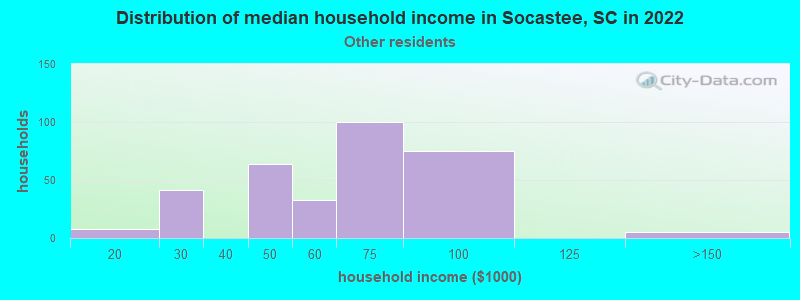
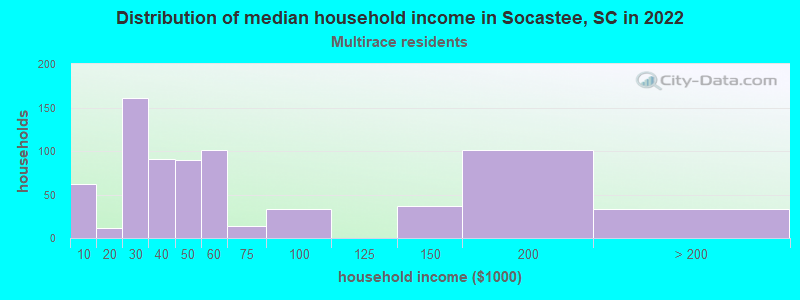
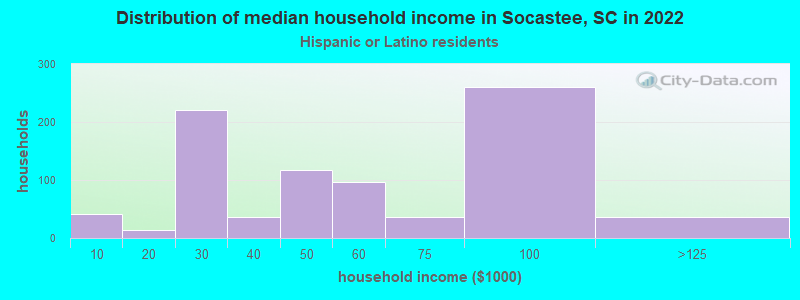
Income and house value in Socastee Median household income in 2022 $55,687 White non-Hispanic householders$29,983 Black householders$117,410 Asian householders$70,713 Some other race householders$53,931 Two or more races householders$49,670 Hispanic or Latino race householdersMedian 2022 house value $297,993 White Non-Hispanic householders$245,946 Black or African American householders$410,179 American Indian or Alaska Native householders $289,903 Asian householders$370,806 Some other race householders$363,255 Two or more races householders$343,299 Hispanic or Latino householders
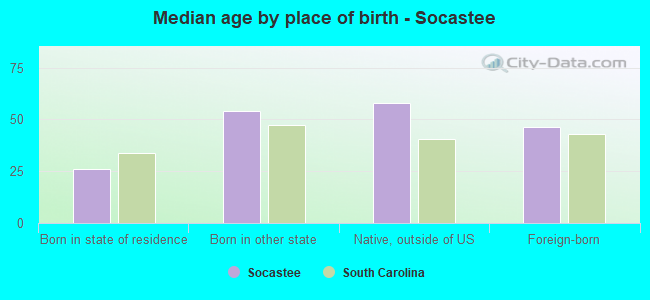
Median age by race in Socastee
51.2 Median age for White residents47.3 52.9 41.9 Median age for Black or African American residents40.8 41.3 57.4 Median age for American Indian / Alaska Native residents-583,333,332.8 -1,524,366,470.2 49.4 Median age for Asian residents54.4 37.7 -698,412,697.7 Median age for Native Hawaiian / Pacific Islander residents-666,666,666.0 -666,666,666.0 20.2 Median age for Other race residents20.6 9.2 22.7 Median age for Two or more races residents28.8 20.7 50.9 Median age for White alone residents48.0 52.1 29.3 Median age for Hispanic or Latino residents30.9 21.1
Owner/renter occupied households by race in Socastee
House owners and renters - White residents 6,008 71.9% Owner occupied2,352 28.1% Renter occupiedHouse owners and renters - Black or African American residents 219 46.3% Owner occupied254 53.7% Renter occupiedHouse owners and renters - American Indian / Alaska Native residents 17 100.0% Owner occupiedHouse owners and renters - Asian residents 111 100.0% Owner occupiedHouse owners and renters - Other race residents 145 40.7% Owner occupied212 59.3% Renter occupiedHouse owners and renters - Two or more races residents 261 36.3% Owner occupied459 63.7% Renter occupiedHouse owners and renters - White alone residents 5,899 71.8% Owner occupied2,316 28.2% Renter occupiedHouse owners and renters - Hispanic or Latino residents 293 38.0% Owner occupied479 62.0% Renter occupied
Language usage in Socastee
English speakers - Total 87.5% of residents of Socastee speak English at home.
9.5% of residents speak Spanish at home 994 42.3% Speak English very well1,356 57.7% Speak English less than very well2.7% of residents speak other language at home 363 54.8% Speak English very well299 45.2% Speak English less than very well
English speakers - Born in the United States 97.3% of residents of Socastee speak English at home.
2.1% of residents speak Spanish at home 258 86.6% Speak English very well40 13.4% Speak English less than very well0.6% of residents speak other language at home 83 100.0% Speak English very well
English speakers - Native, born elsewhere 91.6% of residents of Socastee speak English at home.
22.0% of residents speak Spanish at home 47 100.0% Speak English less than very well
English speakers - Foreign-born 12.1% of residents of Socastee speak English at home.
62.3% of residents speak Spanish at home 490 29.7% Speak English very well1,161 70.3% Speak English less than very well16.5% of residents speak other language at home 186 42.5% Speak English very well252 57.5% Speak English less than very well
White (Caucasian) - Speak only English Native:
98.5% (17,452)Foreign-born:
29.4% (259)
White (Caucasian) - Speak another language Native:
1.6% (285)Foreign-born:
58.8% (518)
Black or African American - Speak another language Native:
5.9% (75)Foreign-born:
100.0% (42)
Asian - Speak only English Native:
61.7% (87)Foreign-born:
5.7% (14)
Asian - Speak another language Native:
34.7% (49)Foreign-born:
71.9% (170)
Other race - Speak only English Native:
76.5% (731)Foreign-born:
7.2% (37)
Other race - Speak another language Native:
27.2% (260)Foreign-born:
92.5% (471)
Two or more races - Speak only English Native:
91.9% (2,450)Foreign-born:
2.8% (27)
Two or more races - Speak another language Native:
8.4% (224)Foreign-born:
97.6% (936)
White alone - Speak only English Native:
99.4% (17,225)Foreign-born:
36.9% (210)
White alone - Speak another language Native:
0.7% (125)Foreign-born:
59.4% (338)
Hispanic or Latino - Speak only English Native:
67.3% (1,290)Foreign-born:
6.3% (84)
Hispanic or Latino - Speak another language Native:
34.4% (659)Foreign-born:
93.7% (1,251)
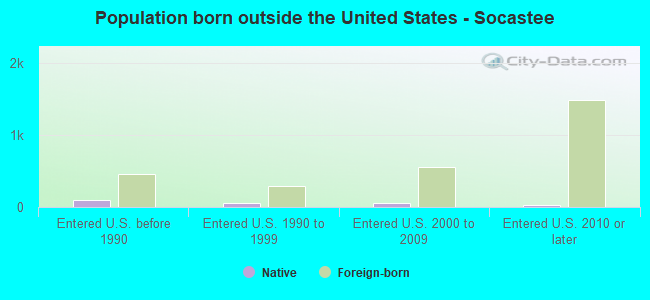
Foreign-born residents in Socastee 2,401 residents are foreign born (7.2% Latin America , 1.7% Europe ).
This city:
9.1%South Carolina:
5.3%
Marital status for residents in Socastee Marital status - White (Caucasian) population 15 years and over
Males 34.7% Never married47.7% Now married2.3% Separated2.4% Widowed13.0% DivorcedFemales 21.6% Never married46.8% Now married2.7% Separated13.9% Widowed15.0% DivorcedWomen who gave birth in the past 12 months Now married:
78.3% (53)Unmarried:
21.7% (15)
Women who did not give birth in the past 12 months Now married:
40.1% (1,442)Unmarried:
59.9% (2,152)
Marital status - Black or African American population 15 years and over
Males 45.4% Never married44.1% Now married1.6% Separated5.0% Widowed3.9% DivorcedFemales 24.7% Never married56.1% Now married0.0% Separated19.2% Widowed0.0% DivorcedWomen who did not give birth in the past 12 months Now married:
66.8% (183)Unmarried:
33.2% (91)
Marital status - American Indian / Alaska Native population 15 years and over
Males 0.0% Never married100.0% Now married0.0% Separated0.0% Widowed0.0% DivorcedFemales 0.0% Never married0.0% Now married0.0% Separated0.0% Widowed100.0% DivorcedMarital status - Asian population 15 years and over
Males 59.2% Never married31.6% Now married0.0% Separated0.0% Widowed9.2% DivorcedFemales 29.3% Never married60.5% Now married0.0% Separated10.2% Widowed0.0% DivorcedWomen who did not give birth in the past 12 months Now married:
42.7% (35)Unmarried:
57.3% (48)
Marital status - Other race population 15 years and over
Males 59.5% Never married26.9% Now married0.0% Separated0.0% Widowed13.6% DivorcedFemales 20.3% Never married52.5% Now married23.0% Separated4.1% Widowed0.0% DivorcedWomen who gave birth in the past 12 months Now married:
0.0% (0)Unmarried:
100.0% (24)
Women who did not give birth in the past 12 months Now married:
89.6% (222)Unmarried:
10.4% (26)
Marital status - Two or more races population 15 years and over
Males 41.0% Never married38.0% Now married0.0% Separated0.0% Widowed21.0% DivorcedFemales 36.7% Never married16.2% Now married29.2% Separated11.7% Widowed6.2% DivorcedWomen who did not give birth in the past 12 months Now married:
48.5% (488)Unmarried:
51.5% (518)
Marital status - White alone, not Hispanic / Latino population 15 years and over
Males 35.2% Never married46.5% Now married2.2% Separated2.5% Widowed13.6% DivorcedFemales 22.2% Never married46.6% Now married2.9% Separated12.7% Widowed15.6% DivorcedWomen who gave birth in the past 12 months Now married:
67.4% (32)Unmarried:
32.6% (15)
Women who did not give birth in the past 12 months Now married:
39.4% (1,418)Unmarried:
60.6% (2,179)
Marital status - Hispanic or Latino population 15 years and over
Males 49.9% Never married39.9% Now married1.0% Separated0.0% Widowed9.3% DivorcedFemales 20.3% Never married49.3% Now married7.9% Separated20.3% Widowed2.3% DivorcedWomen who gave birth in the past 12 months Now married:
56.1% (26)Unmarried:
43.9% (20)
Women who did not give birth in the past 12 months Now married:
66.2% (361)Unmarried:
33.8% (184)
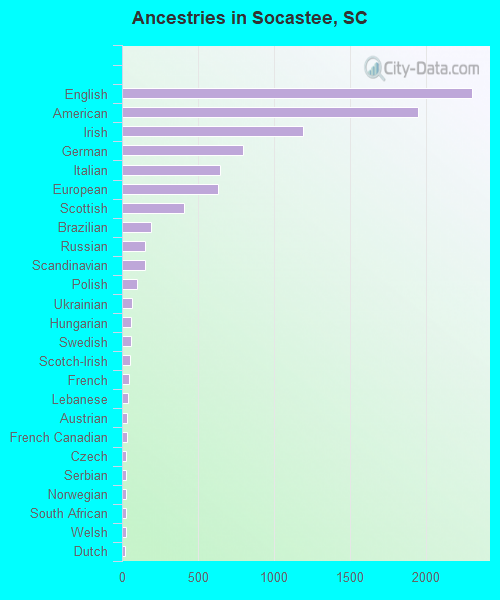
Ancestries in Socastee
2,300 15.7% English1,949 13.3% American1,194 8.2% Irish797 5.5% German647 4.4% Italian629 4.3% European406 2.8% Scottish191 1.3% Brazilian150 1.0% Russian149 1.0% Scandinavian101 0.7% Polish63 0.4% Ukrainian58 0.4% Hungarian58 0.4% Swedish51 0.3% Scotch-Irish45 0.3% French37 0.3% Lebanese33 0.2% Austrian32 0.2% French Canadian29 0.2% Czech29 0.2% Serbian28 0.2% Norwegian27 0.2% South African26 0.2% Welsh23 0.2% Dutch21 0.1% African20 0.1% British18 0.1% Finnish16 0.1% Eastern European10 0.07% Canadian8 0.05% Lithuanian8 0.05% Danish5 0.03% Albanian
Geographical mobility in Socastee Same house 1 year ago 16,513 85.5% White (Caucasian)1,127 82.2% Black or African American29 100.0% American Indian / Alaska Native386 97.0% Asian1,250 75.7% Other race3,287 82.5% Two or more races15,817 85.3% White alone, not Hispanic / Latino3,489 89.0% Hispanic or LatinoMoved within same county 1,567 8.1% White / Caucasian22 1.6% Black or African American401 24.3% Other race514 12.9% Two or more races1,522 8.2% White alone, not Hispanic / Latino244 6.2% Hispanic or LatinoMoved within same state 220 1.1% White / Caucasian102 7.5% Black or African American14 3.6% Asian14 0.8% Other race43 1.1% Two or more races224 1.2% White alone, not Hispanic / Latino27 0.7% Hispanic or LatinoMoved from different state 821 4.3% White / Caucasian85 6.2% Black or African American23 0.6% Two or more races820 4.4% White alone, not Hispanic / LatinoMoved from abroad 29 0.2% White57 1.4% Two or more races30 0.2% White alone, not Hispanic / Latino25 0.6% Hispanic or Latino
Children Nativity (place of birth) in Socastee
Children under 6 years - Living with two parents Both parents native 987 100.0% NativeBoth parents foreign-born 50 100.0% NativeOne native, one foreign-born parent 5 100.0% NativeChildren under 6 years - Living with one parent Native parent 514 100.0% NativeForeign-born parent 125 74.8% Native42 25.2% Foreign-bornChildren 6 to 17 years - Living with two parents Both parents native 1,886 100.0% NativeBoth parents foreign-born 118 100.0% NativeOne native, one foreign-born parent 22 100.0% NativeChildren 6 to 17 years - Living with one parent Native parent 636 100.0% NativeForeign-born parent 192 64.0% Native108 36.0% Foreign-born
Grandparents responsible for own grandchildren in Socastee
Grandparents (30 to 59 years) White / Caucasian 11 5.8% Responsible for grandchildren175 94.2% Not responsible for grandchildrenOther race 2 100.0% Responsible for grandchildrenWhite alone, not Hispanic / Latino 11 6.5% Responsible for grandchildren159 93.5% Not responsible for grandchildrenHispanic or Latino 1 5.8% Responsible for grandchildren23 94.2% Not responsible for grandchildrenGrandparents (60 years and over) White / Caucasian 50 33.9% Responsible for grandchildren98 66.1% Not responsible for grandchildrenWhite alone, not Hispanic / Latino 51 50.2% Responsible for grandchildren51 49.8% Not responsible for grandchildrenHispanic or Latino 56 100.0% Not responsible for grandchildren