Sheridan, WY (Wyoming) Houses and Residents
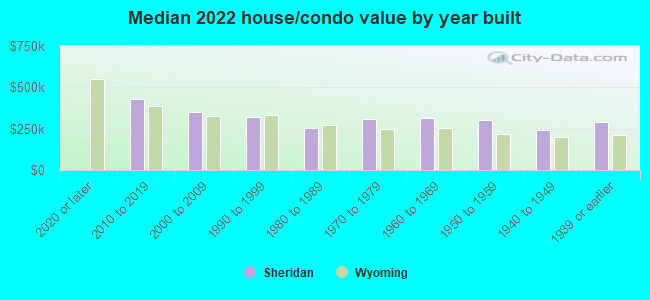
| Sheridan: | $311,252 |
| Wyoming: | $292,300 |
Total population: 17,916 (Urban population: 15,810 (all inside urban clusters), Rural population: 57 (all nonfarm))
Houses: 9,041 (8,369 occupied: 5,183 owner occupied, 3,393 renter occupied)
| % of renters here: | 40% |
| State: | 27% |
Housing density: 1,065 houses/condos per square mile
Median price asked for vacant for-sale houses and condos in 2022 in this county: $534,842.
Median contract rent in 2022: $760 (lower quartile is $570, upper quartile is $1,051)
Median rent asked for vacant for-rent units in 2022: $844
Median gross rent in Sheridan, WY in 2022: $871
Housing units in Sheridan with a mortgage: 3,009 (228 second mortgage, 24 home equity loan, 129 both second mortgage and home equity loan)
Houses without a mortgage: 57
Median household income for houses/condos with a mortgage: $91,597
Median household income for apartments without a mortgage: $54,030
Median monthly housing costs: $943
Compare current foreclosures near Sheridan, WY:
| Photo | Address | Area | Beds / Baths | Price | Details |
|---|---|---|---|---|---|

|
#1
W Works St
Sheridan, WY 82801
|
1,208 sq. feet
|
2 baths 4 beds |
show details | |

|
#2
S Sheridan Ave
Sheridan, WY 82801
|
898 sq. feet
|
1 baths 2 beds |
show details | |

|
#3
Taylor Ave
Sheridan, WY 82801
|
2,400 sq. feet
|
2 baths - beds |
show details | |

|
#4
N Gould St
Sheridan, WY 82801
|
- sq. feet
|
- baths - beds |
show details | |

|
#5
Coffeen Ave # 1200
Sheridan, WY 82801
|
7,720 sq. feet
|
- baths - beds |
show details | |

|
#6
Mydland Rd Unit 6c
Sheridan, WY 82801
|
- sq. feet
|
- baths - beds |
show details | |

|
#7
Marion Ct Apt 1
Sheridan, WY 82801
|
- sq. feet
|
- baths - beds |
show details | |

|
#8
Yonkee Ave
Sheridan, WY 82801
|
- sq. feet
|
- baths - beds |
show details | |

|
#9
N Gould St # 21075
Sheridan, WY 82801
|
- sq. feet
|
- baths - beds |
show details | |

|
#10
Dow Prong Rd
Wyarno, WY 82845
|
- sq. feet
|
- baths - beds |
show details |
| Photo | Address | Area | Beds / Baths | Price | Details |
|---|---|---|---|---|---|

|
#11
Us Highway 87
Banner, WY 82832
|
- sq. feet
|
- baths - beds |
show details | |

|
#12
W Fourth Ave, # 8
Dayton, WY 82836
|
- sq. feet
|
- baths - beds |
show details | |

|
Check over 1 million property listings on Foreclosure.com!
|
browse all offers | |||

Latest news about housing in Sheridan, WY collected exclusively by city-data.com from local newspapers, TV, and radio stations

 | Apartment Living In Wyoming (50 replies) |
| Considering Casper and Sheridan for our family (51 replies) |
| Mobile homes for sale or rent in Sheridan? (8 replies) |
| Thinking of moving to Sheridan (62 replies) |
| Housing Market - Sheridan, WY 2016 (15 replies) |
| Coming home from high traffic drugs n crime - Gillete, Green River, Sheridan? (7 replies) |

Median year apartment built: 1982
Household type by relationship:
Households: 18,919- Male householders: 4,065 (1,721 living alone), Female householders: 4,238 (1,920 living alone)
3,500 spouses (3,474 opposite-sex spouses), 413 unmarried partners, (413 opposite-sex unmarried partners), 4,933 children (4,388 natural, 334 adopted, 210 stepchildren), 118 grandchildren, 255 brothers or sisters, 88 parents, 0 foster children, 96 other relatives, 482 non-relatives
- In group quarters: 726
Size of family households: 2,249 2-persons, 853 3-persons, 936 4-persons, 263 5-persons, 92 6-persons, 22 7-or-more-persons.
Size of nonfamily households: 3,775 1-person, 346 2-persons, 26 3-persons, 20 5-persons.
3,228 married couples with children.
834 single-parent households (103 men, 731 women).
96.7% of residents of Sheridan speak English at home.
2.5% of residents speak Spanish at home (64% speak English very well, 13% speak English well, 17% speak English not well, 6% don't speak English at all).
0.4% of residents speak other Indo-European language at home (66% speak English very well, 34% speak English well).
0.2% of residents speak Asian or Pacific Island language at home (100% speak English very well).
0.2% of residents speak other language at home (100% speak English very well).
Foreign born population: 414 (2.2%)
(65.5% of them are naturalized citizens)
| Here: | 6.3 |
| State: | 6.7 |
| Here: | 4.1 |
| State: | 4.4 |
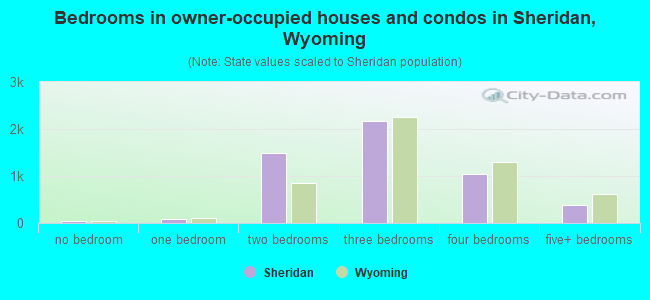
- Bedrooms in owner-occupied houses and condos in Sheridan, Wyoming
- 44no bedroom
- 811 bedroom
- 1,4802 bedrooms
- 2,1603 bedrooms
- 1,0354 bedrooms
- 3835+ bedrooms
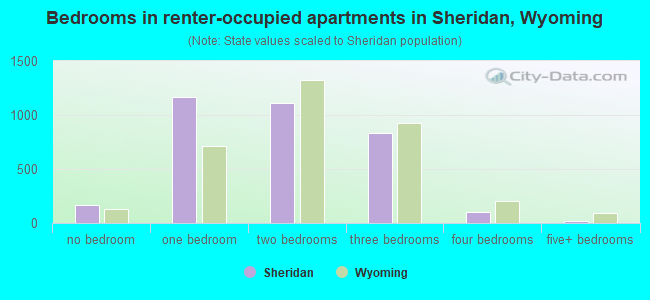
- Bedrooms in renter-occupied apartments in Sheridan, Wyoming
- 164no bedroom
- 1,1681 bedroom
- 1,1112 bedrooms
- 8353 bedrooms
- 984 bedrooms
- 185+ bedrooms
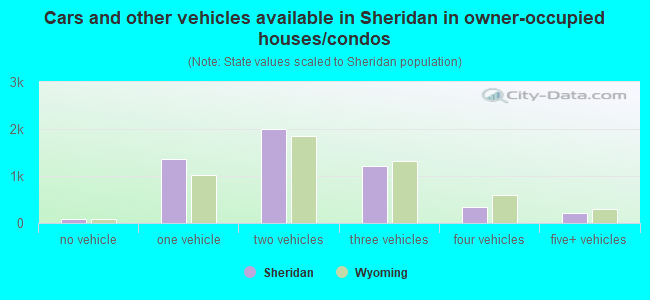
- Cars and other vehicles available in Sheridan in owner-occupied houses/condos
- 84no vehicle
- 1,3521 vehicle
- 1,9912 vehicles
- 1,2213 vehicles
- 3314 vehicles
- 2045+ vehicles
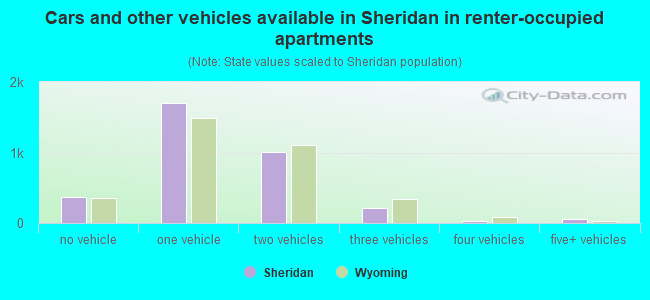
- Cars and other vehicles available in Sheridan in renter-occupied apartments
- 374no vehicle
- 1,7031 vehicle
- 1,0142 vehicles
- 2183 vehicles
- 314 vehicles
- 535+ vehicles
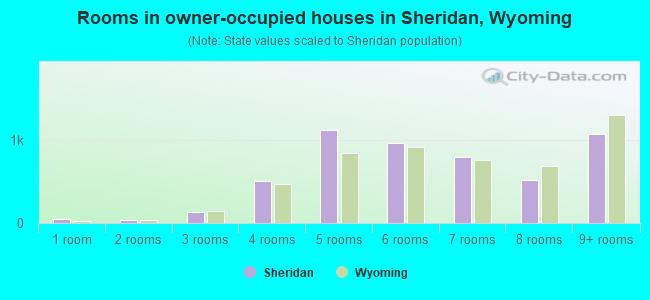
- Rooms in owner-occupied houses in Sheridan, Wyoming
- 441 room
- 332 rooms
- 1313 rooms
- 5034 rooms
- 1,1235 rooms
- 9606 rooms
- 7907 rooms
- 5238 rooms
- 1,0779+ rooms
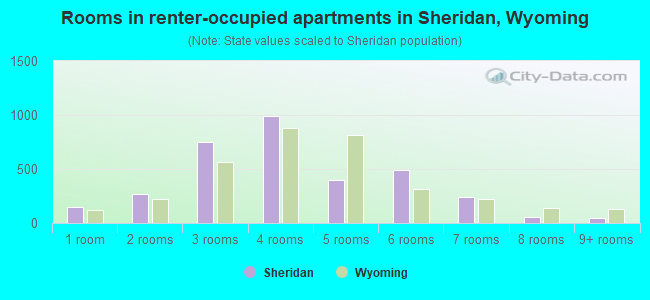
- Rooms in renter-occupied apartments in Sheridan, Wyoming
- 1511 room
- 2712 rooms
- 7493 rooms
- 9934 rooms
- 3985 rooms
- 4936 rooms
- 2417 rooms
- 538 rooms
- 459+ rooms
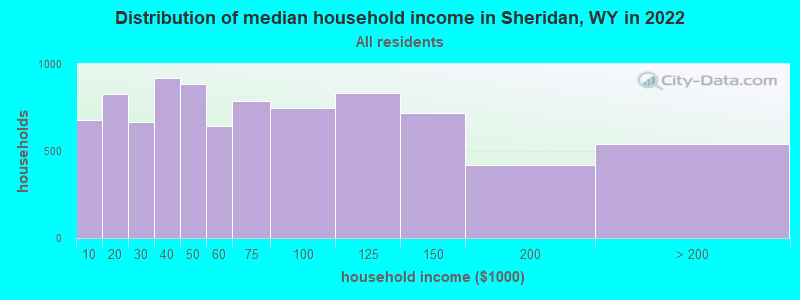
Sheridan, WY household income distribution

- 676Less than $10,000
- 830$10,000 to $19,999
- 668$20,000 to $29,999
- 918$30,000 to $39,999
- 884$40,000 to $49,999
- 646$50,000 to $59,999
- 786$60,000 to $74,999
- 750$75,000 to $99,999
- 835$100,000 to $124,999
- 716$125,000 to $149,999
- 419$150,000 to $199,999
- 543$200,000 or more
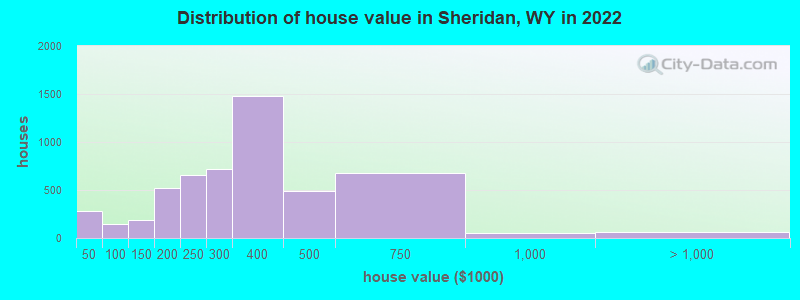
Home value of owner - occupied houses in 2022 in Sheridan, WY
-
- 51Less than $10,000
- 29$20,000 to $24,999
- 35$25,000 to $29,999
- 113$30,000 to $34,999
- 41$35,000 to $39,999
- 10$40,000 to $49,999
- 13$60,000 to $69,999
- 10$70,000 to $79,999
- 105$80,000 to $89,999
- 157$100,000 to $124,999
- 32$125,000 to $149,999
- 289$150,000 to $174,999
- 234$175,000 to $199,999
- 654$200,000 to $249,999
- 713$250,000 to $299,999
- 1,474$300,000 to $399,999
- 490$400,000 to $499,999
- 678$500,000 to $749,999
- 57$750,000 to $999,999
- 62$1,000,000 to $1,499,999
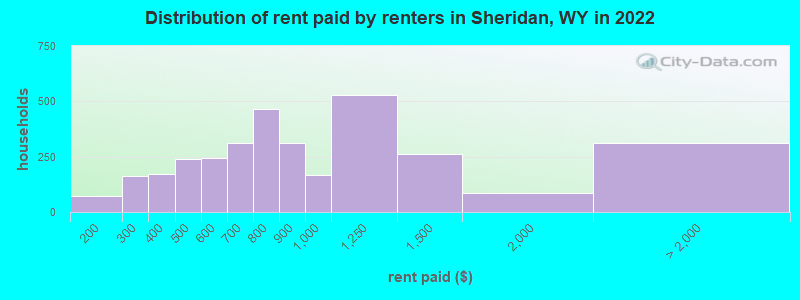
Rent paid by renters in 2022 in Sheridan, WY
-
- 6$100 to $149
- 67$150 to $199
- 57$200 to $249
- 103$250 to $299
- 106$300 to $349
- 63$350 to $399
- 172$400 to $449
- 66$450 to $499
- 80$500 to $549
- 165$550 to $599
- 81$600 to $649
- 232$650 to $699
- 215$700 to $749
- 251$750 to $799
- 314$800 to $899
- 165$900 to $999
- 526$1,000 to $1,249
- 262$1,250 to $1,499
- 86$1,500 to $1,999
- 12$2,000 to $2,499
- 9$3,500 or more
- 291No cash rent
Percentage of workers working in this county: 94.2%
Number of people working at home: 456 (5.0% of all workers)
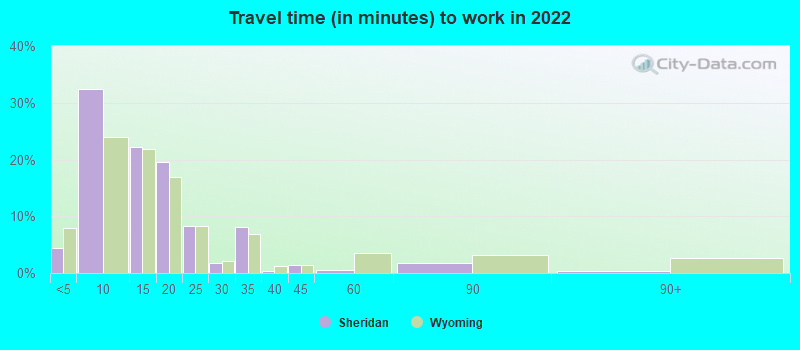
Travel time to work (commute)
- Less than 5 minutes: 488
- 5 to 9 minutes: 3,471
- 10 to 14 minutes: 2,302
- 15 to 19 minutes: 1,288
- 20 to 24 minutes: 346
- 25 to 29 minutes: 9
- 30 to 34 minutes: 294
- 35 to 39 minutes: 113
- 40 to 44 minutes: 84
- 45 to 59 minutes: 108
- 60 to 89 minutes: 113
- 90 or more minutes: 35
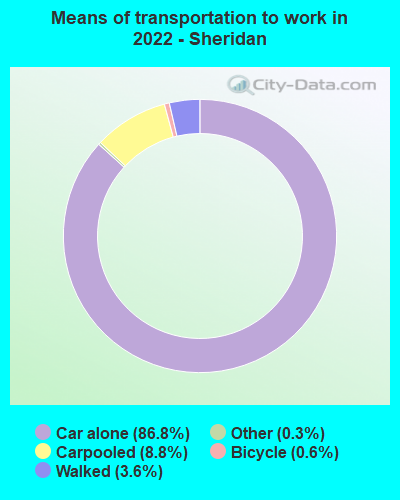
Means of transportation to work:
- Drove a car alone: 9,100 (83.4%)
- Carpooled: 786 (7.2%)
- Taxi: 39 (0.4%)
- Bicycle: 67 (0.6%)
- Walked: 374 (3.4%)
- Worked at home: 456 (4.2%)
- Unemployment by race in 2022
- Unemployment rate for White non-Hispanic residents
- 5.1%Males
- 2.1%Females
- Unemployment rate for Hispanic or Latino residents
- 8.2%Females
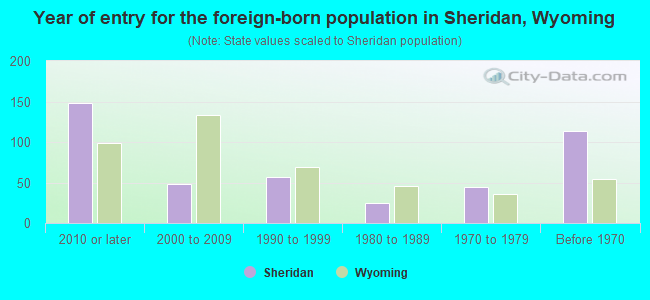
- Year of entry for the foreign-born population in Sheridan, Wyoming
- 1482010 or later
- 482000 to 2009
- 571990 to 1999
- 251980 to 1989
- 451970 to 1979
- 113Before 1970
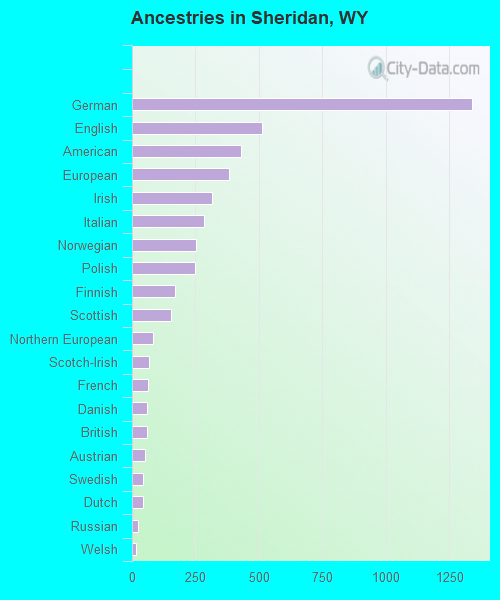
First ancestries reported:
- German: 1,340 (20.8%)
- English: 511 (7.9%)
- American: 430 (6.7%)
- European: 383 (5.9%)
- Irish: 316 (4.9%)
- Italian: 282 (4.4%)
- Norwegian: 252 (3.9%)
- Polish: 250 (3.9%)
- Finnish: 170 (2.6%)
- Scottish: 154 (2.4%)
- Northern European: 82 (1.3%)
- Scotch-Irish: 67 (1.0%)
- French: 63 (1.0%)
- Danish: 61 (0.9%)
- British: 59 (0.9%)
- Austrian: 53 (0.8%)
- Swedish: 45 (0.7%)
- Dutch: 44 (0.7%)
- Russian: 25 (0.4%)
- Welsh: 14 (0.2%)
- Scandinavian: 12 (0.2%)
- Swiss: 12 (0.2%)
- Yugoslavian: 12 (0.2%)
- African: 11 (0.2%)
- Slovene: 9 (0.1%)
- Ghanaian: 9 (0.1%)
- Serbian: 7 (0.1%)
- French Canadian: 6 (0.09%)
- Armenian: 5 (0.08%)
- West Indian: 1 (0.02%)
Most common places of birth for foreign-born residents (%):
| Sheridan: | 25.5% (119) |
| Wyoming: | 42.9% (8,470) |
| Sheridan: | 19.1% (89) |
| Wyoming: | 5.8% (1,139) |
| Sheridan: | 9.2% (43) |
| Wyoming: | 2.6% (514) |
| Sheridan: | 8.6% (40) |
| Wyoming: | 0.7% (131) |
| Sheridan: | 7.5% (35) |
| Wyoming: | 1.9% (378) |
| Sheridan: | 7.1% (33) |
| Wyoming: | 1.3% (263) |
| Sheridan: | 4.3% (20) |
| Wyoming: | 0.7% (132) |
| Sheridan: | 3.4% (16) |
| Wyoming: | 3.6% (712) |
| Sheridan: | 3.4% (16) |
| Wyoming: | 0.6% (114) |
| Sheridan: | 3.0% (14) |
| Wyoming: | 0.8% (156) |
| Sheridan: | 2.1% (10) |
| Wyoming: | 0.3% (66) |
| Sheridan: | 1.9% (9) |
| Wyoming: | 1.5% (290) |
Place of birth for U.S.-born residents:
- This state: 9,113
- Other state: 9,077
- Northeast: 779
- Midwest: 2,738
- South: 1,509
- West: 4,055
84.0% of Sheridan residents lived in the same house 1 years ago.
Out of people who lived in different houses, 31.5% lived in this county.
Out of people who lived in different counties, 54.3% lived in Wyoming.
| Sheridan: | 84.0% |
| State average: | 84.7% |
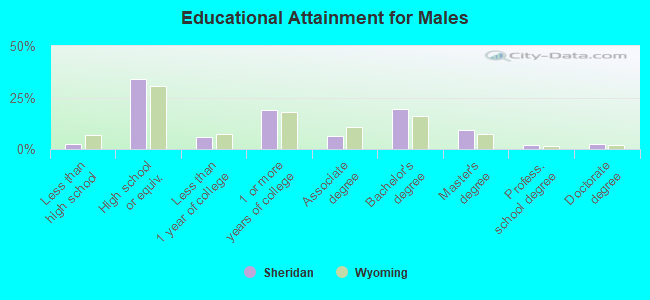
Education attainment for males 25 years and older:
- No schooling: 11
- Nursery to 4th grade: 0
- 5th and 6th grade: 0
- 7th and 8th grade: 18
- 9th grade: 0
- 10th grade: 46
- 11th grade: 61
- 12th grade, no diploma: 26
- High school graduate (or equivalency): 2,170
- Less than 1 year of college: 361
- Some college more than 1 year, no degree: 1,232
- Associate degree: 397
- Bachelor's degree: 1,235
- Master's degree: 581
- Professional school degree: 135
- Doctorate degree: 156
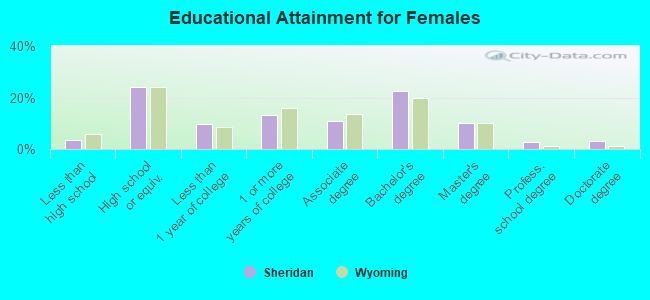
Education attainment for females 25 years and older:
- No schooling: 33
- Nursery to 4th grade: 0
- 5th and 6th grade: 0
- 7th and 8th grade: 20
- 9th grade: 64
- 10th grade: 8
- 11th grade: 61
- 12th grade, no diploma: 49
- High school graduate (or equivalency): 1,550
- Less than 1 year of college: 629
- Some college more than 1 year, no degree: 846
- Associate degree: 701
- Bachelor's degree: 1,434
- Master's degree: 637
- Professional school degree: 176
- Doctorate degree: 212
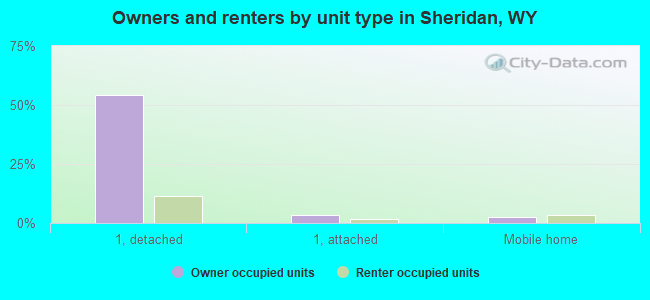
Housing units in structures:
- One, detached: 5,887
- One, attached: 535
- Two: 303
- 3 or 4: 510
- 5 to 9: 329
- 10 to 19: 280
- 20 to 49: 441
- 50 or more: 177
- Mobile homes: 529
- Boats, RVs, vans, etc.: 47
Median worth of mobile homes: $34,444
Housing units lacking complete kitchen facilities in 2022: 2.3%
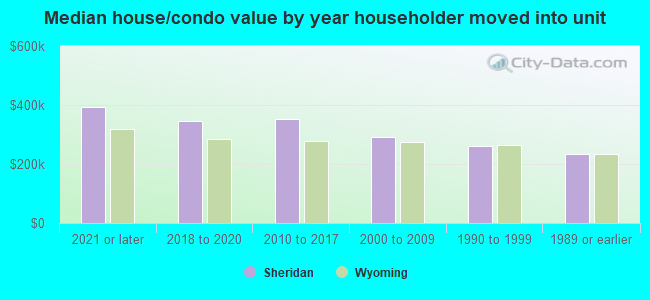
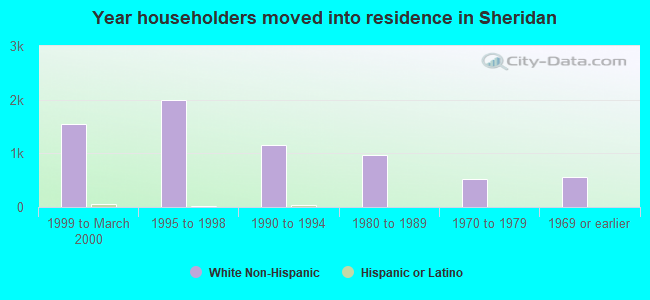
House/condo owner moved in on average 10 years ago
Renter moved in on average 3 years ago
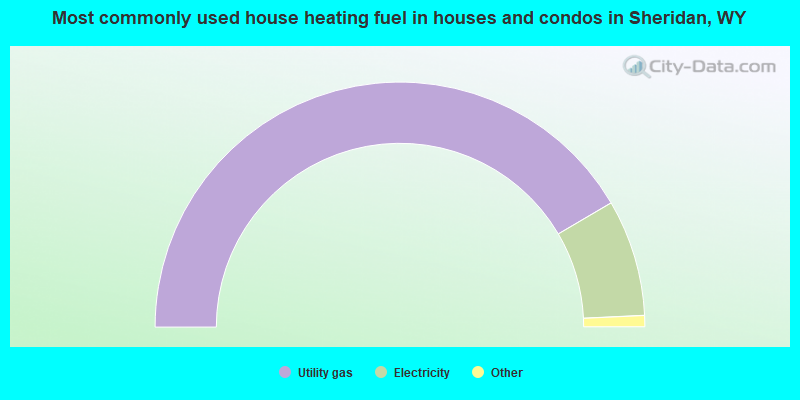
- 83.1%Utility gas
- 15.4%Electricity
- 0.9%Bottled, tank, or LP gas
- 0.3%Wood
- 0.3%No fuel used
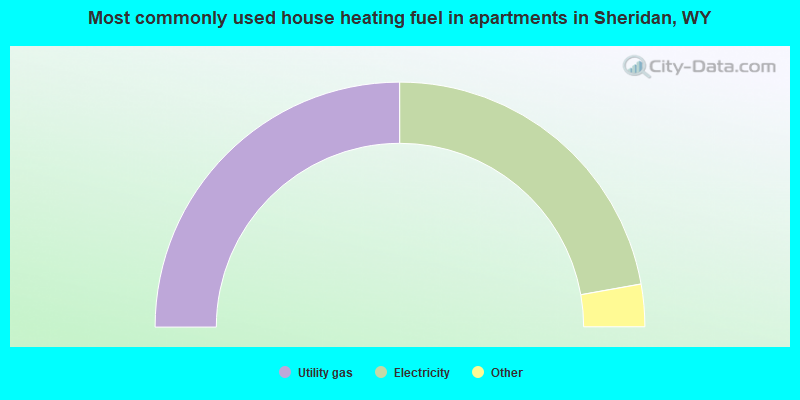
- 50.0%Utility gas
- 44.5%Electricity
- 3.7%Bottled, tank, or LP gas
- 0.9%No fuel used
- 0.7%Wood
- 0.2%Other fuel
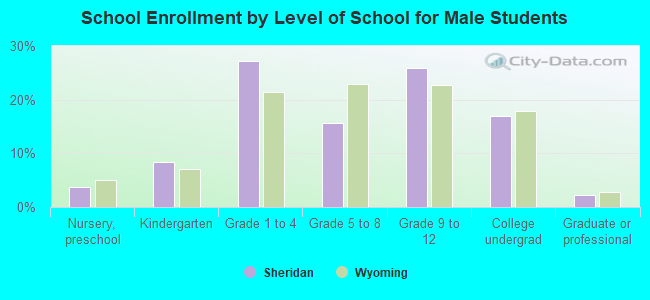
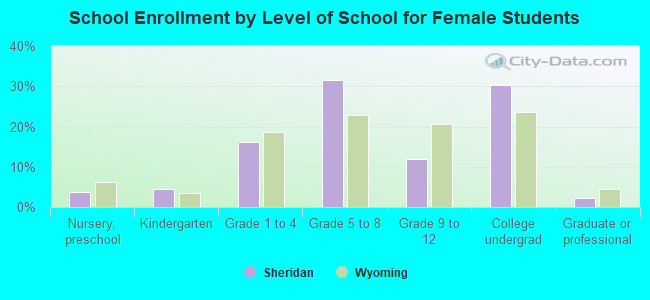
Private vs. public school enrollment:
| Here: | 7.2% |
| Wyoming: | 7.3% |
| Here: | 17.5% |
| Wyoming: | 6.0% |
| Here: | 1.0% |
| Wyoming: | 9.2% |