Races in Sheridan, Wyoming (WY) Detailed Stats
Ancestries, Foreign-born residents, place of birth
Settings
X


Recent posts about races in Sheridan, Wyoming on our local forum with over 2,400,000 registered users:
 | Considering Casper and Sheridan for our family (51 replies) |
| Thinking of moving to Sheridan (62 replies) |
| Interested in buying land in Wyoming, that isn't mormon majority (95 replies) |
| Is Wyoming Changing? (168 replies) |
| Best Area For Western/Cowboy Type Stuff (172 replies) |
| If you had a choice on these particular places... (63 replies) |
Latest news about races in Sheridan, WY collected exclusively by city-data.com from local newspapers, TV, and radio stations
According to 2022 data, the most numerous races in Sheridan, WY are White alone (16,598 residents), Hispanic (1,230 residents), and Two or more races (526 residents). 97.3% of Sheridan residents speak English at home. 2.5% of Sheridan, WY residents are foreign-born (0.8% born in Europe, 0.7% born in Latin America, 0.5% born in North America, 0.4% born in Asia), which is 21.5% less than the foreign-born rate of 3.0% across the entire state of Wyoming.
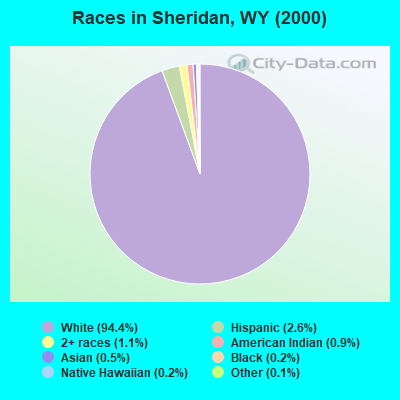
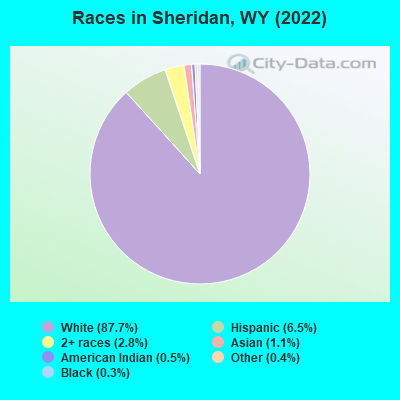
Race distribution in Sheridan
2000
2022

- 14,92694.4%White alone
- 4172.6%Hispanic
- 1721.1%Two or more races
- 1370.9%American Indian alone
- 720.5%Asian alone
- 310.2%Black alone
- 310.2%Native Hawaiian and Other
Pacific Islander alone - 180.1%Other race alone
-
- 16,59887.7%White alone
- 1,2306.5%Hispanic
- 5262.8%Two or more races
- 2101.1%Asian alone
- 1020.5%American Indian alone
- 740.4%Other race alone
- 600.3%Black alone
2000
2022
-
- 438,79988.9%White alone
- 31,6696.4%Hispanic
- 10,2382.1%American Indian alone
- 6,1641.2%Two or more races
- 3,5040.7%Black alone
- 2,6700.5%Asian alone
- 4740.10%Other race alone
- 2640.05%Native Hawaiian and Other
Pacific Islander alone

-
- 473,22081.4%White alone
- 62,80310.8%Hispanic
- 22,9113.9%Two or more races
- 9,5891.6%American Indian alone
- 4,9970.9%Other race alone
- 3,9900.7%Black alone
- 3,5770.6%Asian alone
- 2940.05%Native Hawaiian and Other
Pacific Islander alone

Income and house value in Sheridan
- Median household income in 2022
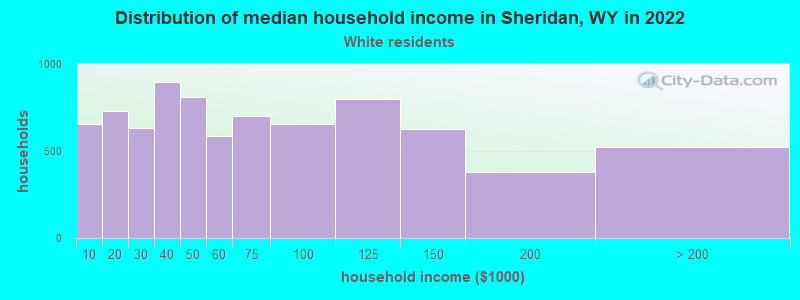
- $54,716White non-Hispanic householders
- $60,932Some other race householders
- $70,567Two or more races householders
- $66,200Hispanic or Latino race householders
- Median 2022 house value
- $326,022White Non-Hispanic householders
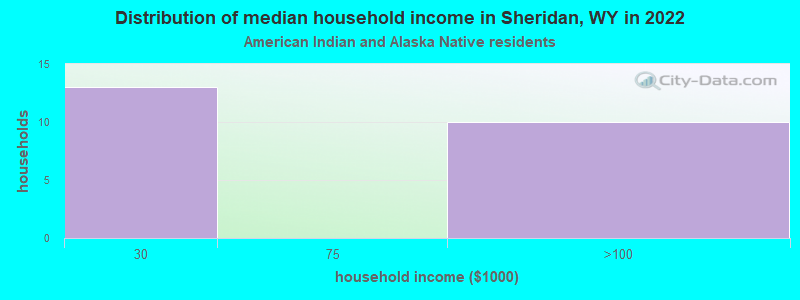
- $423,649American Indian or Alaska Native householders
- $282,072Asian householders
- $410,319Some other race householders
- $259,376Two or more races householders
- $380,419Hispanic or Latino householders
Household income for White non-Hispanic householders
Household income for American Indian and Alaska Native householders
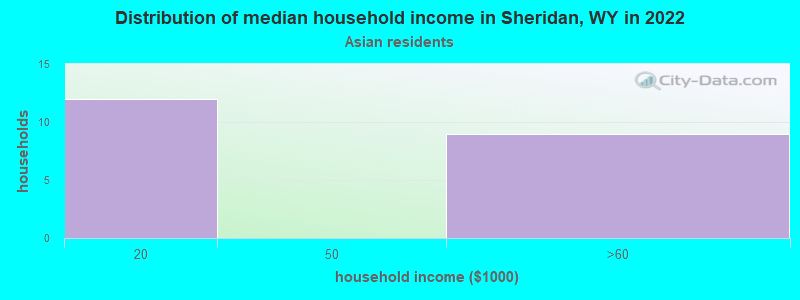
Household income for Asian householders
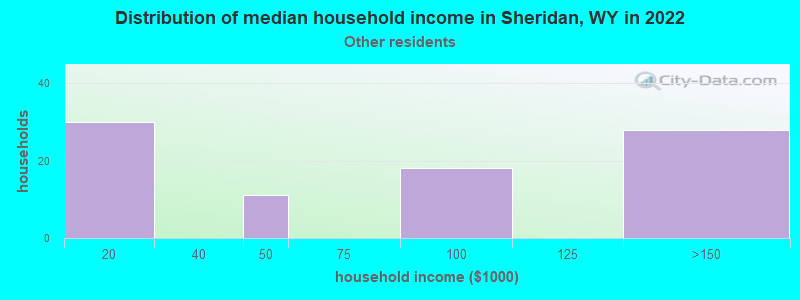
Household income for Some other race householders
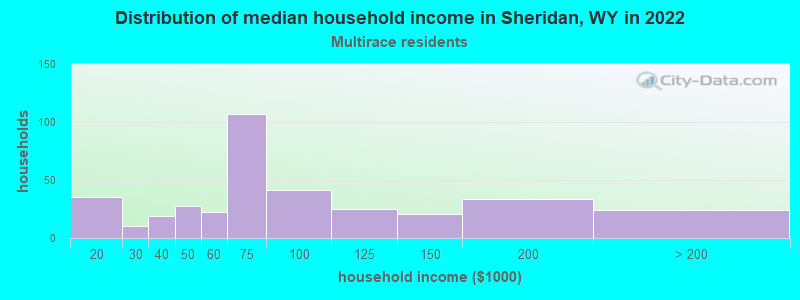
Household income for Two or more races householders
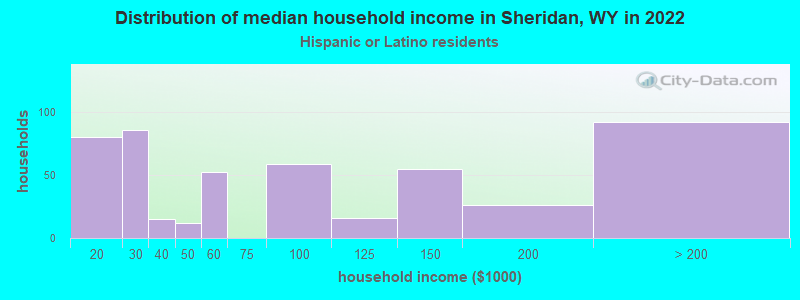
Household income for Hispanic or Latino race householders
Median age by race in Sheridan
- 41.6Median age for White residents
- 41.7Males
- 41.0Females
- 61.7Median age for Black or African American residents
- 52.2Males
- 53.2Females
- 43.4Median age for American Indian / Alaska Native residents
- 61.1Males
- 38.8Females
- 14.0Median age for Asian residents
- -684,684,684.0Males
- 16.2Females
- -594,708,994.1Median age for Native Hawaiian / Pacific Islander residents
- -652,729,383.8Males
- -865,828,091.4Females
- 18.8Median age for Other race residents
- 19.5Males
- 20.1Females
- 40.0Median age for Two or more races residents
- 37.8Males
- 48.2Females
- 41.6Median age for White alone residents
- 41.4Males
- 42.5Females
- 33.4Median age for Hispanic or Latino residents
- 38.7Males
- 22.6Females
Owner/renter occupied households by race in Sheridan
- House owners and renters - White residents
- 4,84661.9%Owner occupied
- 2,98638.1%Renter occupied
- House owners and renters - American Indian / Alaska Native residents
- 1559.6%Owner occupied
- 1040.4%Renter occupied
- House owners and renters - Asian residents
- 14100.0%Owner occupied
- House owners and renters - Other race residents
- 65100.0%Renter occupied
- House owners and renters - Two or more races residents
- 29167.3%Owner occupied
- 14232.7%Renter occupied
- House owners and renters - White alone residents
- 4,78462.5%Owner occupied
- 2,86937.5%Renter occupied
- House owners and renters - Hispanic or Latino residents
- 22551.5%Owner occupied
- 21248.5%Renter occupied
Language usage in Sheridan
- English speakers - Total
- 97.3% of residents of Sheridan speak English at home.
- 2.6% of residents speak Spanish at home
- 28762.1%Speak English very well
- 17537.9%Speak English less than very well
- 0.5% of residents speak other language at home
- 7381.1%Speak English very well
- 1718.9%Speak English less than very well
- English speakers - Born in the United States
- 98.3% of residents of Sheridan speak English at home.
- 1.5% of residents speak Spanish at home
- 7959.0%Speak English very well
- 5541.0%Speak English less than very well
- 0.3% of residents speak other language at home
- 29100.0%Speak English very well
- English speakers - Native, born elsewhere
- 82.4% of residents of Sheridan speak English at home.
- 16.7% of residents speak Spanish at home
- 56100.0%Speak English very well
- English speakers - Foreign-born
- 58.0% of residents of Sheridan speak English at home.
- 28.9% of residents speak Spanish at home
- 7663.9%Speak English very well
- 4336.1%Speak English less than very well
- 9.2% of residents speak other language at home
- 1847.4%Speak English very well
- 2052.6%Speak English less than very well
White (Caucasian) - Speak only English
| Native: | 99.2% (15,695) |
| Foreign-born: | 70.6% (139) |
White (Caucasian) - Speak another language
| Native: | 1.1% (175) |
| Foreign-born: | 34.9% (69) |
Black or African American - Speak only English
| Native: | 100.0% (40) |
| Foreign-born: | 68.5% (19) |
Asian - Speak only English
| Native: | 100.0% (123) |
| Foreign-born: | 94.9% (39) |
Two or more races - Speak only English
| Native: | 95.0% (828) |
| Foreign-born: | 23.1% (15) |
Two or more races - Speak another language
| Native: | 3.7% (32) |
| Foreign-born: | 32.8% (22) |
White alone - Speak only English
| Native: | 99.8% (15,529) |
| Foreign-born: | 85.5% (149) |
White alone - Speak another language
| Native: | 0.5% (81) |
| Foreign-born: | 13.3% (23) |
Hispanic or Latino - Speak only English
| Native: | 72.1% (775) |
| Foreign-born: | 9.9% (12) |
Hispanic or Latino - Speak another language
| Native: | 27.9% (299) |
| Foreign-born: | 97.9% (119) |
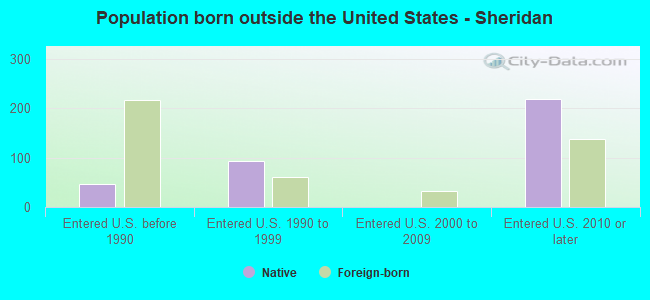
Foreign-born residents in Sheridan
467 residents are foreign born (0.8% Europe, 0.7% Latin America, 0.5% North America, 0.4% Asia).
| This city: | 2.5% |
| Wyoming: | 3.4% |

Marital status for residents in Sheridan
Marital status - White (Caucasian) population 15 years and over
- Males
- 34.0%Never married
- 49.6%Now married
- 1.6%Separated
- 2.4%Widowed
- 12.3%Divorced
- Females
- 23.9%Never married
- 46.6%Now married
- 1.7%Separated
- 12.8%Widowed
- 15.0%Divorced
Women who gave birth in the past 12 months
| Now married: | 59.1% (100) |
| Unmarried: | 40.9% (69) |
Women who did not give birth in the past 12 months
| Now married: | 49.3% (1,671) |
| Unmarried: | 50.7% (1,721) |
Marital status - Black or African American population 15 years and over
- Males
- 32.7%Never married
- 67.3%Now married
- 0.0%Separated
- 0.0%Widowed
- 0.0%Divorced
- Females
- 6.2%Never married
- 81.3%Now married
- 0.0%Separated
- 12.5%Widowed
- 0.0%Divorced
Women who did not give birth in the past 12 months
| Now married: | 92.9% (13) |
| Unmarried: | 7.1% (1) |
Marital status - American Indian / Alaska Native population 15 years and over
- Males
- 35.5%Never married
- 64.5%Now married
- 0.0%Separated
- 0.0%Widowed
- 0.0%Divorced
- Females
- 70.3%Never married
- 21.6%Now married
- 0.0%Separated
- 0.0%Widowed
- 8.1%Divorced
Women who did not give birth in the past 12 months
| Now married: | 22.9% (7) |
| Unmarried: | 77.1% (25) |
Marital status - Asian population 15 years and over
- Males
- 0.0%Never married
- 100.0%Now married
- 0.0%Separated
- 0.0%Widowed
- 0.0%Divorced
- Females
- 57.5%Never married
- 42.5%Now married
- 0.0%Separated
- 0.0%Widowed
- 0.0%Divorced
Women who did not give birth in the past 12 months
| Now married: | 42.5% (17) |
| Unmarried: | 57.5% (24) |
Marital status - Other race population 15 years and over
- Males
- 36.6%Never married
- 39.8%Now married
- 0.0%Separated
- 0.0%Widowed
- 23.6%Divorced
- Females
- 85.2%Never married
- 14.8%Now married
- 0.0%Separated
- 0.0%Widowed
- 0.0%Divorced
Women who gave birth in the past 12 months
| Now married: | 100.0% (14) |
| Unmarried: | 0.0% (0) |
Women who did not give birth in the past 12 months
| Now married: | 0.0% (0) |
| Unmarried: | 100.0% (82) |
Marital status - Two or more races population 15 years and over
- Males
- 33.3%Never married
- 51.4%Now married
- 0.0%Separated
- 0.0%Widowed
- 15.3%Divorced
- Females
- 31.5%Never married
- 46.4%Now married
- 0.0%Separated
- 7.9%Widowed
- 14.2%Divorced
Women who did not give birth in the past 12 months
| Now married: | 48.2% (117) |
| Unmarried: | 51.8% (126) |
Marital status - White alone, not Hispanic / Latino population 15 years and over
- Males
- 34.5%Never married
- 49.4%Now married
- 0.8%Separated
- 2.5%Widowed
- 12.8%Divorced
- Females
- 23.5%Never married
- 46.6%Now married
- 1.6%Separated
- 13.1%Widowed
- 15.1%Divorced
Women who gave birth in the past 12 months
| Now married: | 59.1% (102) |
| Unmarried: | 40.9% (71) |
Women who did not give birth in the past 12 months
| Now married: | 48.8% (1,612) |
| Unmarried: | 51.2% (1,691) |
Marital status - Hispanic or Latino population 15 years and over
- Males
- 25.2%Never married
- 50.8%Now married
- 12.8%Separated
- 0.0%Widowed
- 11.2%Divorced
- Females
- 55.7%Never married
- 34.3%Now married
- 2.7%Separated
- 0.0%Widowed
- 7.3%Divorced
Women who did not give birth in the past 12 months
| Now married: | 33.8% (105) |
| Unmarried: | 66.2% (206) |
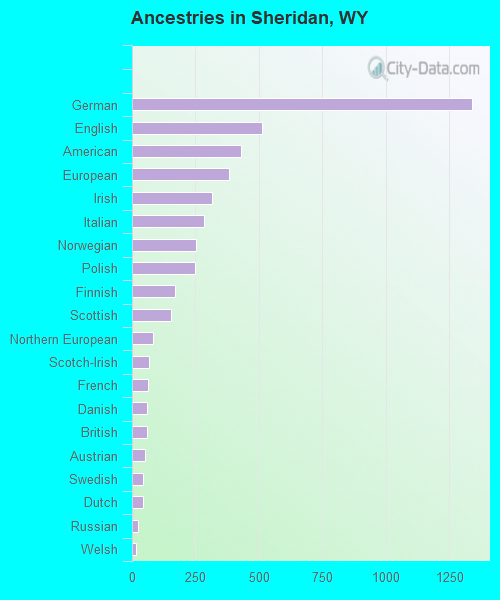
Ancestries in Sheridan

- 1,34020.8%German
- 5117.9%English
- 4306.7%American
- 3835.9%European
- 3164.9%Irish
- 2824.4%Italian
- 2523.9%Norwegian
- 2503.9%Polish
- 1702.6%Finnish
- 1542.4%Scottish
- 821.3%Northern European
- 671.0%Scotch-Irish
- 631.0%French
- 610.9%Danish
- 590.9%British
- 530.8%Austrian
- 450.7%Swedish
- 440.7%Dutch
- 250.4%Russian
- 140.2%Welsh
- 120.2%Scandinavian
- 120.2%Swiss
- 120.2%Yugoslavian
- 110.2%African
- 90.1%Slovene
- 90.1%Ghanaian
- 70.1%Serbian
- 60.09%French Canadian
- 50.08%Armenian
- 10.02%West Indian
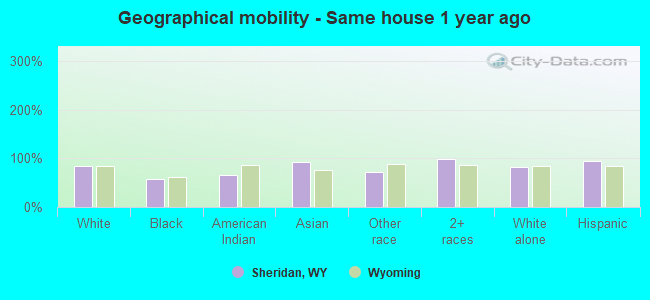
Geographical mobility in Sheridan

- Same house 1 year ago
- 14,04483.6%White (Caucasian)
- 3458.5%Black or African American
- 6865.7%American Indian / Alaska Native
- 26792.7%Asian
- 30871.2%Other race
- 92098.7%Two or more races
- 13,66582.9%White alone, not Hispanic / Latino
- 1,17694.9%Hispanic or Latino
-
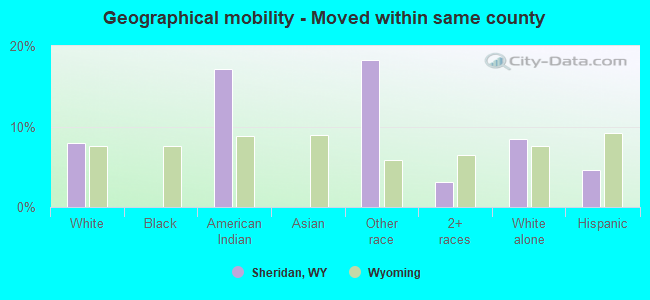
- Moved within same county
- 1,3357.9%White / Caucasian
- 1817.2%American Indian / Alaska Native
- 7918.2%Other race
- 303.2%Two or more races
- 1,3928.4%White alone, not Hispanic / Latino
- 574.6%Hispanic or Latino
-
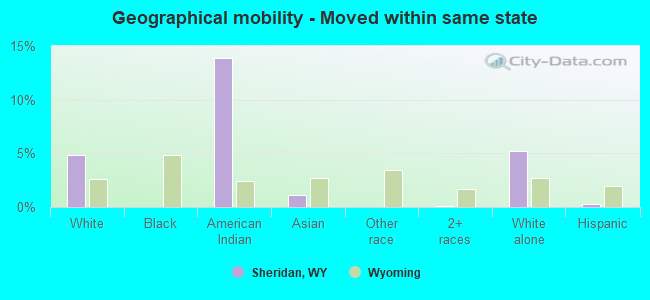
- Moved within same state
- 8114.8%White / Caucasian
- 1413.9%American Indian / Alaska Native
- 31.1%Asian
- 10.1%Two or more races
- 8585.2%White alone, not Hispanic / Latino
- 40.3%Hispanic or Latino
-
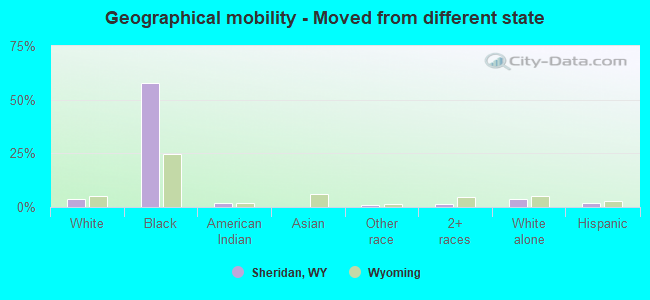
- Moved from different state
- 6303.8%White / Caucasian
- 3357.6%Black or African American
- 22.0%American Indian / Alaska Native
- 30.7%Other race
- 131.4%Two or more races
- 6093.7%White alone, not Hispanic / Latino
- 242.0%Hispanic or Latino
-
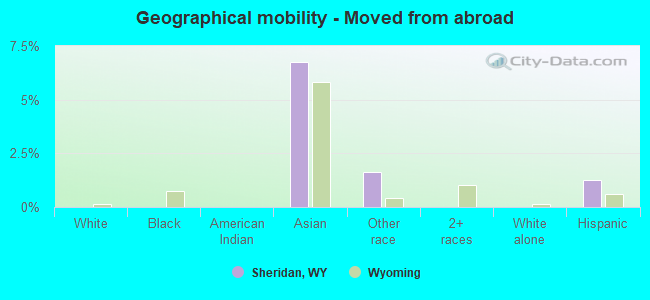
- Moved from abroad
- 10.0%White
- 196.8%Asian
- 71.6%Other race
- 10.0%White alone, not Hispanic / Latino
- 161.3%Hispanic or Latino
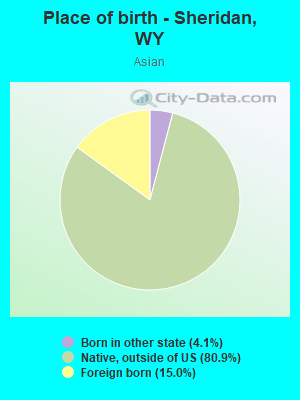
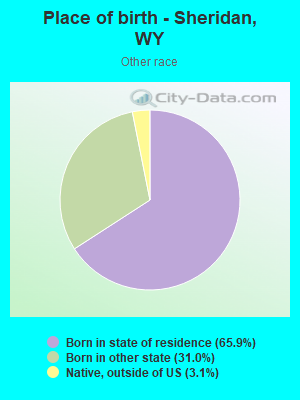
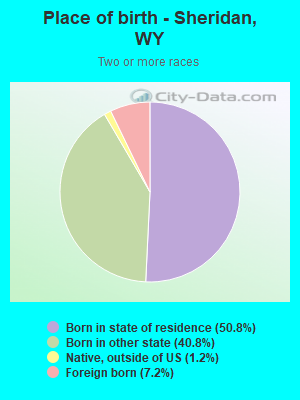
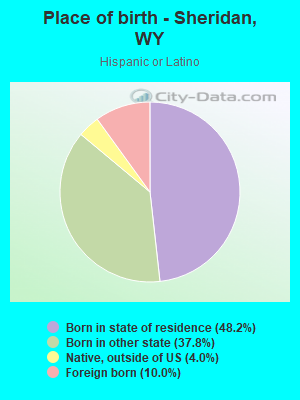
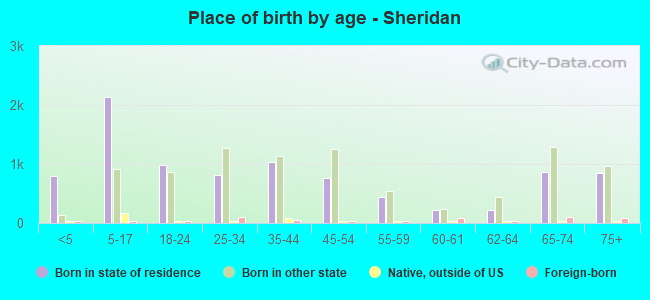
Children Nativity (place of birth) in Sheridan
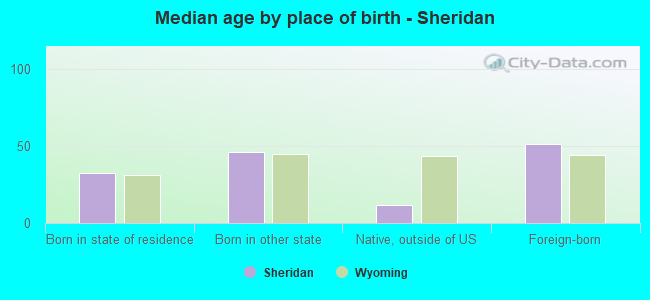
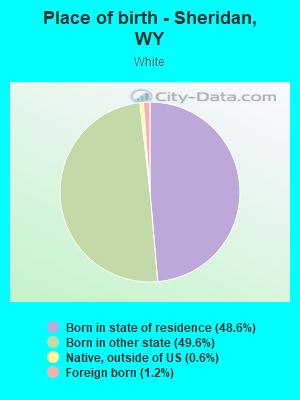
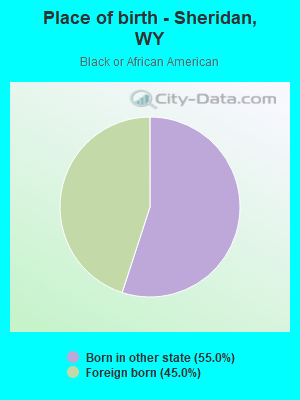
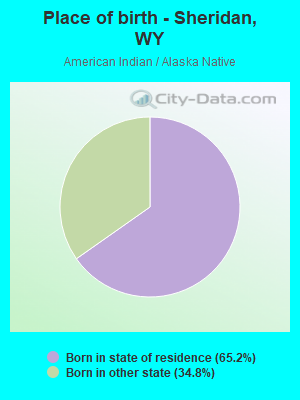
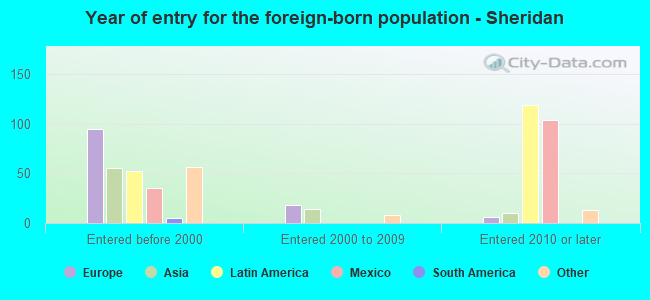
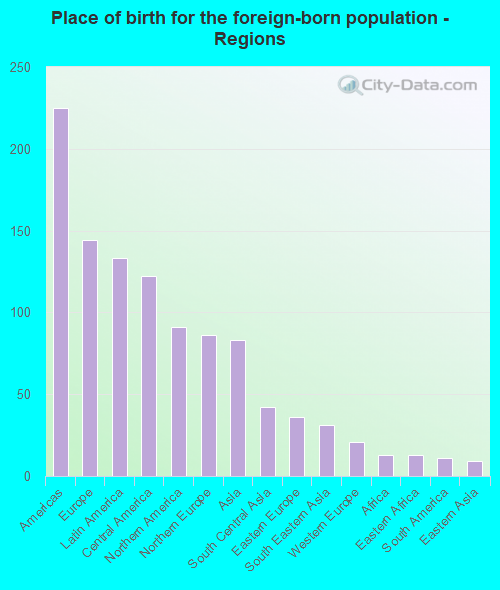
Place of birth for residents in Sheridan
![Place of birth for the foreign-born population - Regions]()
- 225Americas
- 144Europe
- 133Latin America
- 122Central America
- 91Northern America
- 86Northern Europe
- 83Asia
- 42South Central Asia
- 36Eastern Europe
- 31South Eastern Asia
- 21Western Europe
- 13Africa
- 13Eastern Africa
- 11South America
- 9Eastern Asia
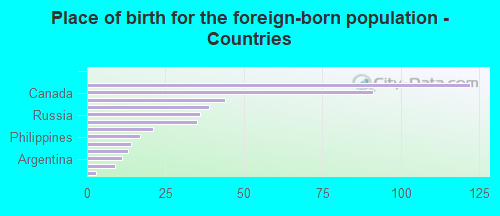
![Place of birth for the foreign-born population - Countries]()
- 122Mexico
- 91Canada
- 44England
- 39Iran
- 36Russia
- 35United Kingdom
- 21France
- 17Philippines
- 14Thailand
- 13Uganda
- 11Argentina
- 9Korea
- 3India
Grandparents responsible for own grandchildren in Sheridan
Zip codes: 82801.