Sevierville, TN (Tennessee) Houses and Residents
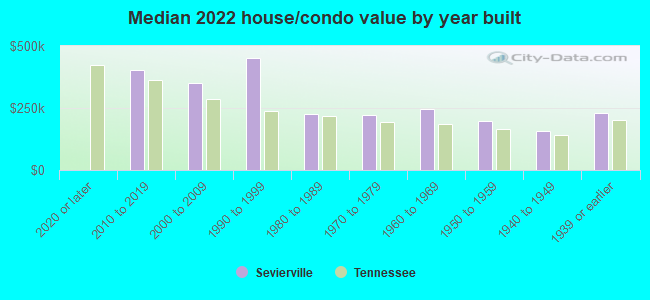
| Sevierville: | $316,483 |
| Tennessee: | $284,800 |
Mean price in 2022:
Detached houses: $339,332
Here: $339,332 State: $374,382 Townhouses or other attached units: $353,636
Here: $353,636 State: $354,101 In 2-unit structures: $129,625
Here: $129,625 State: $247,693 In 5-or-more-unit structures: $242,129
Here: $242,129 State: $317,434 Mobile homes: $53,332
Here: $53,332 State: $101,421
Total population: 16,355 (Urban population: 10,241 (all inside urban clusters), Rural population: 1,594 (26 farm, 1,568 nonfarm))
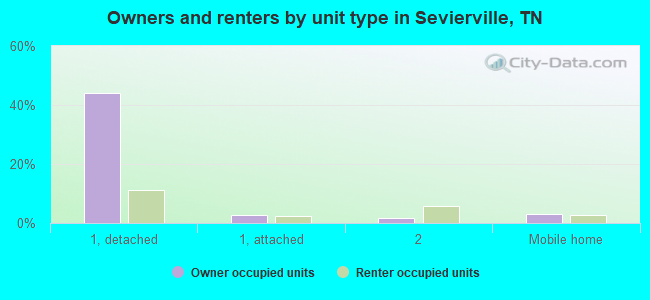
Houses: 9,204 (7,427 occupied: 4,281 owner occupied, 3,744 renter occupied)
| % of renters here: | 47% |
| State: | 33% |
Housing density: 463 houses/condos per square mile
Median price asked for vacant for-sale houses and condos in 2022: $387,853.
Median contract rent in 2022: $890 (lower quartile is $742, upper quartile is $1,140)
Median rent asked for vacant for-rent units in 2022: $1,074
Median gross rent in Sevierville, TN in 2022: $1,061
Housing units in Sevierville with a mortgage: 2,178 (66 second mortgage, 0 home equity loan, 51 both second mortgage and home equity loan)
Houses without a mortgage: 87
Median household income for houses/condos with a mortgage: $70,999
Median household income for apartments without a mortgage: $64,618
Median monthly housing costs: $983
Compare current foreclosures in Sevierville, TN:
| Photo | Address | Area | Beds / Baths | Price | Details |
|---|---|---|---|---|---|

|
#1
Shaconage Trl
Sevierville, TN 37876
|
2,516 sq. feet
|
2 baths - beds |
show details | |

|
#2
Mountain Vista Rd
Sevierville, TN 37876
|
1,266 sq. feet
|
2 baths - beds |
show details | |

|
#3
Old Newport Hwy
Sevierville, TN 37876
|
1,428 sq. feet
|
1 baths - beds |
show details | |

|
#4
N Circle Dr
Sevierville, TN 37862
|
1,355 sq. feet
|
1 baths - beds |
show details | |

|
#5
Mountain Berry Dr
Sevierville, TN 37862
|
1,334 sq. feet
|
2 baths - beds |
show details | |

|
#6
Eledge Ln
Sevierville, TN 37876
|
1,584 sq. feet
|
2 baths - beds |
show details | |

|
#7
Bow Ct
Sevierville, TN 37876
|
1,176 sq. feet
|
2 baths - beds |
show details | |

|
#8
Indian Warpath Rd
Sevierville, TN 37876
|
3,330 sq. feet
|
1 baths - beds |
show details | |

|
#9
Allensville Rdg
Sevierville, TN 37876
|
1,176 sq. feet
|
2 baths - beds |
show details | |

|
#10
Silverado Ct
Sevierville, TN 37876
|
1,288 sq. feet
|
2 baths - beds |
show details |
| Photo | Address | Area | Beds / Baths | Price | Details |
|---|---|---|---|---|---|

|
#11
Pleasure Rd
Sevierville, TN 37876
|
1,632 sq. feet
|
2 baths - beds |
show details | |

|
#12
Thomaswood Trl
Sevierville, TN 37876
|
2,008 sq. feet
|
1 baths - beds |
show details | |

|
#13
Gregory Valley Dr
Sevierville, TN 37876
|
1,590 sq. feet
|
2 baths - beds |
show details | |

|
#14
River Bottom Dr
Sevierville, TN 37862
|
970 sq. feet
|
2 baths - beds |
show details | |

|
#15
Old Engle Town Rd
Sevierville, TN 37862
|
1,056 sq. feet
|
1 baths - beds |
show details | |

|
#16
Lake View Loop
Sevierville, TN 37876
|
600 sq. feet
|
1 baths - beds |
show details | |

|
#17
Catlett Dr
Sevierville, TN 37876
|
1,056 sq. feet
|
2 baths - beds |
show details | |

|
#18
Silvercrest Ct
Sevierville, TN 37862
|
2,335 sq. feet
|
2 baths - beds |
show details | |

|
#19
Union Dell Ct
Sevierville, TN 37876
|
1,040 sq. feet
|
2 baths - beds |
show details | |

|
#20
Bluff Mountain Rd
Sevierville, TN 37876
|
672 sq. feet
|
1 baths - beds |
show details |
| Photo | Address | Area | Beds / Baths | Price | Details |
|---|---|---|---|---|---|

|
#21
Woodvale Ln
Sevierville, TN 37876
|
1,408 sq. feet
|
1 baths - beds |
show details | |

|
#22
Binginham Is
Sevierville, TN 37876
|
1,675 sq. feet
|
2 baths - beds |
show details | |

|
#23
Greenway Dr
Sevierville, TN 37862
|
1,862 sq. feet
|
2 baths - beds |
show details | |

|
#24
Byrd Hollow Rd
Sevierville, TN 37876
|
912 sq. feet
|
1 baths - beds |
show details | |

|
#25
Park Ln
Sevierville, TN 37876
|
1,222 sq. feet
|
2 baths - beds |
show details | |

|
#26
Riverview Cir
Sevierville, TN 37862
|
1,493 sq. feet
|
2 baths - beds |
show details | |

|
#27
Powder Springs Rd
Sevierville, TN 37876
|
1,160 sq. feet
|
3 baths - beds |
show details | |

|
#28
Twin Oaks Rd
Sevierville, TN 37876
|
1,092 sq. feet
|
2 baths - beds |
show details | |

|
#29
Arch Rock Dr
Sevierville, TN 37876
|
2,196 sq. feet
|
2 baths - beds |
show details | |

|
#30
Dellwood Dr
Sevierville, TN 37876
|
1,276 sq. feet
|
2 baths - beds |
show details |
| Photo | Address | Area | Beds / Baths | Price | Details |
|---|---|---|---|---|---|

|
#31
Tranquility Ln
Sevierville, TN 37876
|
2,106 sq. feet
|
1 baths - beds |
show details | |

|
#32
Beverly Hills Dr
Sevierville, TN 37862
|
- sq. feet
|
- baths - beds |
show details | |

|
#33
Beverly Hills Dr
Sevierville, TN 37862
|
- sq. feet
|
- baths - beds |
show details | |

|
#34
Secretariat Way
Sevierville, TN 37876
|
- sq. feet
|
- baths - beds |
show details | |

|
#35
Reed Schoolhouse Rd
Sevierville, TN 37876
|
- sq. feet
|
- baths - beds |
show details | |

|
#36
New Era Rd # 3108
Sevierville, TN 37862
|
- sq. feet
|
- baths - beds |
show details | |

|
#37
Sand Plant Rd
Sevierville, TN 37876
|
- sq. feet
|
- baths - beds |
show details | |

|
#38
Binginham Is
Sevierville, TN 37876
|
- sq. feet
|
- baths - beds |
show details | |

|
#39
Bluff Mountain Rd
Sevierville, TN 37876
|
- sq. feet
|
- baths - beds |
show details | |

|
#40
Murrell Meadows Dr # 28
Sevierville, TN 37876
|
- sq. feet
|
- baths - beds |
show details |
| Photo | Address | Area | Beds / Baths | Price | Details |
|---|---|---|---|---|---|

|
#41
Providence Hills Rd Lot 2
Sevierville, TN 37876
|
- sq. feet
|
- baths - beds |
show details | |

|
#42
Panther Creek Rd
Sevierville, TN 37876
|
- sq. feet
|
- baths - beds |
show details | |

|
#43
Wilhite Rd
Sevierville, TN 37876
|
1,216 sq. feet
|
- baths - beds |
show details | |

|
#44
Love Rd
Sevierville, TN 37862
|
- sq. feet
|
- baths - beds |
show details | |

|
#45
Frost Valley Ct
Sevierville, TN 37876
|
- sq. feet
|
- baths - beds |
show details | |

|
#46
Short St
Sevierville, TN 37876
|
- sq. feet
|
- baths - beds |
show details | |

|
#47
Maples Hollow Rd
Sevierville, TN 37876
|
- sq. feet
|
- baths - beds |
show details | |

|
#48
Caton Rd
Sevierville, TN 37862
|
- sq. feet
|
- baths - beds |
show details | |

|
#49
Douglas Dam Rd
Sevierville, TN 37876
|
- sq. feet
|
- baths - beds |
show details | |

|
Check over 1 million property listings on Foreclosure.com!
|
browse all offers | |||

Latest news about housing in Sevierville, TN collected exclusively by city-data.com from local newspapers, TV, and radio stations


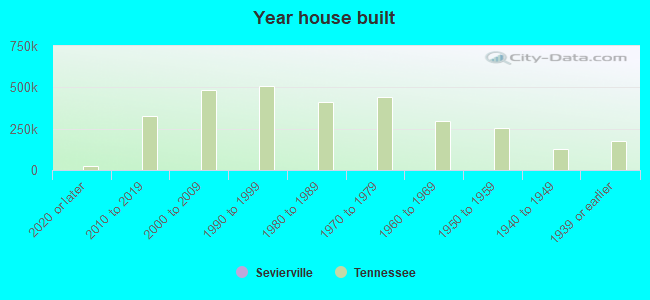
Median year apartment built: 2005
Household type by relationship:
Households: 18,047- Male householders: 3,708 (808 living alone), Female householders: 3,474 (1,199 living alone)
3,162 spouses (3,123 opposite-sex spouses), 582 unmarried partners, (556 opposite-sex unmarried partners), 4,625 children (4,316 natural, 76 adopted, 232 stepchildren), 243 grandchildren, 175 brothers or sisters, 258 parents, 0 foster children, 528 other relatives, 584 non-relatives
- In group quarters: 700
Size of family households: 2,475 2-persons, 1,249 3-persons, 688 4-persons, 353 5-persons, 260 6-persons, 53 7-or-more-persons.
Size of nonfamily households: 2,181 1-person, 627 2-persons, 58 3-persons, 72 4-persons.
1,871 married couples with children.
807 single-parent households (123 men, 684 women).
81.4% of residents of Sevierville speak English at home.
15.4% of residents speak Spanish at home (44% speak English very well, 21% speak English well, 18% speak English not well, 17% don't speak English at all).
3.3% of residents speak other Indo-European language at home (65% speak English very well, 17% speak English well, 9% speak English not well, 9% don't speak English at all).
0.5% of residents speak Asian or Pacific Island language at home (83% speak English very well, 17% speak English well).
0.1% of residents speak other language at home (100% speak English well).
Foreign born population: 2,847 (15.8%)
(8.6% of them are naturalized citizens)
| Here: | 6.2 |
| State: | 6.5 |
| Here: | 4.2 |
| State: | 4.4 |
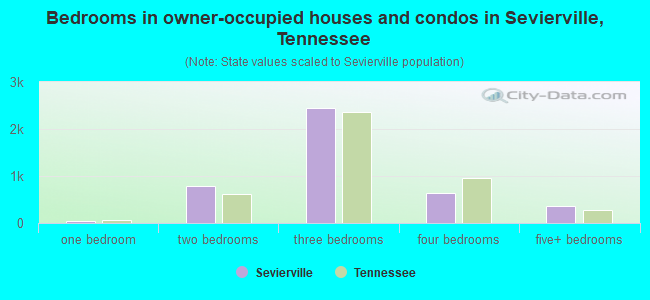
- Bedrooms in owner-occupied houses and condos in Sevierville, Tennessee
- 0no bedroom
- 481 bedroom
- 7782 bedrooms
- 2,4553 bedrooms
- 6374 bedrooms
- 3635+ bedrooms
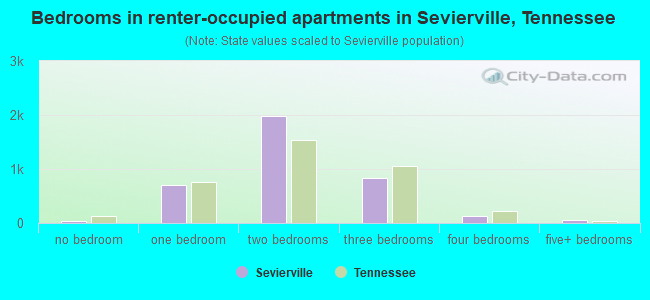
- Bedrooms in renter-occupied apartments in Sevierville, Tennessee
- 46no bedroom
- 7011 bedroom
- 1,9802 bedrooms
- 8393 bedrooms
- 1244 bedrooms
- 555+ bedrooms
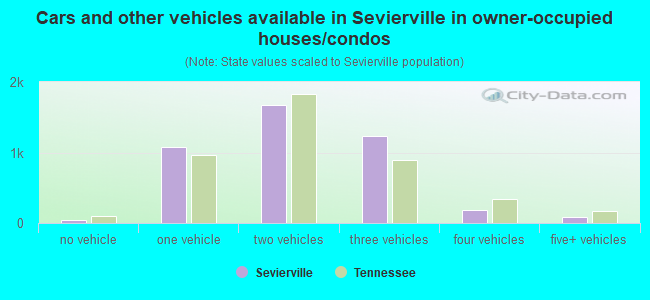
- Cars and other vehicles available in Sevierville in owner-occupied houses/condos
- 36no vehicle
- 1,0721 vehicle
- 1,6692 vehicles
- 1,2393 vehicles
- 1834 vehicles
- 835+ vehicles
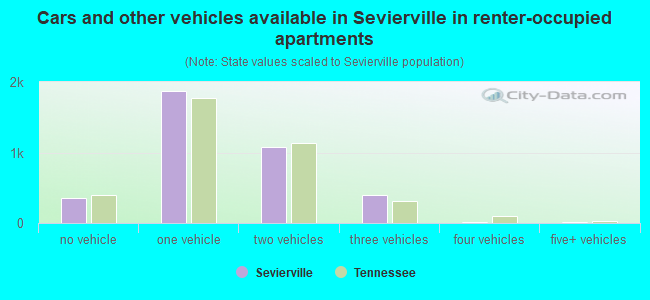
- Cars and other vehicles available in Sevierville in renter-occupied apartments
- 353no vehicle
- 1,8721 vehicle
- 1,0852 vehicles
- 3933 vehicles
- 204 vehicles
- 205+ vehicles
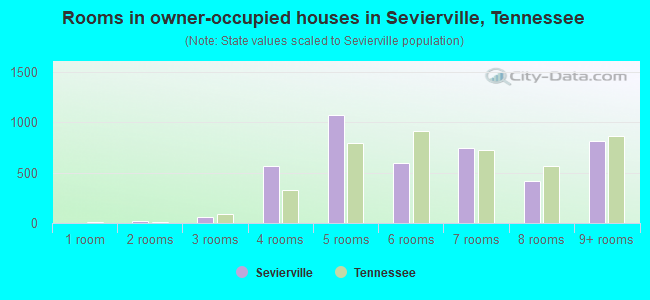
- Rooms in owner-occupied houses in Sevierville, Tennessee
- 01 room
- 222 rooms
- 573 rooms
- 5684 rooms
- 1,0715 rooms
- 5926 rooms
- 7457 rooms
- 4148 rooms
- 8129+ rooms
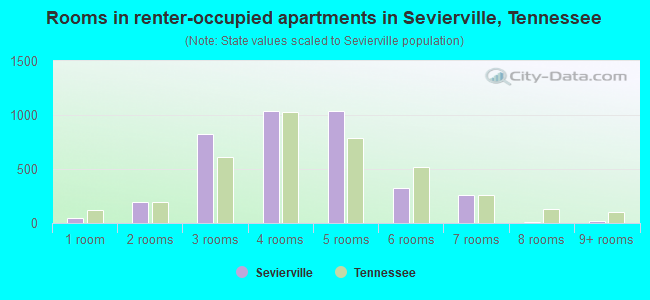
- Rooms in renter-occupied apartments in Sevierville, Tennessee
- 461 room
- 1922 rooms
- 8253 rooms
- 1,0354 rooms
- 1,0355 rooms
- 3216 rooms
- 2637 rooms
- 88 rooms
- 209+ rooms
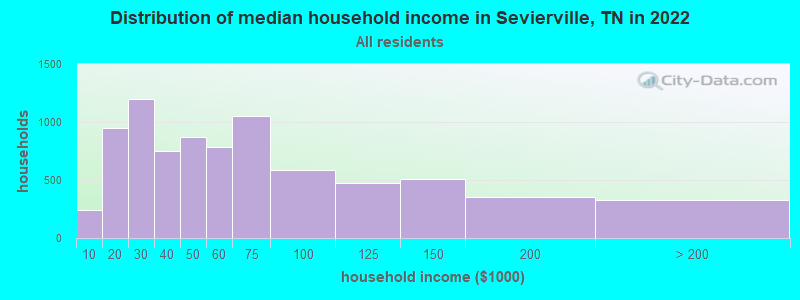
Sevierville, TN household income distribution

- 245Less than $10,000
- 950$10,000 to $19,999
- 1,195$20,000 to $29,999
- 749$30,000 to $39,999
- 867$40,000 to $49,999
- 782$50,000 to $59,999
- 1,049$60,000 to $74,999
- 585$75,000 to $99,999
- 473$100,000 to $124,999
- 506$125,000 to $149,999
- 353$150,000 to $199,999
- 327$200,000 or more
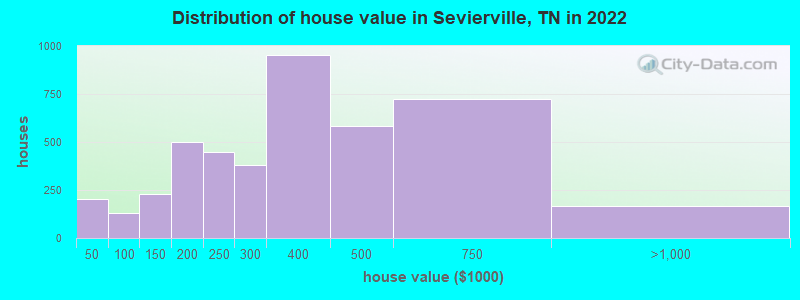
Home value of owner - occupied houses in 2022 in Sevierville, TN
-
- 52Less than $10,000
- 30$10,000 to $14,999
- 24$20,000 to $24,999
- 25$25,000 to $29,999
- 51$30,000 to $34,999
- 17$40,000 to $49,999
- 3$50,000 to $59,999
- 10$60,000 to $69,999
- 24$70,000 to $79,999
- 57$80,000 to $89,999
- 17$90,000 to $99,999
- 178$100,000 to $124,999
- 50$125,000 to $149,999
- 355$150,000 to $174,999
- 146$175,000 to $199,999
- 450$200,000 to $249,999
- 381$250,000 to $299,999
- 951$300,000 to $399,999
- 581$400,000 to $499,999
- 722$500,000 to $749,999
- 159$750,000 to $999,999
- 4$1,500,000 to $1,999,999
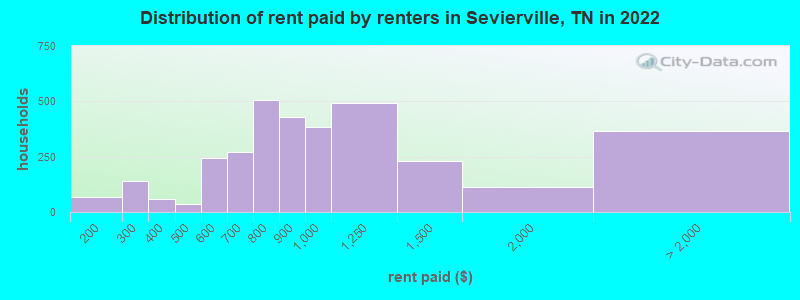
Rent paid by renters in 2022 in Sevierville, TN
-
- 69$150 to $199
- 38$200 to $249
- 102$250 to $299
- 17$300 to $349
- 39$350 to $399
- 19$400 to $449
- 14$450 to $499
- 156$500 to $549
- 87$550 to $599
- 120$600 to $649
- 149$650 to $699
- 401$700 to $749
- 103$750 to $799
- 429$800 to $899
- 384$900 to $999
- 491$1,000 to $1,249
- 231$1,250 to $1,499
- 111$1,500 to $1,999
- 56$2,000 to $2,499
- 308No cash rent
Percentage of workers working in this county: 87.3%
Number of people working at home: 463 (5.4% of all workers)

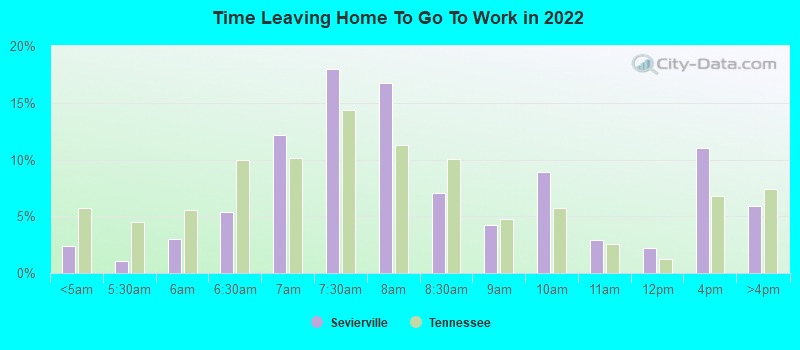
Travel time to work (commute)
- Less than 5 minutes: 246
- 5 to 9 minutes: 451
- 10 to 14 minutes: 1,663
- 15 to 19 minutes: 1,861
- 20 to 24 minutes: 1,378
- 25 to 29 minutes: 729
- 30 to 34 minutes: 697
- 35 to 39 minutes: 144
- 40 to 44 minutes: 232
- 45 to 59 minutes: 793
- 60 to 89 minutes: 707
- 90 or more minutes: 50
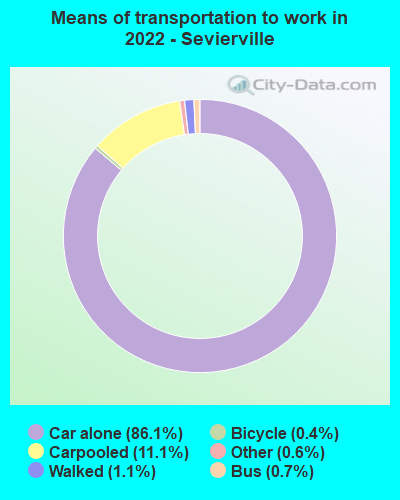
Means of transportation to work:
- Drove a car alone: 16,397 (80.6%)
- Carpooled: 2,246 (11.0%)
- Bus: 112 (0.6%)
- Taxi: 141 (0.7%)
- Bicycle: 84 (0.4%)
- Walked: 224 (1.1%)
- Worked at home: 463 (2.3%)
- Unemployment by race in 2022
- Unemployment rate for White non-Hispanic residents
- 1.0%Males
- 0.7%Females
- Unemployment rate for two or more race residents
- 14.7%Males
- Unemployment rate for Hispanic or Latino residents
- 2.3%Males
- 8.6%Females
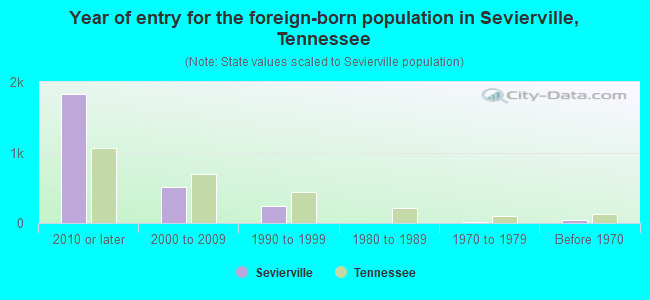
- Year of entry for the foreign-born population in Sevierville, Tennessee
- 1,8332010 or later
- 5092000 to 2009
- 2401990 to 1999
- 01980 to 1989
- 161970 to 1979
- 49Before 1970
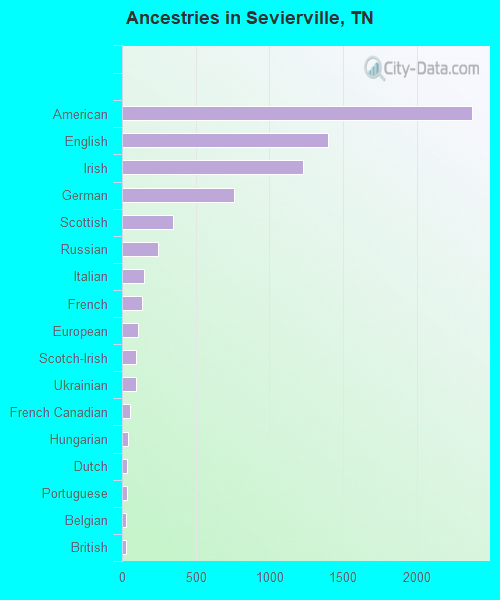
First ancestries reported:
- American: 2,373 (22.3%)
- English: 1,400 (13.2%)
- Irish: 1,226 (11.5%)
- German: 759 (7.1%)
- Scottish: 349 (3.3%)
- Russian: 245 (2.3%)
- Italian: 152 (1.4%)
- French: 133 (1.2%)
- European: 110 (1.0%)
- Scotch-Irish: 98 (0.9%)
- Ukrainian: 96 (0.9%)
- French Canadian: 51 (0.5%)
- Hungarian: 38 (0.4%)
- Dutch: 33 (0.3%)
- Portuguese: 32 (0.3%)
- Belgian: 30 (0.3%)
- British: 27 (0.3%)
- Norwegian: 17 (0.2%)
- Welsh: 15 (0.1%)
- Danish: 13 (0.1%)
- Greek: 11 (0.1%)
- Finnish: 3 (0.03%)
Most common places of birth for foreign-born residents (%):
| Sevierville: | 51.9% (1,316) |
| Tennessee: | 4.6% (17,433) |
| Sevierville: | 14.5% (367) |
| Tennessee: | 23.0% (86,435) |
| Sevierville: | 9.1% (230) |
| Tennessee: | 6.1% (23,079) |
| Sevierville: | 8.4% (212) |
| Tennessee: | 1.0% (3,879) |
| Sevierville: | 4.3% (108) |
| Tennessee: | 0.3% (1,003) |
| Sevierville: | 4.0% (101) |
| Tennessee: | 0.4% (1,462) |
| Sevierville: | 2.5% (63) |
| Tennessee: | 1.0% (3,809) |
| Sevierville: | 2.4% (60) |
| Tennessee: | 1.2% (4,587) |
| Sevierville: | 2.2% (56) |
| Tennessee: | 0.6% (2,261) |
| Sevierville: | 1.7% (44) |
| Tennessee: | 0.5% (1,963) |
Place of birth for U.S.-born residents:
- This state: 8,773
- Other state: 6,552
- Northeast: 1,196
- Midwest: 2,050
- South: 2,543
- West: 839
88.8% of Sevierville residents lived in the same house 1 years ago.
Out of people who lived in different houses, 34.0% lived in this county.
Out of people who lived in different counties, 42.8% lived in Tennessee.
| Sevierville: | 88.8% |
| State average: | 87.0% |
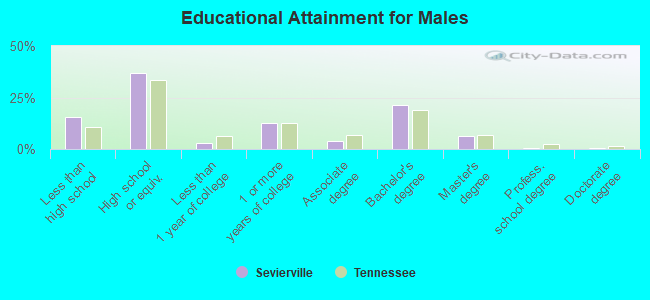
Education attainment for males 25 years and older:
- No schooling: 214
- Nursery to 4th grade: 11
- 5th and 6th grade: 82
- 7th and 8th grade: 269
- 9th grade: 79
- 10th grade: 62
- 11th grade: 104
- 12th grade, no diploma: 197
- High school graduate (or equivalency): 2,411
- Less than 1 year of college: 181
- Some college more than 1 year, no degree: 816
- Associate degree: 262
- Bachelor's degree: 1,385
- Master's degree: 425
- Professional school degree: 42
- Doctorate degree: 17
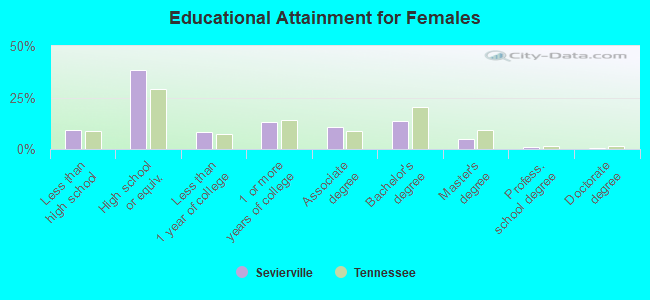
Education attainment for females 25 years and older:
- No schooling: 32
- Nursery to 4th grade: 0
- 5th and 6th grade: 80
- 7th and 8th grade: 97
- 9th grade: 164
- 10th grade: 96
- 11th grade: 32
- 12th grade, no diploma: 109
- High school graduate (or equivalency): 2,526
- Less than 1 year of college: 549
- Some college more than 1 year, no degree: 872
- Associate degree: 716
- Bachelor's degree: 909
- Master's degree: 315
- Professional school degree: 76
- Doctorate degree: 22
Housing units in structures:
- One, detached: 4,727
- One, attached: 340
- Two: 472
- 3 or 4: 340
- 5 to 9: 896
- 10 to 19: 693
- 20 to 49: 803
- 50 or more: 345
- Mobile homes: 586
Median worth of mobile homes: $38,935
Housing units lacking complete kitchen facilities in 2022: 1.4%
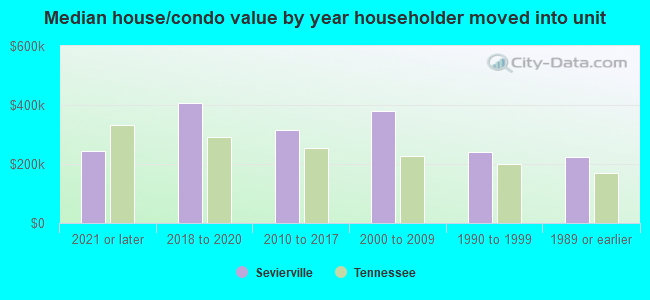
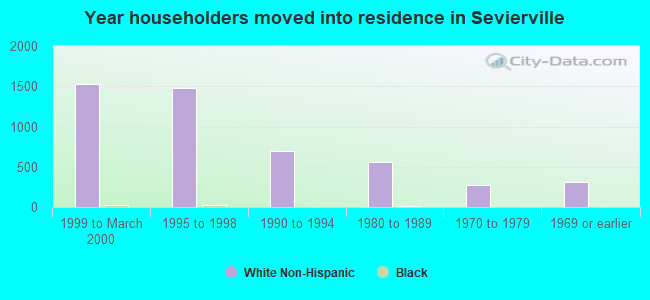
House/condo owner moved in on average 11 years ago
Renter moved in on average 2 years ago
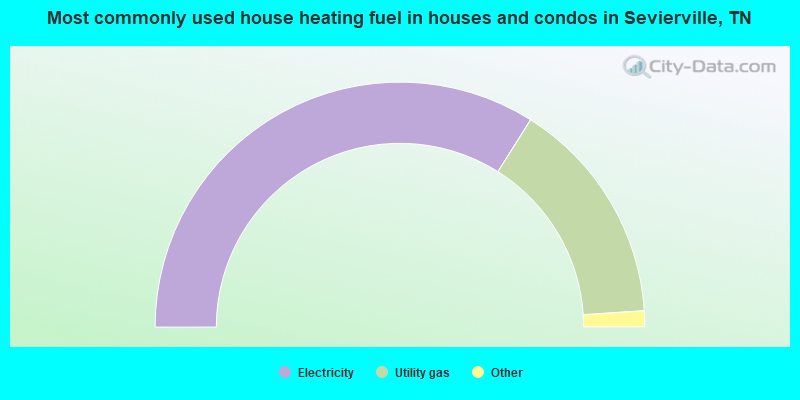
- 67.9%Electricity
- 30.0%Utility gas
- 1.2%Wood
- 0.7%No fuel used
- 0.3%Bottled, tank, or LP gas
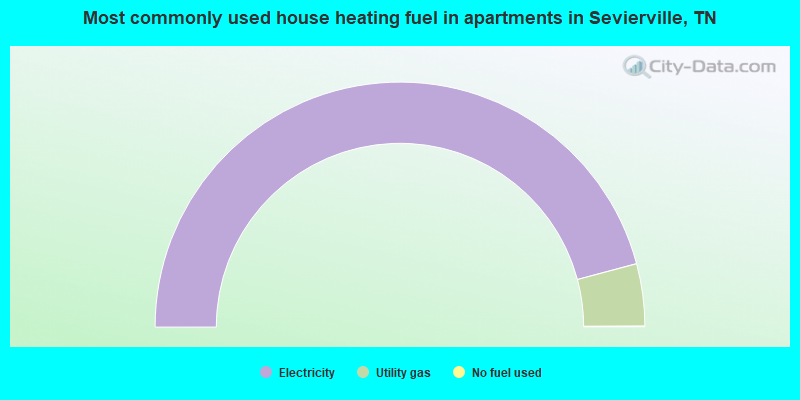
- 91.5%Electricity
- 8.2%Utility gas
- 0.1%No fuel used
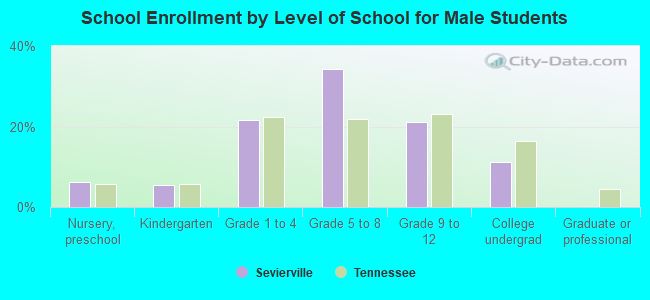
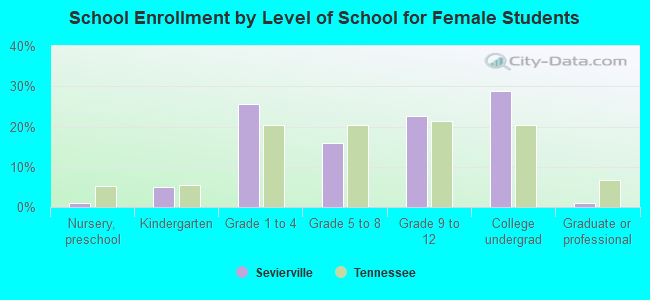
Private vs. public school enrollment:
| Here: | 5.5% |
| Tennessee: | 15.0% |
| Here: | 6.9% |
| Tennessee: | 16.2% |
| Here: | 18.6% |
| Tennessee: | 23.5% |