Races in Sevierville, Tennessee (TN) Detailed Stats
Data:
Races - White alone (%)
Races - White alone (% change since 2000)
Races - Black alone (%)
Races - Black alone (% change since 2000)
Races - American Indian alone (%)
Races - American Indian alone (% change since 2000)
Races - Asian alone (%)
Races - Asian alone (% change since 2000)
Races - Hispanic (%)
Races - Hispanic (% change since 2000)
Races - Native Hawaiian and Other Pacific Islander alone (%)
Races - Native Hawaiian and Other Pacific Islander alone (% change since 2000)
Races - Two or more races(%)
Races - Two or more races(% change since 2000)
Races - Other race alone (%)
Races - Other race alone (% change since 2000)
Racial diversity
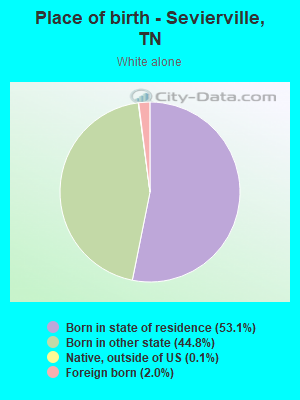
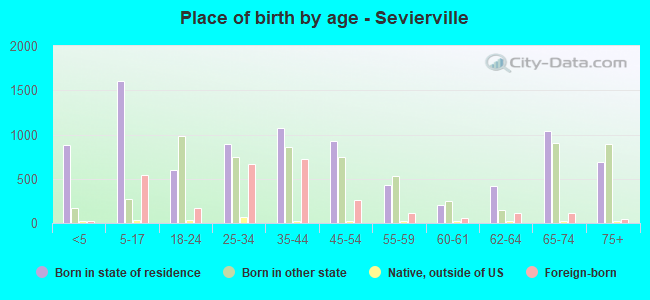
Place of birth - Born in state of residence (%)
Place of birth - Born in state of residence (%) - White
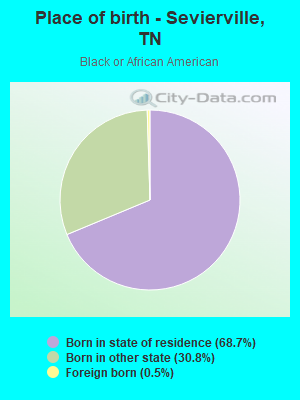
Place of birth - Born in state of residence (%) - Black or African American
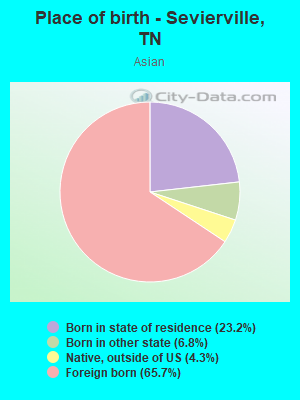
Place of birth - Born in state of residence (%) - Asian
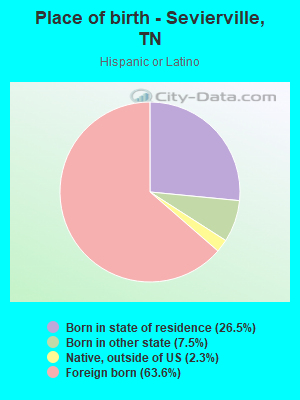
Place of birth - Born in state of residence (%) - Hispanic or Latino
Place of birth - Born in state of residence (%) - American Indian and Alaska Native
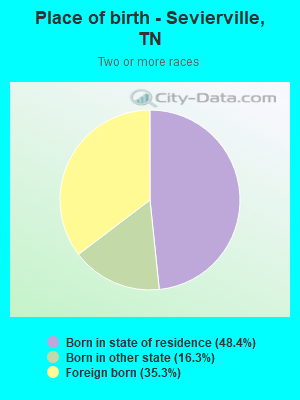
Place of birth - Born in state of residence (%) - Multirace
Place of birth - Born in state of residence (%) - Other Race
Place of birth - Born in other state (%)
Place of birth - Born in other state (%) - White
Place of birth - Born in other state (%) - Black or African American
Place of birth - Born in other state (%) - Asian
Place of birth - Born in other state (%) - Hispanic or Latino
Place of birth - Born in other state (%) - American Indian and Alaska Native
Place of birth - Born in other state (%) - Multirace
Place of birth - Born in other state (%) - Other Race
Place of birth - Native, outside of US (%)
Place of birth - Native, outside of US (%) - White
Place of birth - Native, outside of US (%) - Black or African American
Place of birth - Native, outside of US (%) - Asian
Place of birth - Native, outside of US (%) - Hispanic or Latino
Place of birth - Native, outside of US (%) - American Indian and Alaska Native
Place of birth - Native, outside of US (%) - Multirace
Place of birth - Native, outside of US (%) - Other Race
Place of birth - Foreign born (%)
Place of birth - Foreign born (%) - White
Place of birth - Foreign born (%) - Black or African American
Place of birth - Foreign born (%) - Asian
Place of birth - Foreign born (%) - Hispanic or Latino
Place of birth - Foreign born (%) - American Indian and Alaska Native
Place of birth - Foreign born (%) - Multirace
Place of birth - Foreign born (%) - Other Race
Residents speaking English at home (%)
Residents speaking English at home - Born in the United States (%)
Residents speaking English at home - Native, born elsewhere (%)
Residents speaking English at home - Foreign born (%)
Residents speaking Spanish at home (%)
Residents speaking Spanish at home - Born in the United States (%)
Residents speaking Spanish at home - Native, born elsewhere (%)
Residents speaking Spanish at home - Foreign born (%)
Residents speaking other language at home (%)
Residents speaking other language at home - Born in the United States (%)
Residents speaking other language at home - Native, born elsewhere (%)
Residents speaking other language at home - Foreign born (%)
Marital status - Never married (%)
Marital status - Now married (%)
Marital status - Separated (%)
Marital status - Widowed (%)
Marital status - Divorced (%)
Ancestries Reported - Arab (%)
Ancestries Reported - Czech (%)
Ancestries Reported - Danish (%)
Ancestries Reported - Dutch (%)
Ancestries Reported - English (%)
Ancestries Reported - French (%)
Ancestries Reported - French Canadian (%)
Ancestries Reported - German (%)
Ancestries Reported - Greek (%)
Ancestries Reported - Hungarian (%)
Ancestries Reported - Irish (%)
Ancestries Reported - Italian (%)
Ancestries Reported - Lithuanian (%)
Ancestries Reported - Norwegian (%)
Ancestries Reported - Polish (%)
Ancestries Reported - Portuguese (%)
Ancestries Reported - Russian (%)
Ancestries Reported - Scotch-Irish (%)
Ancestries Reported - Scottish (%)
Ancestries Reported - Slovak (%)
Ancestries Reported - Subsaharan African (%)
Ancestries Reported - Swedish (%)
Ancestries Reported - Swiss (%)
Ancestries Reported - Ukrainian (%)
Ancestries Reported - United States (%)
Ancestries Reported - Welsh (%)
Ancestries Reported - West Indian (%)
Ancestries Reported - Other (%)
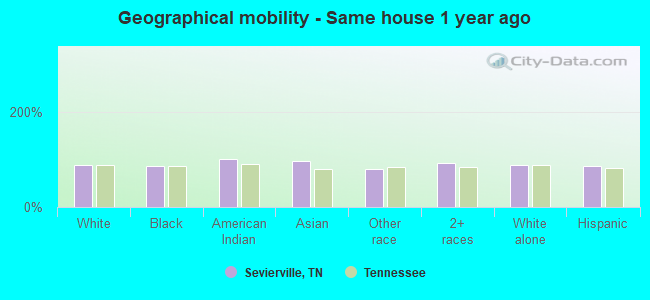
Geographical mobility - Same house 1 year ago (%)
Geographical mobility - Same house 1 year ago (%) - White
Geographical mobility - Same house 1 year ago (%) - Black or African American
Geographical mobility - Same house 1 year ago (%) - Asian
Geographical mobility - Same house 1 year ago (%) - Hispanic or Latino
Geographical mobility - Same house 1 year ago (%) - American Indian and Alaska Native
Geographical mobility - Same house 1 year ago (%) - Multirace
Geographical mobility - Same house 1 year ago (%) - Other Race
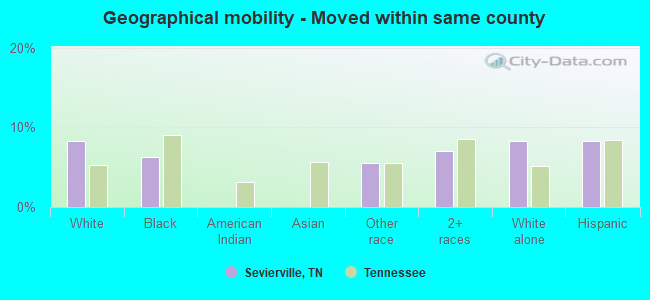
Geographical mobility - Moved within same county (%)
Geographical mobility - Moved within same county (%) - White
Geographical mobility - Moved within same county (%) - Black or African American
Geographical mobility - Moved within same county (%) - Asian
Geographical mobility - Moved within same county (%) - Hispanic or Latino
Geographical mobility - Moved within same county (%) - American Indian and Alaska Native
Geographical mobility - Moved within same county (%) - Multirace
Geographical mobility - Moved within same county (%) - Other Race
Geographical mobility - Moved from different county within same state (%)
Geographical mobility - Moved from different county within same state (%) - White
Geographical mobility - Moved from different county within same state (%) - Black or African American
Geographical mobility - Moved from different county within same state (%) - Asian
Geographical mobility - Moved from different county within same state (%) - Hispanic or Latino
Geographical mobility - Moved from different county within same state (%) - American Indian and Alaska Native
Geographical mobility - Moved from different county within same state (%) - Multirace
Geographical mobility - Moved from different county within same state (%) - Other Race
Geographical mobility - Moved from different state (%)
Geographical mobility - Moved from different state (%) - White
Geographical mobility - Moved from different state (%) - Black or African American
Geographical mobility - Moved from different state (%) - Asian
Geographical mobility - Moved from different state (%) - Hispanic or Latino
Geographical mobility - Moved from different state (%) - American Indian and Alaska Native
Geographical mobility - Moved from different state (%) - Multirace
Geographical mobility - Moved from different state (%) - Other Race
Geographical mobility - Moved from abroad (%)
Geographical mobility - Moved from abroad (%) - White
Geographical mobility - Moved from abroad (%) - Black or African American
Geographical mobility - Moved from abroad (%) - Asian
Geographical mobility - Moved from abroad (%) - Hispanic or Latino
Geographical mobility - Moved from abroad (%) - American Indian and Alaska Native
Geographical mobility - Moved from abroad (%) - Multirace
Geographical mobility - Moved from abroad (%) - Other Race
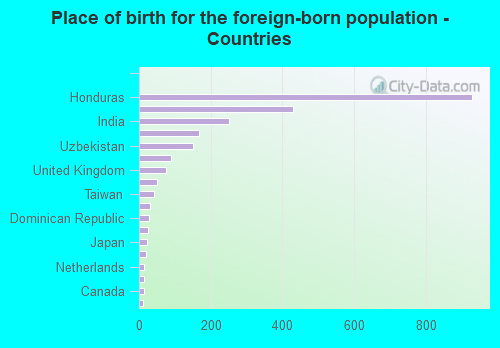
Place of birth for the foreign-born population - Ireland (%)
Place of birth for the foreign-born population - Denmark (%)
Place of birth for the foreign-born population - Norway (%)
Place of birth for the foreign-born population - Sweden (%)
Place of birth for the foreign-born population - United Kingdom (%)
Place of birth for the foreign-born population - England (%)
Place of birth for the foreign-born population - Scotland (%)
Place of birth for the foreign-born population - Other Northern Europe (%)
Place of birth for the foreign-born population - Austria (%)
Place of birth for the foreign-born population - Belgium (%)
Place of birth for the foreign-born population - France (%)
Place of birth for the foreign-born population - Germany (%)
Place of birth for the foreign-born population - Netherlands (%)
Place of birth for the foreign-born population - Switzerland (%)
Place of birth for the foreign-born population - Other Western Europe (%)
Place of birth for the foreign-born population - Greece (%)
Place of birth for the foreign-born population - Italy (%)
Place of birth for the foreign-born population - Portugal (%)
Place of birth for the foreign-born population - Spain (%)
Place of birth for the foreign-born population - Other Southern Europe (%)
Place of birth for the foreign-born population - Albania (%)
Place of birth for the foreign-born population - Belarus (%)
Place of birth for the foreign-born population - Bosnia and Herzegovina (%)
Place of birth for the foreign-born population - Bulgaria (%)
Place of birth for the foreign-born population - Croatia (%)
Place of birth for the foreign-born population - Czechoslovakia (%)
Place of birth for the foreign-born population - Hungary (%)
Place of birth for the foreign-born population - Latvia (%)
Place of birth for the foreign-born population - Lithuania (%)
Place of birth for the foreign-born population - North Macedonia (Macedonia) (%)
Place of birth for the foreign-born population - Moldova (%)
Place of birth for the foreign-born population - Poland (%)
Place of birth for the foreign-born population - Romania (%)
Place of birth for the foreign-born population - Russia (%)
Place of birth for the foreign-born population - Serbia (%)
Place of birth for the foreign-born population - Ukraine (%)
Place of birth for the foreign-born population - Other Eastern Europe (%)
Place of birth for the foreign-born population - China (%)
Place of birth for the foreign-born population - Hong Kong (%)
Place of birth for the foreign-born population - Taiwan (%)
Place of birth for the foreign-born population - Japan (%)
Place of birth for the foreign-born population - Korea (%)
Place of birth for the foreign-born population - Other Eastern Asia (%)
Place of birth for the foreign-born population - Afghanistan (%)
Place of birth for the foreign-born population - Bangladesh (%)
Place of birth for the foreign-born population - India (%)
Place of birth for the foreign-born population - Iran (%)
Place of birth for the foreign-born population - Kazakhstan (%)
Place of birth for the foreign-born population - Nepal (%)
Place of birth for the foreign-born population - Pakistan (%)
Place of birth for the foreign-born population - Sri Lanka (%)
Place of birth for the foreign-born population - Uzbekistan (%)
Place of birth for the foreign-born population - Other South Central Asia (%)
Place of birth for the foreign-born population - Burma (%)
Place of birth for the foreign-born population - Cambodia (%)
Place of birth for the foreign-born population - Indonesia (%)
Place of birth for the foreign-born population - Laos (%)
Place of birth for the foreign-born population - Malaysia (%)
Place of birth for the foreign-born population - Philippines (%)
Place of birth for the foreign-born population - Singapore (%)
Place of birth for the foreign-born population - Thailand (%)
Place of birth for the foreign-born population - Vietnam (%)
Place of birth for the foreign-born population - Other South Eastern Asia (%)
Place of birth for the foreign-born population - Armenia (%)
Place of birth for the foreign-born population - Iraq (%)
Place of birth for the foreign-born population - Israel (%)
Place of birth for the foreign-born population - Jordan (%)
Place of birth for the foreign-born population - Kuwait (%)
Place of birth for the foreign-born population - Lebanon (%)
Place of birth for the foreign-born population - Saudi Arabia (%)
Place of birth for the foreign-born population - Syria (%)
Place of birth for the foreign-born population - Turkey (%)
Place of birth for the foreign-born population - Yemen (%)
Place of birth for the foreign-born population - Other Western Asia (%)
Place of birth for the foreign-born population - Eritrea (%)
Place of birth for the foreign-born population - Ethiopia (%)
Place of birth for the foreign-born population - Kenya (%)
Place of birth for the foreign-born population - Somalia (%)
Place of birth for the foreign-born population - Uganda (%)
Place of birth for the foreign-born population - Zimbabwe (%)
Place of birth for the foreign-born population - Other Eastern Africa (%)
Place of birth for the foreign-born population - Cameroon (%)
Place of birth for the foreign-born population - Congo (%)
Place of birth for the foreign-born population - Democratic Republic of Congo (Zaire) (%)
Place of birth for the foreign-born population - Other Middle Africa (%)
Place of birth for the foreign-born population - Egypt (%)
Place of birth for the foreign-born population - Morocco (%)
Place of birth for the foreign-born population - Sudan (%)
Place of birth for the foreign-born population - Other Northern Africa (%)
Place of birth for the foreign-born population - South Africa (%)
Place of birth for the foreign-born population - Other Southern Africa (%)
Place of birth for the foreign-born population - Cabo Verde (%)
Place of birth for the foreign-born population - Ghana (%)
Place of birth for the foreign-born population - Liberia (%)
Place of birth for the foreign-born population - Nigeria (%)
Place of birth for the foreign-born population - Senegal (%)
Place of birth for the foreign-born population - Sierra Leone (%)
Place of birth for the foreign-born population - Other Western Africa (%)
Place of birth for the foreign-born population - Australia (%)
Place of birth for the foreign-born population - New Zealand (%)
Place of birth for the foreign-born population - Fiji (%)
Place of birth for the foreign-born population - Micronesia (%)
Place of birth for the foreign-born population - Bahamas (%)
Place of birth for the foreign-born population - Barbados (%)
Place of birth for the foreign-born population - Cuba (%)
Place of birth for the foreign-born population - Dominica (%)
Place of birth for the foreign-born population - Dominican Republic (%)
Place of birth for the foreign-born population - Grenada (%)
Place of birth for the foreign-born population - Haiti (%)
Place of birth for the foreign-born population - Jamaica (%)
Place of birth for the foreign-born population - St. Vincent and the Grenadines (%)
Place of birth for the foreign-born population - Trinidad and Tobago (%)
Place of birth for the foreign-born population - West Indies (%)
Place of birth for the foreign-born population - Other Caribbean (%)
Place of birth for the foreign-born population - Belize (%)
Place of birth for the foreign-born population - Costa Rica (%)
Place of birth for the foreign-born population - El Salvador (%)
Place of birth for the foreign-born population - Guatemala (%)
Place of birth for the foreign-born population - Honduras (%)
Place of birth for the foreign-born population - Mexico (%)
Place of birth for the foreign-born population - Nicaragua (%)
Place of birth for the foreign-born population - Panama (%)
Place of birth for the foreign-born population - Other Central America (%)
Place of birth for the foreign-born population - Argentina (%)
Place of birth for the foreign-born population - Bolivia (%)
Place of birth for the foreign-born population - Brazil (%)
Place of birth for the foreign-born population - Chile (%)
Place of birth for the foreign-born population - Colombia (%)
Place of birth for the foreign-born population - Ecuador (%)
Place of birth for the foreign-born population - Guyana (%)
Place of birth for the foreign-born population - Peru (%)
Place of birth for the foreign-born population - Uruguay (%)
Place of birth for the foreign-born population - Venezuela (%)
Place of birth for the foreign-born population - Other South America (%)
Place of birth for the foreign-born population - Canada (%)
Place of birth for the foreign-born population - Other Northern America (%)
Place of birth for the foreign-born population - Other (%)
Latest news about races in Sevierville, TN collected exclusively by city-data.com from local newspapers, TV, and radio stations
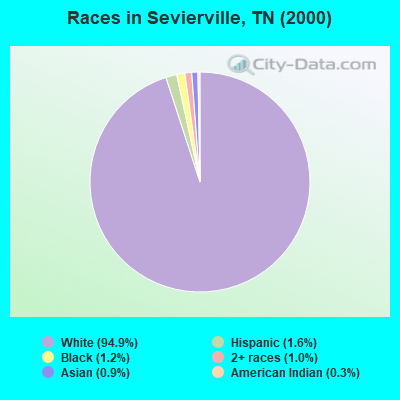
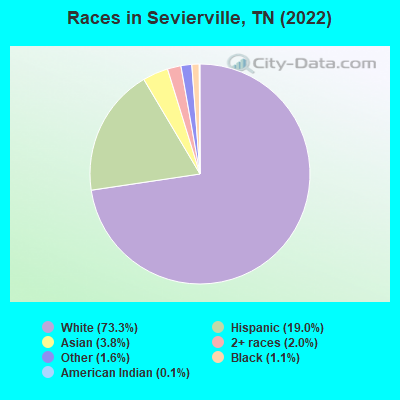
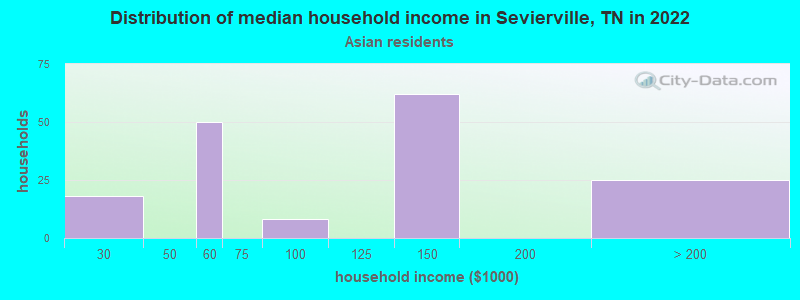
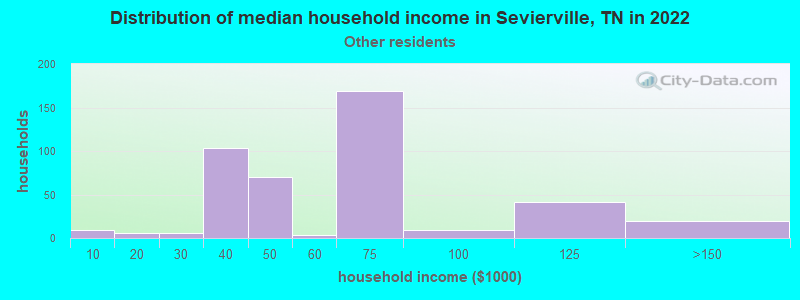
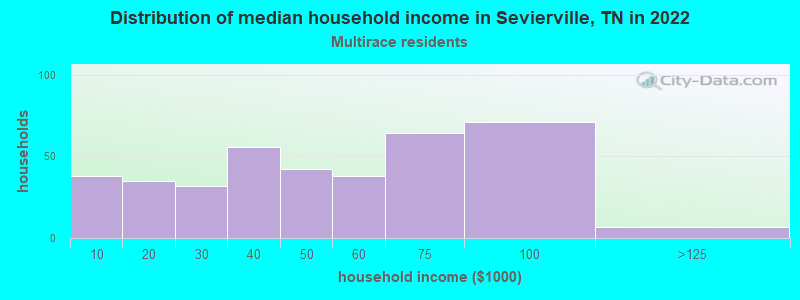
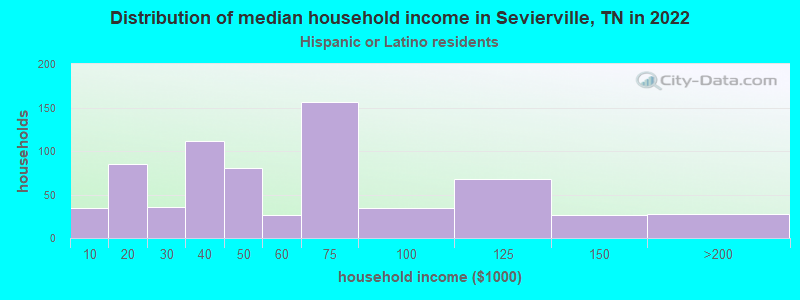
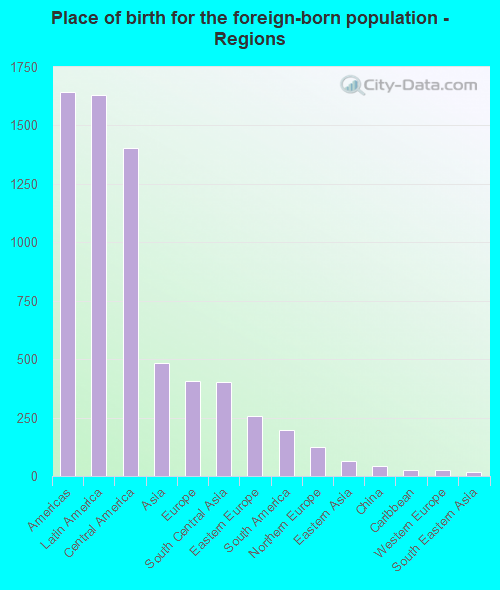
According to 2022 data, the most numerous races in Sevierville, TN are White alone (13,419 residents), Black alone (204 residents), and Hispanic (3,477 residents). 80.6% of Sevierville residents speak English at home. 14.1% of Sevierville, TN residents are foreign-born (8.7% born in Latin America, 2.6% born in Asia, 2.2% born in Europe), which is 64.4% greater than the foreign-born rate of 5.0% across the entire state of Tennessee.
Race distribution in Sevierville
2000 2022
4,505,930 79.2% White alone 928,204 16.3% Black alone 123,838 2.2% Hispanic 54,824 1.0% Two or more races 56,077 1.0% Asian alone 13,820 0.2% American Indian alone 4,780 0.08% Other race alone 1,810 0.03% Native Hawaiian and Other
5,070,026 71.9% White alone 1,089,738 15.5% Black alone 442,629 6.3% Hispanic 279,381 4.0% Two or more races 131,817 1.9% Asian alone 26,972 0.4% Other race alone 6,387 0.09% American Indian alone 4,389 0.06% Native Hawaiian and Other
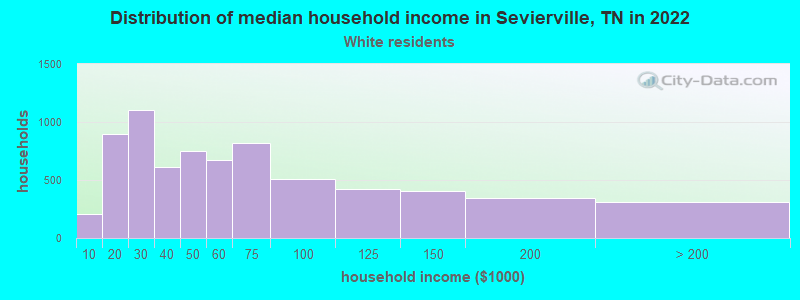
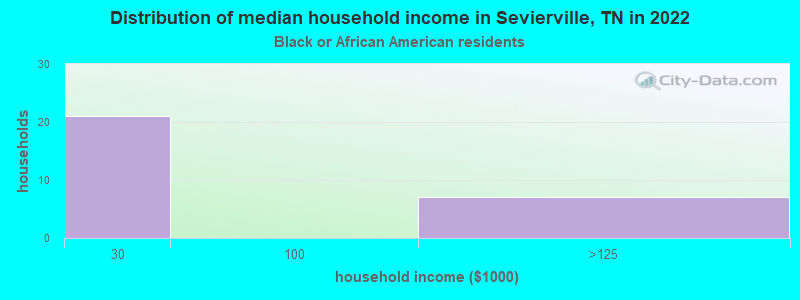
Income and house value in Sevierville Median household income in 2022 $47,085 White non-Hispanic householders$128,961 Asian householders$63,711 Some other race householders$42,418 Two or more races householders$55,488 Hispanic or Latino race householdersMedian 2022 house value $373,799 White Non-Hispanic householders$171,324 Black or African American householders $428,311 Asian householders$506,186 Two or more races householders
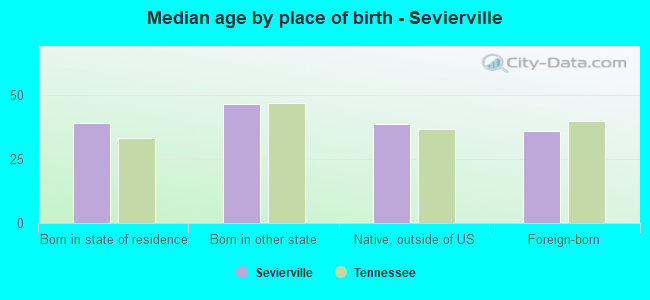
Median age by race in Sevierville
45.2 Median age for White residents42.5 47.0 89.9 Median age for Black or African American residents33.0 99.9 -557,471,263.8 Median age for American Indian / Alaska Native residents-633,911,367.4 -667,936,507.3 39.9 Median age for Asian residents46.1 36.4 -666,666,666.0 Median age for Native Hawaiian / Pacific Islander residents-666,666,666.0 -666,666,666.0 21.4 Median age for Other race residents12.8 33.1 28.3 Median age for Two or more races residents24.9 23.4 47.1 Median age for White alone residents45.4 49.2 17.8 Median age for Hispanic or Latino residents15.7 21.5
Owner/renter occupied households by race in Sevierville
House owners and renters - White residents 3,724 51.4% Owner occupied3,515 48.6% Renter occupiedHouse owners and renters - Black or African American residents 29 100.0% Renter occupiedHouse owners and renters - Asian residents 36 23.4% Owner occupied118 76.6% Renter occupiedHouse owners and renters - Other race residents 219 41.9% Owner occupied303 58.1% Renter occupiedHouse owners and renters - Two or more races residents 87 17.1% Owner occupied419 82.9% Renter occupiedHouse owners and renters - White alone residents 3,701 51.7% Owner occupied3,454 48.3% Renter occupiedHouse owners and renters - Hispanic or Latino residents 223 30.8% Owner occupied501 69.2% Renter occupied
Language usage in Sevierville
English speakers - Total 80.6% of residents of Sevierville speak English at home.
17.6% of residents speak Spanish at home 1,671 55.8% Speak English very well1,326 44.2% Speak English less than very well3.7% of residents speak other language at home 397 63.5% Speak English very well228 36.5% Speak English less than very well
English speakers - Born in the United States 96.3% of residents of Sevierville speak English at home.
3.9% of residents speak Spanish at home 247 100.0% Speak English very well0.6% of residents speak other language at home 36 87.8% Speak English very well5 12.2% Speak English less than very well
English speakers - Native, born elsewhere 11.4% of residents of Sevierville speak English at home.
117.5% of residents speak Spanish at home 18 13.4% Speak English very well116 86.6% Speak English less than very well
English speakers - Foreign-born 9.9% of residents of Sevierville speak English at home.
77.4% of residents speak Spanish at home 829 37.8% Speak English very well1,367 62.2% Speak English less than very well16.7% of residents speak other language at home 253 53.4% Speak English very well221 46.6% Speak English less than very well
White (Caucasian) - Speak only English Native:
97.6% (12,478)Foreign-born:
24.6% (138)
White (Caucasian) - Speak another language Native:
2.1% (271)Foreign-born:
74.9% (420)
Asian - Speak only English Native:
4.4% (6)Foreign-born:
36.7% (168)
Asian - Speak another language Native:
98.7% (143)Foreign-born:
63.1% (289)
Other race - Speak only English Native:
29.9% (191)Foreign-born:
0.9% (14)
Other race - Speak another language Native:
67.8% (433)Foreign-born:
99.2% (1,515)
Two or more races - Speak only English Native:
55.5% (393)Foreign-born:
4.9% (21)
Two or more races - Speak another language Native:
27.8% (197)Foreign-born:
94.1% (407)
White alone - Speak only English Native:
98.8% (12,351)Foreign-born:
45.4% (119)
White alone - Speak another language Native:
1.2% (147)Foreign-born:
54.7% (144)
Hispanic or Latino - Speak only English Native:
22.7% (171)Foreign-born:
1.4% (32)
Hispanic or Latino - Speak another language Native:
78.9% (595)Foreign-born:
98.8% (2,208)
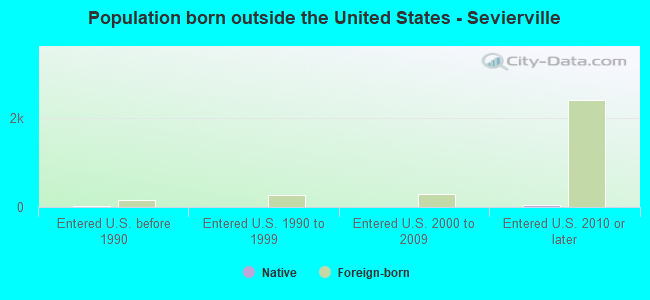
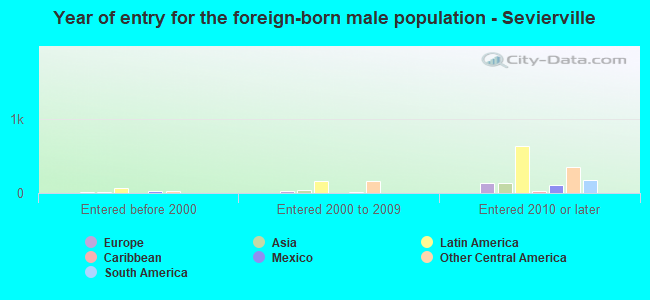
Foreign-born residents in Sevierville 2,536 residents are foreign born (8.7% Latin America , 2.6% Asia , 2.2% Europe ).
This city:
14.1%Tennessee:
5.4%
Marital status for residents in Sevierville Marital status - White (Caucasian) population 15 years and over
Males 32.7% Never married49.5% Now married1.5% Separated3.5% Widowed12.8% DivorcedFemales 18.6% Never married44.6% Now married3.0% Separated17.8% Widowed15.9% DivorcedWomen who gave birth in the past 12 months Now married:
49.8% (148)Unmarried:
50.2% (149)
Women who did not give birth in the past 12 months Now married:
38.2% (1,054)Unmarried:
61.8% (1,708)
Marital status - Black or African American population 15 years and over
Males 58.2% Never married6.1% Now married0.0% Separated7.1% Widowed28.6% DivorcedFemales 16.1% Never married57.1% Now married0.0% Separated0.0% Widowed26.8% DivorcedWomen who did not give birth in the past 12 months Now married:
85.3% (62)Unmarried:
14.7% (11)
Marital status - Asian population 15 years and over
Males 8.7% Never married91.3% Now married0.0% Separated0.0% Widowed0.0% DivorcedFemales 0.0% Never married74.2% Now married0.0% Separated25.8% Widowed0.0% DivorcedWomen who gave birth in the past 12 months Now married:
100.0% (31)Unmarried:
0.0% (0)
Women who did not give birth in the past 12 months Now married:
53.8% (58)Unmarried:
46.2% (50)
Marital status - Other race population 15 years and over
Males 35.0% Never married65.0% Now married0.0% Separated0.0% Widowed0.0% DivorcedFemales 60.1% Never married30.8% Now married1.5% Separated4.6% Widowed3.0% DivorcedWomen who did not give birth in the past 12 months Now married:
27.5% (220)Unmarried:
72.5% (579)
Marital status - Two or more races population 15 years and over
Males 53.4% Never married40.7% Now married2.1% Separated0.0% Widowed3.8% DivorcedFemales 53.1% Never married33.4% Now married1.4% Separated0.0% Widowed12.0% DivorcedWomen who gave birth in the past 12 months Now married:
0.0% (0)Unmarried:
100.0% (40)
Women who did not give birth in the past 12 months Now married:
31.9% (132)Unmarried:
68.1% (283)
Marital status - White alone, not Hispanic / Latino population 15 years and over
Males 30.7% Never married50.2% Now married1.7% Separated3.7% Widowed13.7% DivorcedFemales 17.4% Never married44.6% Now married3.1% Separated18.5% Widowed16.4% DivorcedWomen who gave birth in the past 12 months Now married:
46.5% (122)Unmarried:
53.5% (140)
Women who did not give birth in the past 12 months Now married:
38.2% (1,005)Unmarried:
61.8% (1,627)
Marital status - Hispanic or Latino population 15 years and over
Males 48.6% Never married49.9% Now married0.5% Separated0.0% Widowed0.9% DivorcedFemales 47.1% Never married41.5% Now married1.6% Separated3.3% Widowed6.5% DivorcedWomen who gave birth in the past 12 months Now married:
43.3% (38)Unmarried:
56.7% (49)
Women who did not give birth in the past 12 months Now married:
39.8% (384)Unmarried:
60.2% (580)
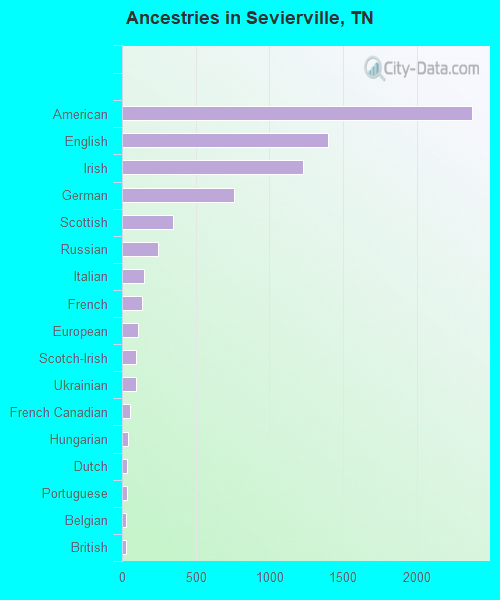
Ancestries in Sevierville
2,373 22.3% American1,400 13.2% English1,226 11.5% Irish759 7.1% German349 3.3% Scottish245 2.3% Russian152 1.4% Italian133 1.2% French110 1.0% European98 0.9% Scotch-Irish96 0.9% Ukrainian51 0.5% French Canadian38 0.4% Hungarian33 0.3% Dutch32 0.3% Portuguese30 0.3% Belgian27 0.3% British17 0.2% Norwegian15 0.1% Welsh13 0.1% Danish11 0.1% Greek3 0.03% Finnish
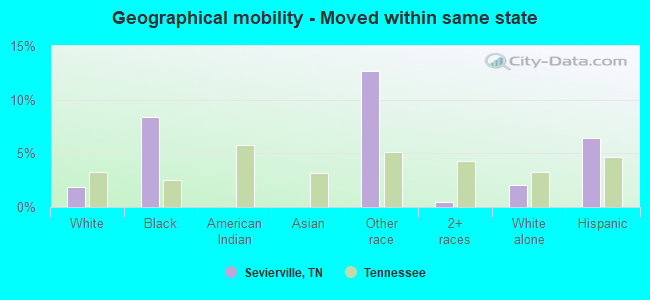
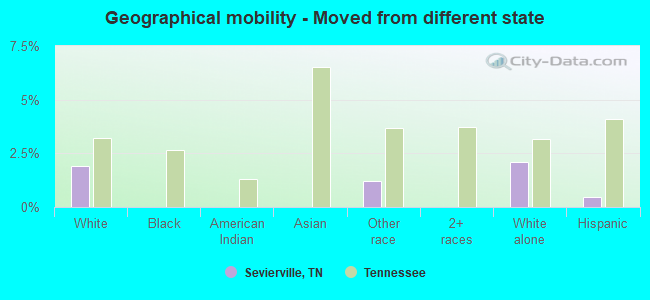
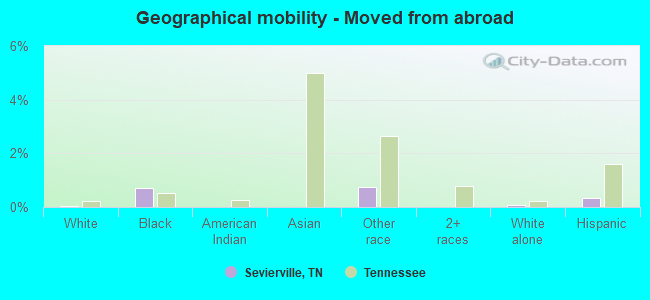
Geographical mobility in Sevierville Same house 1 year ago 12,419 88.1% White (Caucasian)174 84.7% Black or African American34 100.0% American Indian / Alaska Native652 97.3% Asian1,500 80.4% Other race1,303 92.3% Two or more races11,586 87.8% White alone, not Hispanic / Latino2,872 84.7% Hispanic or LatinoMoved within same county 1,174 8.3% White / Caucasian13 6.2% Black or African American102 5.5% Other race99 7.0% Two or more races1,088 8.2% White alone, not Hispanic / Latino282 8.3% Hispanic or LatinoMoved within same state 267 1.9% White / Caucasian17 8.4% Black or African American236 12.7% Other race6 0.5% Two or more races266 2.0% White alone, not Hispanic / Latino217 6.4% Hispanic or LatinoMoved from different state 272 1.9% White / Caucasian22 1.2% Other race274 2.1% White alone, not Hispanic / Latino16 0.5% Hispanic or LatinoMoved from abroad 3 0.0% White1 0.7% Black or African American14 0.8% Other race8 0.1% White alone, not Hispanic / Latino11 0.3% Hispanic or Latino
Children Nativity (place of birth) in Sevierville
Children under 6 years - Living with two parents Both parents native 159 100.0% NativeBoth parents foreign-born 449 100.0% NativeOne native, one foreign-born parent 110 100.0% NativeChildren under 6 years - Living with one parent Native parent 25 100.0% NativeForeign-born parent 216 100.0% NativeChildren 6 to 17 years - Living with two parents Both parents native 683 100.0% NativeBoth parents foreign-born 228 25.9% Native654 74.1% Foreign-bornOne native, one foreign-born parent 4 100.0% NativeChildren 6 to 17 years - Living with one parent Native parent 316 100.0% NativeForeign-born parent 247 50.4% Native243 49.6% Foreign-born
Grandparents responsible for own grandchildren in Sevierville
Grandparents (30 to 59 years) White / Caucasian 25 100.0% Responsible for grandchildrenOther race 33 100.0% Not responsible for grandchildrenWhite alone, not Hispanic / Latino 25 100.0% Responsible for grandchildrenHispanic or Latino 30 100.0% Not responsible for grandchildrenGrandparents (60 years and over) White / Caucasian 5 7.2% Responsible for grandchildren62 92.8% Not responsible for grandchildrenWhite alone, not Hispanic / Latino 5 7.3% Responsible for grandchildren62 92.7% Not responsible for grandchildren