Salt Lake City, UT (Utah) Houses and Residents
Estimated median house or condo value in 2022: $563,300 (it was $152,400 in 2000 )
Salt Lake City:
$563,300Utah:
$499,500
Lower value quartile - upper value quartile: $400,100 - $795,100Mean price in 2022: Detached houses: $735,843 Here:
$735,843State:
$607,750
Townhouses or other attached units: $482,286 Here:
$482,286State:
$444,505
In 2-unit structures: $528,524 Here:
$528,524State:
$433,540
In 3-to-4-unit structures: $1,116,306 Here:
$1,116,306State:
$362,850
In 5-or-more-unit structures: $517,403 Here:
$517,403State:
$412,810
Mobile homes: $143,744 Here:
$143,744State:
$113,475
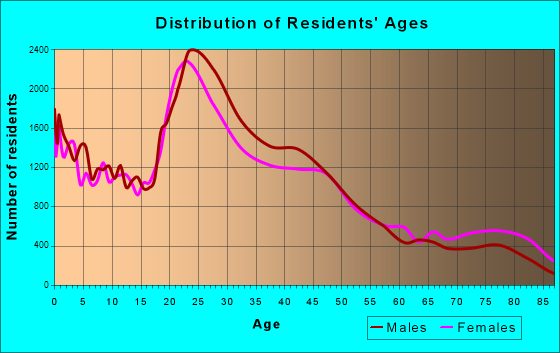
Total population: 190,884 (Urban population: 179,663, Rural population: 1,793 (11 farm, 1,782 nonfarm ))
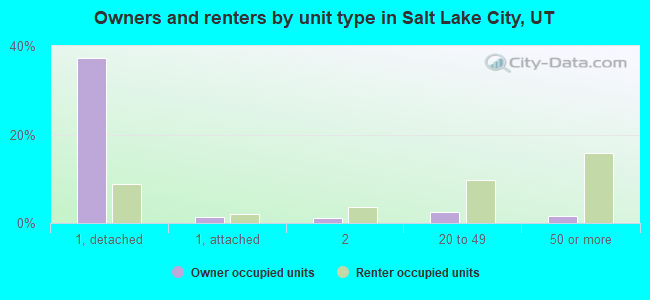
Houses: 98,206 (90,195 occupied: 40,845 owner occupied, 49,350 renter occupied )
% of renters here:
55%State:
29%
Housing density: 900 houses/condos per square mile
Median price asked for vacant for-sale houses and condos in 2022: $873,251.
Median contract rent in 2022: $1,256 (lower quartile is $933, upper quartile is $1,637)
Median rent asked for vacant for-rent units in 2022: $1,934
Median gross rent in Salt Lake City, UT in 2022: $1,316
Housing units in Salt Lake City with a mortgage: 27,441 (2,871 second mortgage, 193 home equity loan, 2,370 both second mortgage and home equity loan )Houses without a mortgage: 1,219
Median household income for houses/condos with a mortgage: $127,949
Median household income for apartments without a mortgage: $69,595
Median monthly housing costs: $1,362
Data:
Median house or condo value ($)
Median house or condo value ($ change since 2000)
Median house or condo value ($) - White
Median house or condo value ($) - Black or African American
Median house or condo value ($) - Asian
Median house or condo value ($) - Hispanic or Latino
Median house or condo value ($) - American Indian and Alaska Native
Median house or condo value ($) - Multirace
Median house or condo value ($) - Other Race
Median price asked for mobile homes ($)
Household density (households per square mile)
Mean house or condo value by units in structure - 1, detached ($)
Mean house or condo value by units in structure - 1, attached ($)
Mean house or condo value by units in structure - 2 ($)
Mean house or condo value by units in structure by units in structure - 3 or 4 ($)
Mean house or condo value by units in structure - 5 or more ($)
Mean house or condo value by units in structure - Boat, RV, van, etc. ($)
Mean house or condo value by units in structure - Mobile home ($)
Median contract rent ($)
Median contract rent - Lower quartile ($)
Median contract rent - Upper quartile ($)
Median gross rent ($)
Urban houses (%)
Rural houses (%)
Houses occupied (%)
Houses occupied (% change since 2000)
Houses owner occupied (%)
Houses owner occupied (% change since 2000)
Houses renter occupied (%)
Houses renter occupied (% change since 2000)
Vacant housing units - For rent (%)
Vacant housing units - For rent (% change since 2000)
Vacant housing units - For sale only (%)
Vacant housing units - For sale only (% change since 2000)
Vacant housing units - Rented or sold, not occupied (%)
Vacant housing units - Rented or sold, not occupied (% change since 2000)
Vacant housing units - For seasonal, recreational, or occasional use (%)
Vacant housing units - For seasonal, recreational, or occasional use (% change since 2000)
Vacant housing units - For migrant workers (%)
Vacant housing units - For migrant workers (% change since 2000)
Vacant housing units - Other vacant (%)
Vacant housing units - Other vacant (% change since 2000)
Median monthly housing costs ($)
Median household income for houses/condos with a mortgage ($)
Median household income for houses/condos without a mortgage ($)
Median household income ($)
Median household income ($) - White
Median household income ($) - Black or African American
Median household income ($) - Asian
Median household income ($) - Hispanic or Latino
Median household income ($) - American Indian and Alaska Native
Median household income ($) - Multirace
Median household income ($) - Other Race
Mortgage status - with mortgage (%)
Mortgage status - with second mortgage (%)
Mortgage status - with home equity loan (%)
Mortgage status - with both second mortgage and home equity loan (%)
Mortgage status - without a mortgage (%)
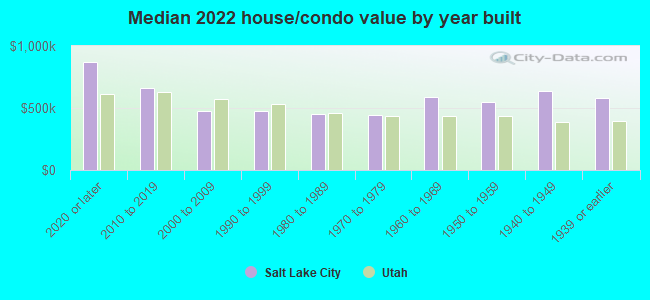
Median year house/condo built
Median year apartment built
Household type by relationship - Male householder living alone (%)
Household type by relationship - Male householder not living alone (%)
Household type by relationship - Female householder living alone (%)
Household type by relationship - Female householder not living alone (%)
Household type by relationship - Opposite-Sex spouse (%)
Household type by relationship - Same-Sex spouse (%)
Household type by relationship - Opposite-Sex unmarried partner (%)
Household type by relationship - Same-Sex unmarried partner (%)
Household type by relationship - In group quarters (%)
Size of family households - 2-person household (%)
Size of family households - 3-person household (%)
Size of family households - 4-person household (%)
Size of family households - 5-person household (%)
Size of family households - 6-person household (%)
Size of family households - 7-or-more-person household (%)
Size of nonfamily households - 1-person household (%)
Size of nonfamily households - 2-person household (%)
Size of nonfamily households - 3-person household (%)
Size of nonfamily households - 4-person household (%)
Size of nonfamily households - 5-person household (%)
Size of nonfamily households - 6-person household (%)
Size of nonfamily households - 7-or-moreperson household (%)
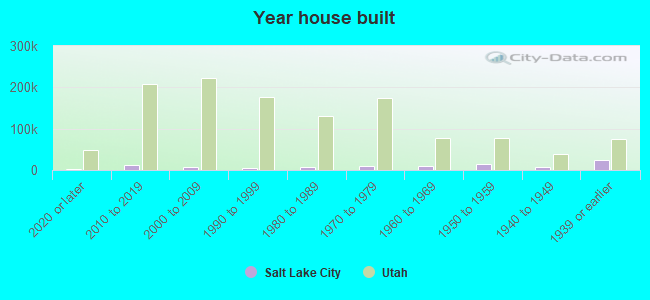
Year house built - Built 2010 or later (%)
Year house built - Built 2000 to 2009 (%)
Year house built - Built 1990 to 1999 (%)
Year house built - Built 1980 to 1989 (%)
Year house built - Built 1970 to 1979 (%)
Year house built - Built 1960 to 1969 (%)
Year house built - Built 1950 to 1959 (%)
Year house built - Built 1940 to 1949 (%)
Year house built - Built 1939 or earlier (%)
Median number of rooms in houses and condos
Median number of rooms in apartments
Median number of bedrooms in owner occupied houses
Mean number of bedrooms in owner occupied houses
Median number of bedrooms in renter occupied houses
Mean number of bedrooms in renter occupied houses
Median number of vehichles in owner occupied houses
Mean number of vehichles in owner occupied houses
Median number of vehichles in renter occupied houses
Mean number of vehichles in renter occupied houses
Rooms in owner-occupied houses - 1 room (%)
Rooms in owner-occupied houses - 2 rooms (%)
Rooms in owner-occupied houses - 3 rooms (%)
Rooms in owner-occupied houses - 4 rooms (%)
Rooms in owner-occupied houses - 5 rooms (%)
Rooms in owner-occupied houses - 6 rooms (%)
Rooms in owner-occupied houses - 7 rooms (%)
Rooms in owner-occupied houses - 8 rooms (%)
Rooms in owner-occupied houses - 9+ rooms (%)
Rooms in renter-occupied houses - 1 room (%)
Rooms in renter-occupied houses - 2 rooms (%)
Rooms in renter-occupied houses - 3 rooms (%)
Rooms in renter-occupied houses - 4 rooms (%)
Rooms in renter-occupied houses - 5 rooms (%)
Rooms in renter-occupied houses - 6 rooms (%)
Rooms in renter-occupied houses - 7 rooms (%)
Rooms in renter-occupied houses - 8 rooms (%)
Rooms in renter-occupied houses - 9+ rooms (%)
Bedrooms in owner-occupied houses - no bedrooms (%)
Bedrooms in owner-occupied houses - 1 bedroom (%)
Bedrooms in owner-occupied houses - 2 bedrooms (%)
Bedrooms in owner-occupied houses - 3 bedrooms (%)
Bedrooms in owner-occupied houses - 4 bedrooms (%)
Bedrooms in owner-occupied houses - 5+ bedrooms (%)
Bedrooms in renter-occupied houses - no bedrooms (%)
Bedrooms in renter-occupied houses - 1 bedroom (%)
Bedrooms in renter-occupied houses - 2 bedrooms (%)
Bedrooms in renter-occupied houses - 3 bedrooms (%)
Bedrooms in renter-occupied houses - 4 bedrooms (%)
Bedrooms in renter-occupied houses - 5+ bedrooms (%)
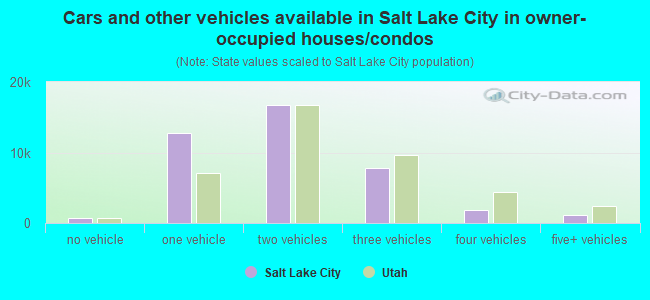
Vehicles available in owner-occupied houses - no vehicle available (%)
Vehicles available in owner-occupied houses - 1 vehicle available(%)
Vehicles available in owner-occupied houses - 2 Vehicles available (%)
Vehicles available in owner-occupied houses - 3 Vehicles available (%)
Vehicles available in owner-occupied houses - 4 Vehicles available (%)
Vehicles available in owner-occupied houses - 5+ Vehicles available (%)
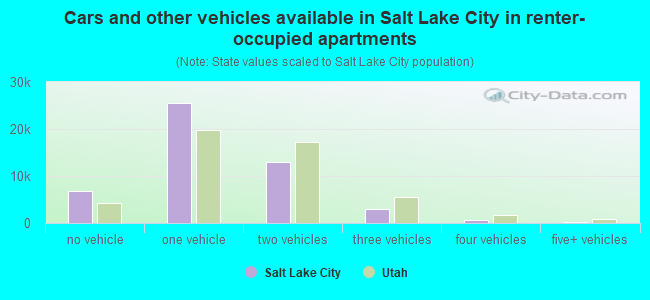
Vehicles available in renter-occupied houses - no vehicle available (%)
Vehicles available in renter-occupied houses - 1 vehicle available (%)
Vehicles available in renter-occupied houses - 2 Vehicles available (%)
Vehicles available in renter-occupied houses - 3 Vehicles available (%)
Vehicles available in renter-occupied houses - 4 Vehicles available (%)
Vehicles available in renter-occupied houses - 5+ Vehicles available (%)
Housing units in structures - 1, detached (%)
Housing units in structures - 1, attached (%)
Housing units in structures - 2 (%)
Housing units in structures - 3 or 4 (%)
Housing units in structures - 5 to 9 (%)
Housing units in structures - 10 to 19 (%)
Housing units in structures - 20 to 49 (%)
Housing units in structures - 50 or more (%)
Housing units in structures - Mobile home (%)
Housing units in structures - Boat, RV, van, etc. (%)
Housing units in structures - Owners - 1, detached (%)
Housing units in structures - Owners - 1, attached (%)
Housing units in structures - Owners - 2 (%)
Housing units in structures - Owners - 3 or 4 (%)
Housing units in structures - Owners - 5 to 9 (%)
Housing units in structures - Owners - 10 to 19 (%)
Housing units in structures - Owners - 20 to 49 (%)
Housing units in structures - Owners - 50 or more (%)
Housing units in structures - Owners - Mobile home (%)
Housing units in structures - Owners - Boat, RV, van, etc. (%)
Housing units in structures - Renters - 1, detached (%)
Housing units in structures - Renters - 1, attached (%)
Housing units in structures - Renters - 2 (%)
Housing units in structures - Renters - 3 or 4 (%)
Housing units in structures - Renters - 5 to 9 (%)
Housing units in structures - Renters - 10 to 19 (%)
Housing units in structures - Renters - 20 to 49 (%)
Housing units in structures - Renters - 50 or more (%)
Housing units in structures - Renters - Mobile home (%)
Housing units in structures - Renters - Boat, RV, van, etc. (%)
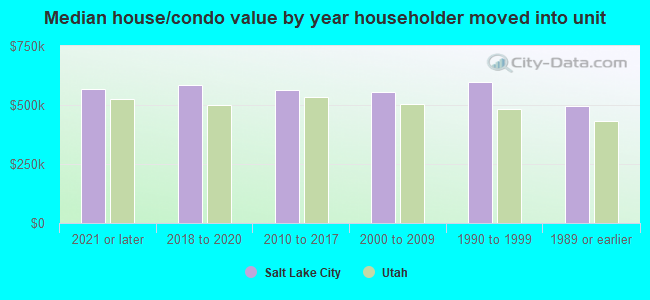
House/condo owner moved in on average (years ago)
Renter moved in on average (years ago)
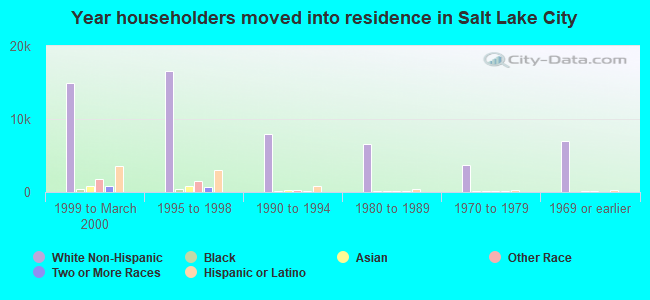
Year householder moved into unit - Moved in 1999 to March 2000 (%)
Year householder moved into unit - Moved in 1999 to March 2000 (%) - White
Year householder moved into unit - Moved in 1999 to March 2000 (%) - Black or African American
Year householder moved into unit - Moved in 1999 to March 2000 (%) - Asian
Year householder moved into unit - Moved in 1999 to March 2000 (%) - Hispanic or Latino
Year householder moved into unit - Moved in 1999 to March 2000 (%) - American Indian and Alaska Native
Year householder moved into unit - Moved in 1999 to March 2000 (%) - Multirace
Year householder moved into unit - Moved in 1999 to March 2000 (%) - Other Race
Year householder moved into unit - Moved in 1995 to 1998 (%)
Year householder moved into unit - Moved in 1995 to 1998 (%) - White
Year householder moved into unit - Moved in 1995 to 1998 (%) - Black or African American
Year householder moved into unit - Moved in 1995 to 1998 (%) - Asian
Year householder moved into unit - Moved in 1995 to 1998 (%) - Hispanic or Latino
Year householder moved into unit - Moved in 1995 to 1998 (%) - American Indian and Alaska Native
Year householder moved into unit - Moved in 1995 to 1998 (%) - Multirace
Year householder moved into unit - Moved in 1995 to 1998 (%) - Other Race
Year householder moved into unit - Moved in 1990 to 1994 (%)
Year householder moved into unit - Moved in 1990 to 1994 (%) - White
Year householder moved into unit - Moved in 1990 to 1994 (%) - Black or African American
Year householder moved into unit - Moved in 1990 to 1994 (%) - Asian
Year householder moved into unit - Moved in 1990 to 1994 (%) - Hispanic or Latino
Year householder moved into unit - Moved in 1990 to 1994 (%) - American Indian and Alaska Native
Year householder moved into unit - Moved in 1990 to 1994 (%) - Multirace
Year householder moved into unit - Moved in 1990 to 1994 (%) - Other Race
Year householder moved into unit - Moved in 1980 to 1989 (%)
Year householder moved into unit - Moved in 1980 to 1989 (%) - White
Year householder moved into unit - Moved in 1980 to 1989 (%) - Black or African American
Year householder moved into unit - Moved in 1980 to 1989 (%) - Asian
Year householder moved into unit - Moved in 1980 to 1989 (%) - Hispanic or Latino
Year householder moved into unit - Moved in 1980 to 1989 (%) - American Indian and Alaska Native
Year householder moved into unit - Moved in 1980 to 1989 (%) - Multirace
Year householder moved into unit - Moved in 1980 to 1989 (%) - Other Race
Year householder moved into unit - Moved in 1970 to 1979 (%)
Year householder moved into unit - Moved in 1970 to 1979 (%) - White
Year householder moved into unit - Moved in 1970 to 1979 (%) - Black or African American
Year householder moved into unit - Moved in 1970 to 1979 (%) - Asian
Year householder moved into unit - Moved in 1970 to 1979 (%) - Hispanic or Latino
Year householder moved into unit - Moved in 1970 to 1979 (%) - American Indian and Alaska Native
Year householder moved into unit - Moved in 1970 to 1979 (%) - Multirace
Year householder moved into unit - Moved in 1970 to 1979 (%) - Other Race
Year householder moved into unit - Moved in 1969 or earlier (%)
Year householder moved into unit - Moved in 1969 or earlier (%) - White
Year householder moved into unit - Moved in 1969 or earlier (%) - Black or African American
Year householder moved into unit - Moved in 1969 or earlier (%) - Asian
Year householder moved into unit - Moved in 1969 or earlier (%) - Hispanic or Latino
Year householder moved into unit - Moved in 1969 or earlier (%) - American Indian and Alaska Native
Year householder moved into unit - Moved in 1969 or earlier (%) - Multirace
Year householder moved into unit - Moved in 1969 or earlier (%) - Other Race
Housing units lacking complete plumbing facilities (%)
Housing units lacking complete kitchen facilities (%)
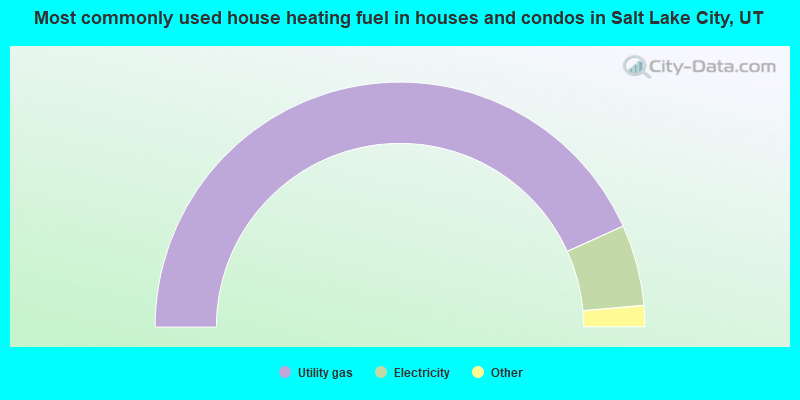
House heating fuel used in houses and condos - Utility gas (%)
House heating fuel used in houses and condos - Bottled, tank, or LP gas (%)
House heating fuel used in houses and condos - Electricity (%)
House heating fuel used in houses and condos - Fuel oil, kerosene, etc. (%)
House heating fuel used in houses and condos - Coal or coke (%)
House heating fuel used in houses and condos - Wood (%)
House heating fuel used in houses and condos - Solar energy (%)
House heating fuel used in houses and condos - Other fuel (%)
House heating fuel used in houses and condos - No fuel used (%)
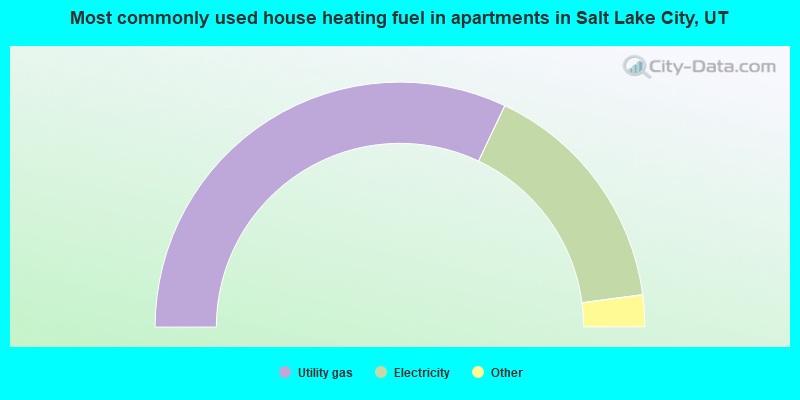
House heating fuel used in apartments - Utility gas (%)
House heating fuel used in apartments - Bottled, tank, or LP gas (%)
House heating fuel used in apartments - Electricity (%)
House heating fuel used in apartments - Fuel oil, kerosene, etc. (%)
House heating fuel used in apartments - Coal or coke (%)
House heating fuel used in apartments - Wood (%)
House heating fuel used in apartments - Solar energy (%)
House heating fuel used in apartments - Other fuel (%)
House heating fuel used in apartments - No fuel used (%)
Median year house/condo built: 1951Median year apartment built: 1976Household type by relationship:
Households: 204,653
Male householders: 46,576 (17,747 living alone ), Female householders: 43,619 (14,701 living alone )31,214 spouses (30,710 opposite-sex spouses ), 6,980 unmarried partners , (6,384 opposite-sex unmarried partners ), 34,679 children (32,413 natural , 1,492 adopted , 774 stepchildren ), 3,020 grandchildren , 4,679 brothers or sisters , 3,454 parents , 0 foster children , 3,554 other relatives , 18,210 non-relatives In group quarters: 8,668
Size of family households: 21,267 2-persons , 8,347 3-persons , 7,707 4-persons , 1,906 5-persons , 1,430 6-persons , 1,273 7-or-more-persons .
Size of nonfamily households: 32,448 1-person , 11,707 2-persons , 3,321 3-persons , 531 4-persons , 258 5-persons .
17,699 married couples with children. single-parent households (1,775 men , 5,999 women ).
75.5% of residents of Salt Lake City speak English at home. of residents speak Spanish at home (61% speak English very well , 17% speak English well , 13% speak English not well , 9% don't speak English at all ).of residents speak other Indo-European language at home (76% speak English very well , 15% speak English well , 5% speak English not well , 4% don't speak English at all ).of residents speak Asian or Pacific Island language at home (59% speak English very well , 27% speak English well , 10% speak English not well , 4% don't speak English at all ).of residents speak other language at home (71% speak English very well , 10% speak English well , 18% speak English not well ).
Foreign born population: 33,682 (16.5%)of them are naturalized citizens )
Median number of rooms in houses and condos:
Median number of rooms in apartments
Owner-occupied Renter-occupied
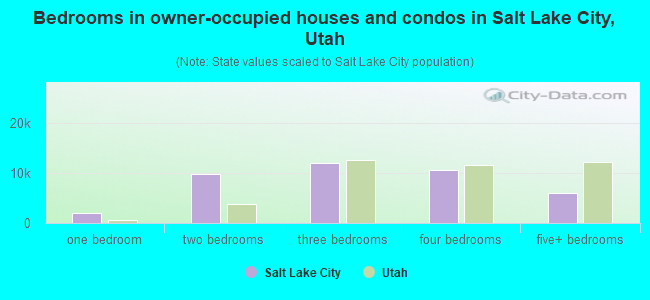
Bedrooms in owner-occupied houses and condos in Salt Lake City, Utah
96 no bedroom 2,092 1 bedroom 9,822 2 bedrooms 12,011 3 bedrooms 10,728 4 bedrooms 6,096 5+ bedrooms
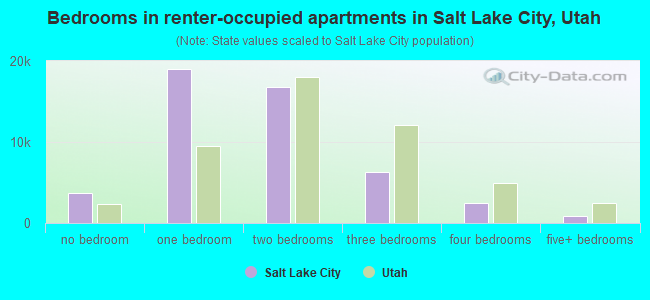
Bedrooms in renter-occupied apartments in Salt Lake City, Utah
3,762 no bedroom 18,996 1 bedroom 16,846 2 bedrooms 6,348 3 bedrooms 2,483 4 bedrooms 915 5+ bedrooms
Owner-occupied Renter-occupied
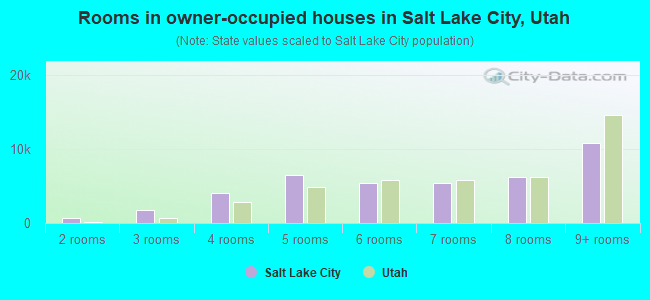
Rooms in owner-occupied houses in Salt Lake City, Utah
96 1 room 688 2 rooms 1,697 3 rooms 4,116 4 rooms 6,522 5 rooms 5,408 6 rooms 5,338 7 rooms 6,149 8 rooms 10,831 9+ rooms
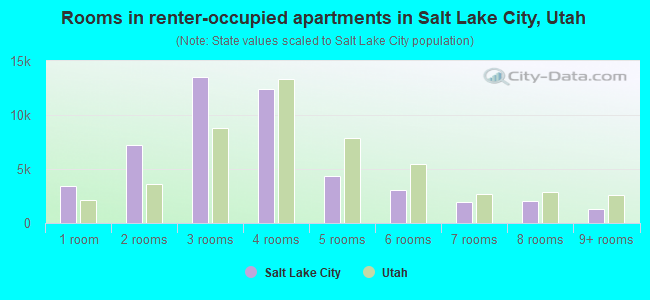
Rooms in renter-occupied apartments in Salt Lake City, Utah
3,451 1 room 7,221 2 rooms 13,528 3 rooms 12,411 4 rooms 4,391 5 rooms 3,082 6 rooms 1,934 7 rooms 2,048 8 rooms 1,284 9+ rooms
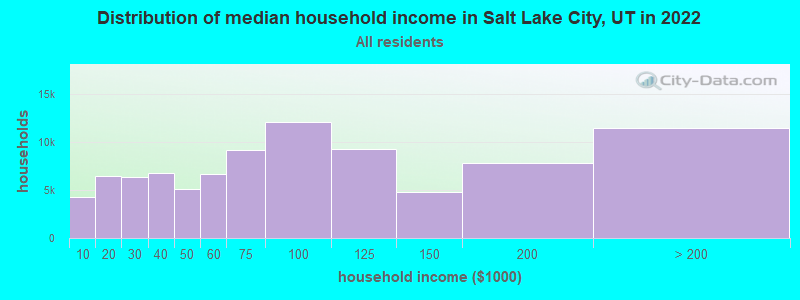
Salt Lake City, UT household income distribution 4,223 Less than $10,0006,446 $10,000 to $19,9996,387 $20,000 to $29,9996,786 $30,000 to $39,9995,068 $40,000 to $49,9996,697 $50,000 to $59,9999,182 $60,000 to $74,99912,067 $75,000 to $99,9999,310 $100,000 to $124,9994,758 $125,000 to $149,9997,848 $150,000 to $199,99911,423 $200,000 or more
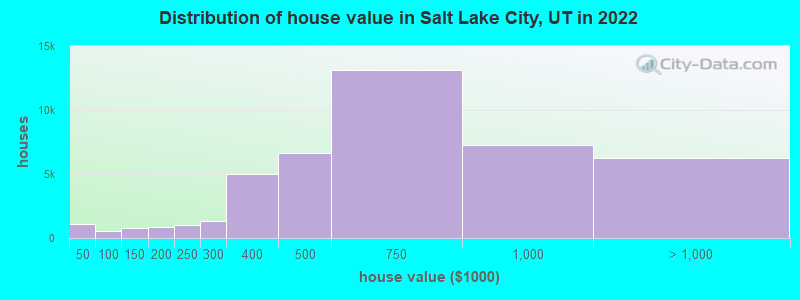
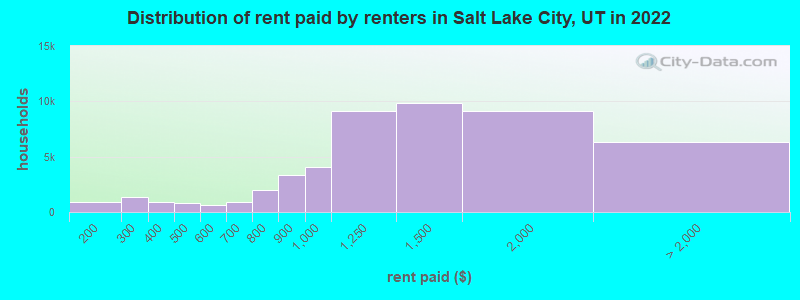
Home value of owner - occupied houses in 2022 in Salt Lake City, UT 350 Less than $10,00028 $10,000 to $14,999114 $15,000 to $19,999118 $20,000 to $24,999124 $25,000 to $29,99972 $30,000 to $34,999187 $35,000 to $39,99970 $40,000 to $49,999120 $50,000 to $59,99928 $60,000 to $69,999165 $70,000 to $79,999105 $80,000 to $89,99980 $90,000 to $99,999354 $100,000 to $124,999397 $125,000 to $149,999388 $150,000 to $174,999491 $175,000 to $199,9991,054 $200,000 to $249,9991,342 $250,000 to $299,9995,010 $300,000 to $399,9996,668 $400,000 to $499,99913,128 $500,000 to $749,9997,293 $750,000 to $999,9994,081 $1,000,000 to $1,499,999960 $1,500,000 to $1,999,9991,207 $2,000,000 or moreRent paid by renters in 2022 in Salt Lake City, UT 435 $100 to $149424 $150 to $199723 $200 to $249591 $250 to $299490 $300 to $349402 $350 to $399184 $400 to $449625 $450 to $499361 $500 to $549306 $550 to $599454 $600 to $649422 $650 to $6991,013 $700 to $749963 $750 to $7993,360 $800 to $8994,100 $900 to $9999,162 $1,000 to $1,2499,825 $1,250 to $1,4999,150 $1,500 to $1,9993,660 $2,000 to $2,499635 $2,500 to $2,999765 $3,000 to $3,499422 $3,500 or more878 No cash rent
Percentage of workers working in this county: 90.6%Number of people working at home: 25,519 (20.1% of all workers )
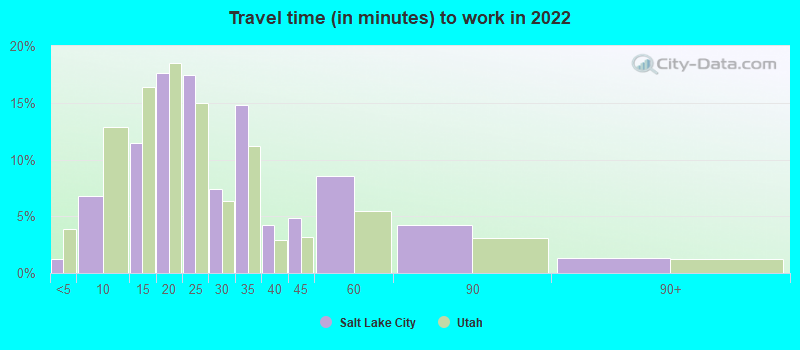
Travel time to work (commute)
Less than 5 minutes: 1,7005 to 9 minutes: 12,74310 to 14 minutes: 22,62115 to 19 minutes: 23,97920 to 24 minutes: 15,53825 to 29 minutes: 5,23830 to 34 minutes: 8,58935 to 39 minutes: 2,29240 to 44 minutes: 2,50545 to 59 minutes: 2,53960 to 89 minutes: 2,27190 or more minutes: 1,179
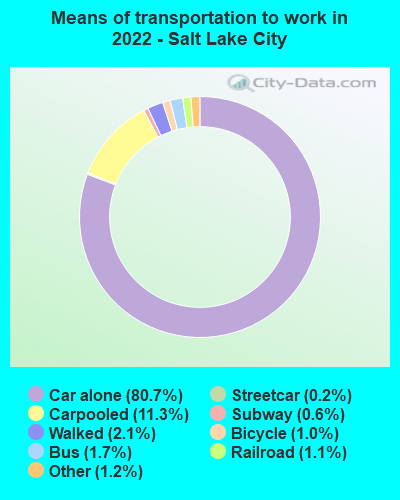
Means of transportation to work:
Drove a car alone: 198,621 (73.1%)Carpooled: 27,799 (10.2%)Bus : 4,237 (1.6%)Subway or elevated rail : 598 (0.2%)Long-distance train or commuter rail : 1,584 (0.6%)Light rail, streetcar or trolley : 2,794 (1.0%)Taxi: 2,902 (1.1%)Bicycle: 2,451 (0.9%)Walked: 5,183 (1.9%)Worked at home: 25,519 (9.4%)
Unemployment by race in 2022
Unemployment rate for White non-Hispanic residents 1.9% Males2.7% FemalesUnemployment rate for Black residents 6.8% Males2.0% FemalesUnemployment rate for American Indian and Alaska Native residents 6.7% Males6.9% FemalesUnemployment rate for Asian residents 0.8% Males2.7% FemalesUnemployment rate for other race residents 2.0% Males4.9% FemalesUnemployment rate for two or more race residents 3.6% Males4.9% FemalesUnemployment rate for Hispanic or Latino residents 5.8% Males6.4% Females
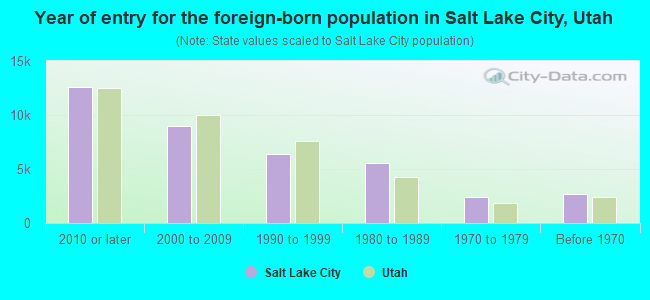
Year of entry for the foreign-born population in Salt Lake City, Utah
12,604 2010 or later 8,987 2000 to 2009 6,371 1990 to 1999 5,571 1980 to 1989 2,383 1970 to 1979 2,697 Before 1970
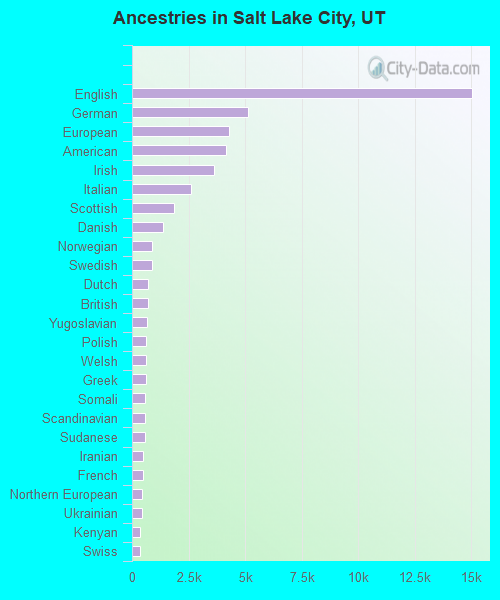
First ancestries reported:
English: 15,036 (14.0%)
German: 5,109 (4.7%)
European: 4,277 (4.0%)
American: 4,169 (3.9%)
Irish: 3,638 (3.4%)
Italian: 2,601 (2.4%)
Scottish: 1,875 (1.7%)
Danish: 1,370 (1.3%)
Norwegian: 904 (0.8%)
Swedish: 903 (0.8%)
Dutch: 726 (0.7%)
British: 708 (0.7%)
Yugoslavian: 674 (0.6%)
Polish: 641 (0.6%)
Welsh: 616 (0.6%)
Greek: 609 (0.6%)
Somali: 570 (0.5%)
Scandinavian: 558 (0.5%)
Sudanese: 555 (0.5%)
Iranian: 492 (0.5%)
French: 478 (0.4%)
Northern European: 451 (0.4%)
Ukrainian: 442 (0.4%)
Kenyan: 356 (0.3%)
Swiss: 355 (0.3%)
Egyptian: 350 (0.3%)
Lebanese: 311 (0.3%)
Russian: 301 (0.3%)
Scotch-Irish: 295 (0.3%)
African: 277 (0.3%)
Ethiopian: 275 (0.3%)
Eastern European: 257 (0.2%)
Brazilian: 234 (0.2%)
French Canadian: 195 (0.2%)
Canadian: 173 (0.2%)
Haitian: 170 (0.2%)
Austrian: 156 (0.1%)
Afghan: 155 (0.1%)
Serbian: 143 (0.1%)
Nigerian: 134 (0.1%)
Czech: 115 (0.1%)
Finnish: 104 (0.10%)
Belgian: 99 (0.09%)
Romanian: 97 (0.09%)
Slovak: 94 (0.09%)
Slavic: 88 (0.08%)
Portuguese: 77 (0.07%)
Armenian: 76 (0.07%)
South African: 76 (0.07%)
Ugandan: 60 (0.06%)
Cajun: 47 (0.04%)
Lithuanian: 45 (0.04%)
Palestinian: 43 (0.04%)
Croatian: 41 (0.04%)
New Zealander: 35 (0.03%)
Zimbabwean: 35 (0.03%)
Guyanese: 34 (0.03%)
Arab: 34 (0.03%)
Turkish: 32 (0.03%)
Ghanaian: 31 (0.03%)
Jordanian: 31 (0.03%)
Basque: 30 (0.03%)
Iraqi: 23 (0.02%)
Bulgarian: 18 (0.02%)
Trinidadian and Tobagonian: 17 (0.02%)
Albanian: 16 (0.01%)
Maltese: 16 (0.01%)
West Indian: 16 (0.01%)
Australian: 11 (0.01%)
Moroccan: 11 (0.01%)
Syrian: 10 (0.01%)
Czechoslovakian: 9 (0.01%)
Latvian: 7 (0.01%)
Most common places of birth for foreign-born residents (%): Mexico Salt Lake City:
33.3% (10,913)Utah:
36.1% (99,740)
China, excluding Hong Kong and Taiwan Salt Lake City:
6.0% (1,954)Utah:
2.9% (8,017)
Oceania, n.e.c. Salt Lake City:
4.5% (1,486)Utah:
2.7% (7,472)
India Salt Lake City:
3.2% (1,050)Utah:
3.0% (8,294)
Vietnam Salt Lake City:
2.5% (818)Utah:
2.6% (7,211)
Thailand Salt Lake City:
2.2% (712)Utah:
0.8% (2,087)
Brazil Salt Lake City:
2.1% (686)Utah:
2.8% (7,644)
Canada Salt Lake City:
2.0% (671)Utah:
3.0% (8,341)
Peru Salt Lake City:
2.0% (652)Utah:
2.9% (7,901)
Colombia Salt Lake City:
1.8% (599)Utah:
2.0% (5,555)
Burma (Myanmar) Salt Lake City:
1.8% (591)Utah:
0.4% (1,109)
Guatemala Salt Lake City:
1.7% (563)Utah:
2.1% (5,902)
Place of birth for U.S.-born residents:
This state: 88,513Other state: 79,975Northeast: 12,612Midwest: 14,734South: 14,953West: 37,676 78.8% of Salt Lake City residents lived in the same house 1 years ago.
Out of people who lived in different houses, 35.0% lived in this county.
Out of people who lived in different counties, 37.9% lived in Utah.
Salt Lake City:
78.8%State average:
85.7%
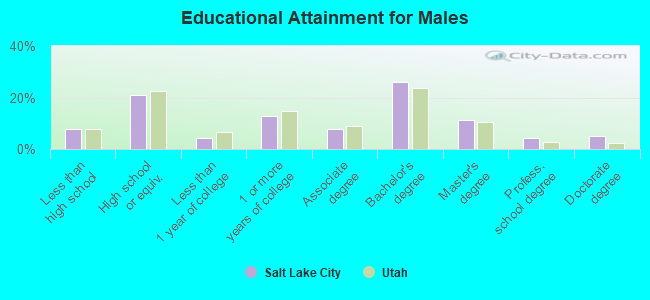
Education attainment for males 25 years and older:
No schooling: 1,200Nursery to 4th grade: 7525th and 6th grade: 7527th and 8th grade: 9319th grade: 20810th grade: 32411th grade: 74012th grade, no diploma: 664High school graduate (or equivalency): 15,000Less than 1 year of college: 2,990Some college more than 1 year, no degree: 9,318Associate degree: 5,670Bachelor's degree: 18,712Master's degree: 7,967Professional school degree: 3,050Doctorate degree: 3,536
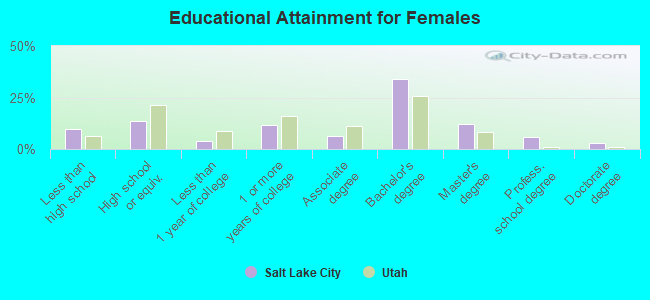
Education attainment for females 25 years and older:
No schooling: 1,161Nursery to 4th grade: 5405th and 6th grade: 1,0837th and 8th grade: 6059th grade: 97910th grade: 57411th grade: 73212th grade, no diploma: 563High school graduate (or equivalency): 8,778Less than 1 year of college: 2,547Some college more than 1 year, no degree: 7,484Associate degree: 4,226Bachelor's degree: 21,920Master's degree: 7,850Professional school degree: 3,809Doctorate degree: 1,914
Housing units in structures:
One, detached: 43,782One, attached: 3,584Two: 4,8013 or 4: 5,3335 to 9: 4,64310 to 19: 7,66720 to 49: 9,03050 or more: 18,488Mobile homes: 732Boats, RVs, vans, etc.: 146Median worth of mobile homes: $52,700
Housing units lacking complete plumbing facilities in 2022: 0.2%Housing units lacking complete kitchen facilities in 2022: 0.4%House/condo owner moved in on average 9 years ago
Renter moved in on average 1 years ago
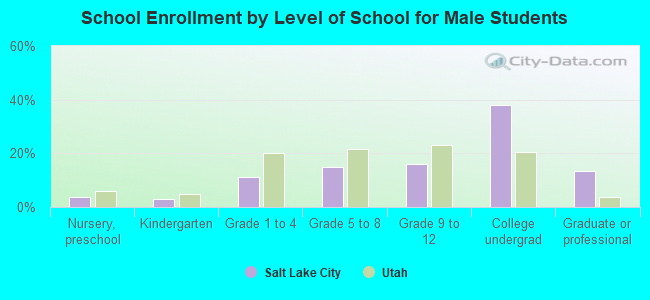
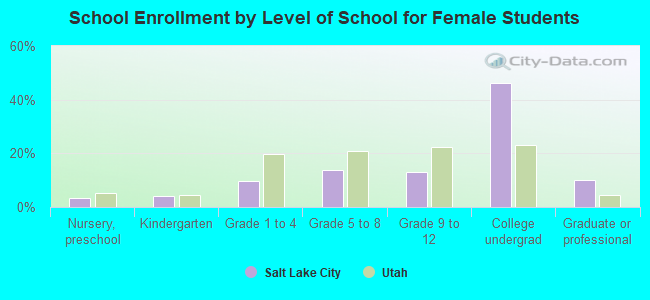
Private vs. public school enrollment:
Students in private schools in grades 1 to 8 (elementary and middle school): 1,274 Students in private schools in grades 9 to 12 (high school): 524 Students in private undergraduate colleges: 3,813