Housing density: 440 houses/condos per square mile
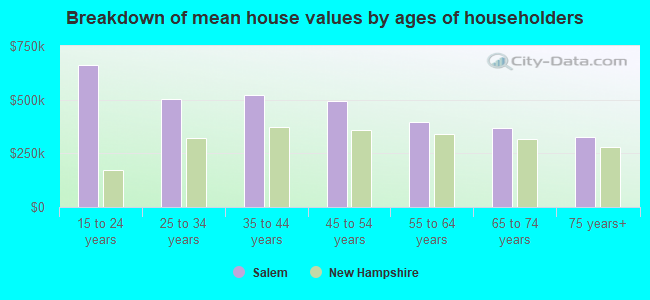
Median price asked for vacant for-sale houses and condos in 2022 in this county: $227,726.
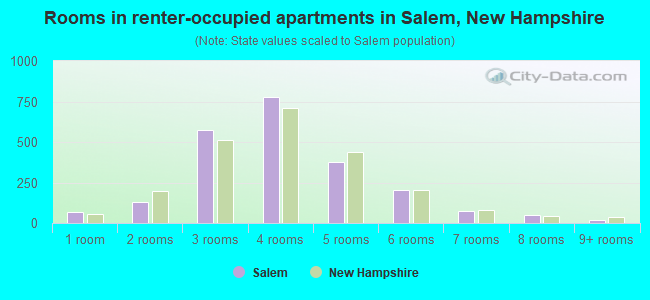
Median contract rent in 2022: $1,453 (lower quartile is $1,177, upper quartile is $1,922)
Median rent asked for vacant for-rent units in 2022: $1,214
Median gross rent in Salem, NH in 2022: $1,553
Housing units in Salem with a mortgage: 5,200 (431 second mortgage, 663 home equity loan, 24 both second mortgage and home equity loan) Houses without a mortgage: 1,530
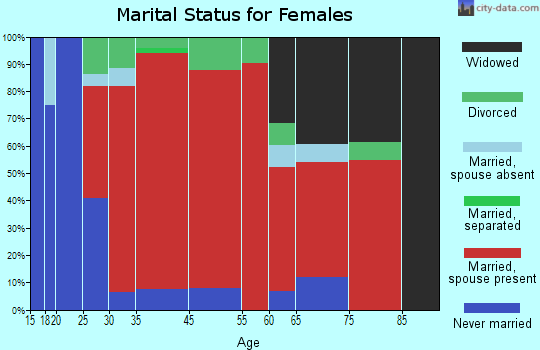
In family households: 247,693 (57,848 male householders, 21,984 female householders)
64,858 spouses, 85,601 children (80,134 natural, 2,077 adopted, 3,390 stepchildren), 3,954 grandchildren, 1,562 brothers or sisters, 2,352 parents, foster children, 1,664 other relatives, 5,842 non-relatives
In nonfamily households: 45,032 (17,024 male householders (12,402 living alone)), 18,177 female householders (14,574 living alone)), 9,831 nonrelatives
In group quarters: 2,498 (1,438 institutionalized population)
57,723 married couples with children.
11,266 single-parent households (3,032 men, 8,234 women).
90.0% of residents of Salem speak English at home.
1.4% of residents speak Spanish at home (63% speak English very well, 25% speak English well, 12% speak English not well).
6.2% of residents speak other Indo-European language at home (69% speak English very well, 21% speak English well, 9% speak English not well, 1% don't speak English at all).
1.8% of residents speak Asian or Pacific Island language at home (71% speak English very well, 26% speak English well, 2% speak English not well).
0.7% of residents speak other language at home (70% speak English very well, 15% speak English well, 15% speak English not well).
Foreign born population: 2,952 (9.1%)
(72.3% of them are naturalized citizens)
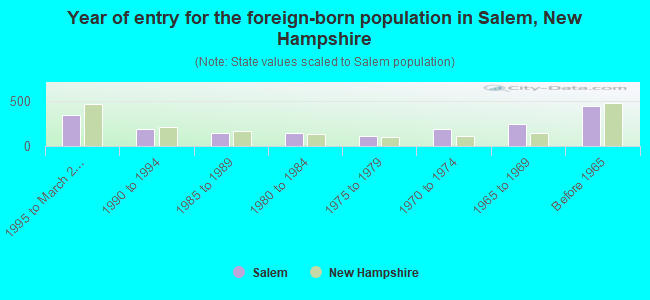
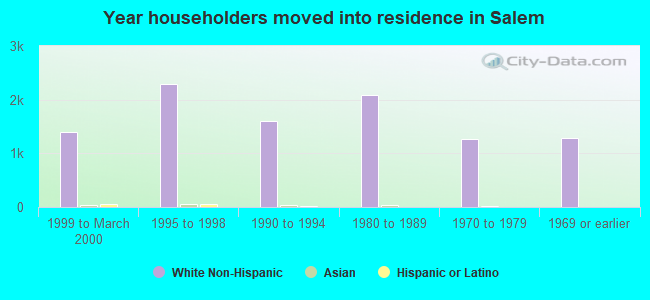
Year of entry for the foreign-born population in Salem, New Hampshire
3451995 to March 2000
1901990 to 1994
1411985 to 1989
1411980 to 1984
1131975 to 1979
1891970 to 1974
2401965 to 1969
444Before 1965
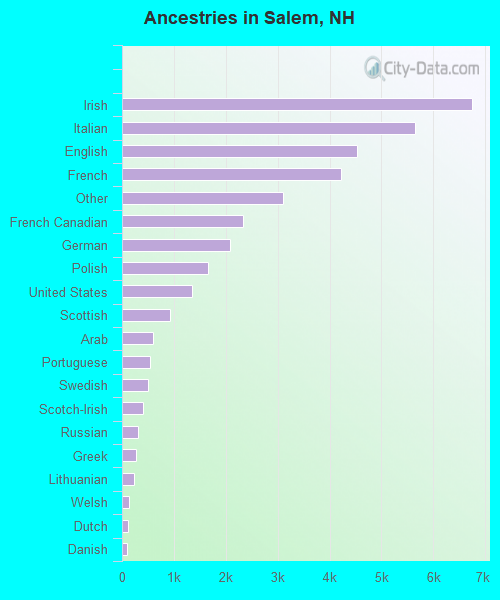
First ancestries reported:
Irish: 6,736 (18.7%)
Italian: 5,656 (15.7%)
English: 4,538 (12.6%)
French: 4,224 (11.7%)
Other: 3,112 (8.6%)
French Canadian: 2,334 (6.5%)
German: 2,082 (5.8%)
Polish: 1,655 (4.6%)
United States: 1,340 (3.7%)
Scottish: 916 (2.5%)
Arab: 600 (1.7%)
Portuguese: 539 (1.5%)
Swedish: 494 (1.4%)
Scotch-Irish: 414 (1.1%)
Russian: 307 (0.9%)
Greek: 261 (0.7%)
Lithuanian: 235 (0.7%)
Welsh: 141 (0.4%)
Dutch: 120 (0.3%)
Danish: 89 (0.2%)
Norwegian: 51 (0.1%)
Hungarian: 49 (0.1%)
Czech: 42 (0.1%)
Ukrainian: 36 (0.10%)
Slovak: 16 (0.04%)
Swiss: 16 (0.04%)
West Indian: 13 (0.04%)
Subsaharan African: 8 (0.02%)
Most common places of birth for foreign-born residents (%):
Canada
Salem:
16.9% (305)
New Hampshire:
22.9% (12,397)
Philippines
Salem:
11.4% (205)
New Hampshire:
1.9% (1,031)
Dominican Republic
Salem:
9.9% (179)
New Hampshire:
2.3% (1,227)
United Kingdom
Salem:
7.0% (126)
New Hampshire:
8.1% (4,396)
Italy
Salem:
6.9% (124)
New Hampshire:
1.5% (813)
Lebanon
Salem:
6.7% (121)
New Hampshire:
0.9% (489)
Korea
Salem:
3.2% (57)
New Hampshire:
2.9% (1,582)
India
Salem:
2.9% (52)
New Hampshire:
4.7% (2,530)
Germany
Salem:
2.8% (50)
New Hampshire:
4.9% (2,670)
Russia
Salem:
2.8% (50)
New Hampshire:
1.3% (689)
China, excluding Hong Kong and Taiwan
Salem:
2.8% (50)
New Hampshire:
3.4% (1,828)
Portugal
Salem:
2.7% (49)
New Hampshire:
1.5% (835)
Hong Kong
Salem:
2.7% (48)
New Hampshire:
0.8% (433)
Iran
Salem:
2.4% (43)
New Hampshire:
0.6% (338)
Poland
Salem:
2.1% (37)
New Hampshire:
1.7% (931)
Vietnam
Salem:
1.9% (34)
New Hampshire:
2.7% (1,440)
Japan
Salem:
1.6% (29)
New Hampshire:
1.3% (706)
Place of birth for U.S.-born residents:
This state: 2,923
Other state: 23,163
Northeast: 21,862
Midwest: 508
South: 580
West: 213
67% of Salem residents lived in the same house 5 years ago. Out of people who lived in different houses, 47% lived in this county. Out of people who lived in different counties, 16% lived in New Hampshire.
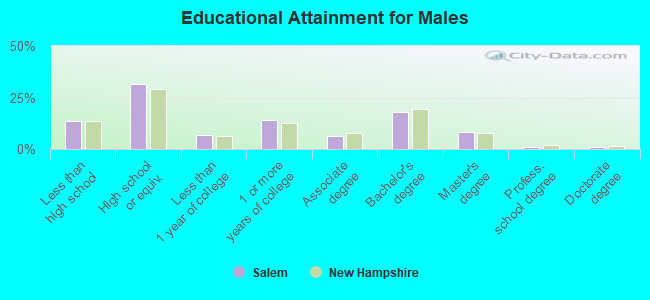
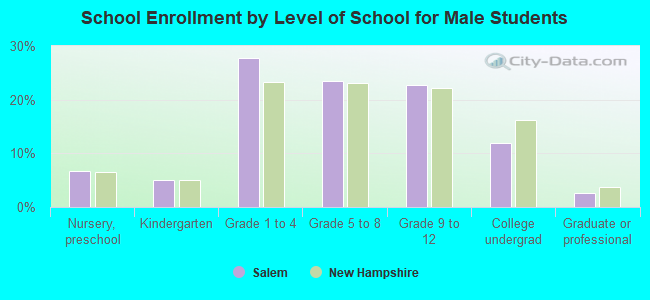
Education attainment for males 25 years and older:
No schooling: 57
Nursery to 4th grade: 0
5th and 6th grade: 45
7th and 8th grade: 255
9th grade: 213
10th grade: 296
11th grade: 204
12th grade, no diploma: 212
High school graduate (or equivalency): 2,991
Less than 1 year of college: 632
Some college more than 1 year, no degree: 1,312
Associate degree: 619
Bachelor's degree: 1,684
Master's degree: 770
Professional school degree: 94
Doctorate degree: 82
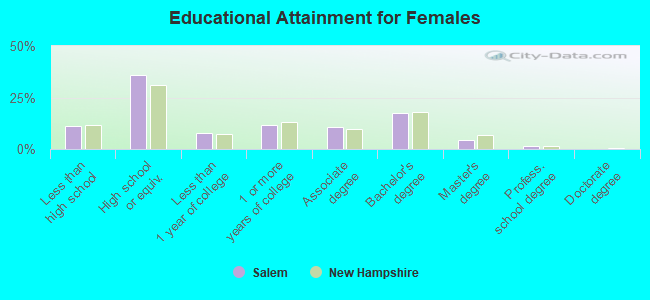
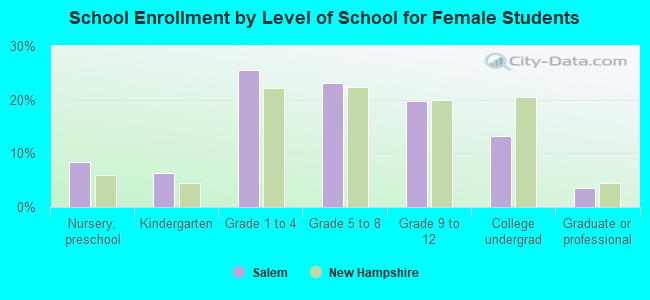
Education attainment for females 25 years and older:
No schooling: 23
Nursery to 4th grade: 21
5th and 6th grade: 66
7th and 8th grade: 199
9th grade: 121
10th grade: 253
11th grade: 126
12th grade, no diploma: 275
High school graduate (or equivalency): 3,519
Less than 1 year of college: 748
Some college more than 1 year, no degree: 1,157
Associate degree: 1,043
Bachelor's degree: 1,714
Master's degree: 405
Professional school degree: 128
Doctorate degree: 18
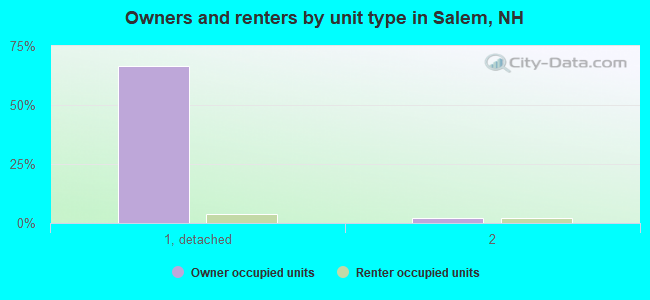
Housing units in structures:
One, detached: 7,683
One, attached: 226
Two: 453
3 or 4: 277
5 to 9: 251
10 to 19: 546
20 to 49: 606
50 or more: 28
Mobile homes: 788
Boats, RVs, vans, etc.: 8
Median worth of mobile homes: $122,336
Housing units lacking complete plumbing facilities: 0.2%
Housing units lacking complete kitchen facilities: 0.2%