Races in Salem, New Hampshire (NH) Detailed Stats
Ancestries, Foreign-born residents, place of birth

Recent posts about races in Salem, New Hampshire on our local forum with over 2,400,000 registered users:
 | Move to NH? Schools? Hockey? Please help! (50 replies) |
| Tell me where to look for houses! :D (14 replies) |
| Dover: hilly hikes? (18 replies) |
| What can NH do? (61 replies) |
| Pros and cons of Shifting to New Hampshire from Massachusetts (21 replies) |
| income tax alert - HB628 (48 replies) |
Latest news about races in Salem, NH collected exclusively by city-data.com from local newspapers, TV, and radio stations
6.4% of Salem, NH residents are foreign-born (2.4% born in Asia, 2.1% born in Europe, 1.1% born in North America, 0.9% born in Latin America), which is 22.0% greater than the foreign-born rate of 5.0% across the entire state of New Hampshire.
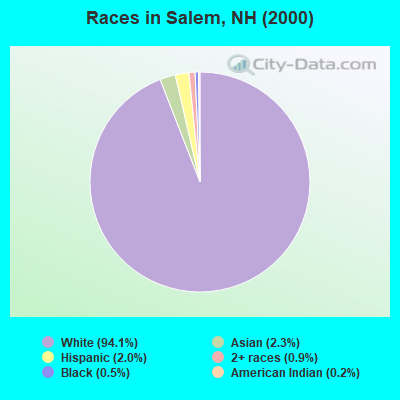
Race distribution in Salem

- 26,44694.1%White alone
- 6392.3%Asian alone
- 5522.0%Hispanic
- 2460.9%Two or more races
- 1430.5%Black alone
- 480.2%American Indian alone
- 210.07%Other race alone
- 170.06%Native Hawaiian and Other
Pacific Islander alone
2000
2022
-
- 1,175,25295.1%White alone
- 20,4891.7%Hispanic
- 15,8031.3%Asian alone
- 11,6060.9%Two or more races
- 8,3540.7%Black alone
- 2,6980.2%American Indian alone
- 1,2540.1%Other race alone
- 3300.03%Native Hawaiian and Other
Pacific Islander alone

-
- 1,208,10186.6%White alone
- 63,4794.5%Hispanic
- 60,7244.4%Two or more races
- 36,5192.6%Asian alone
- 17,9311.3%Black alone
- 6,6150.5%Other race alone
- 1,0140.07%American Indian alone
- 8480.06%Native Hawaiian and Other
Pacific Islander alone

Income and house value in Salem
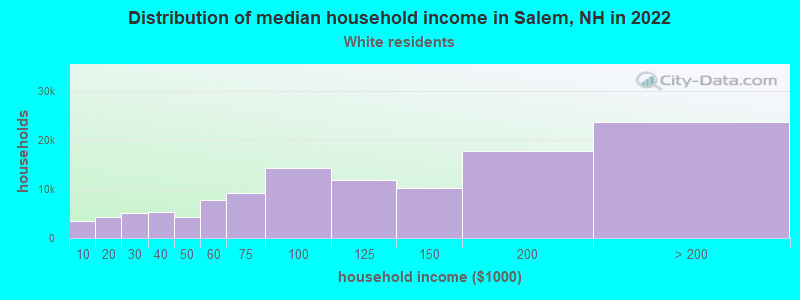
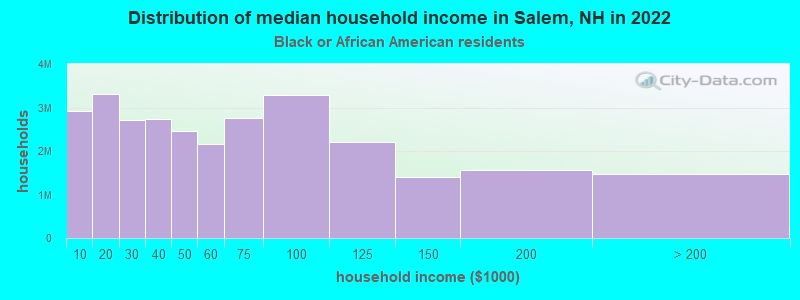
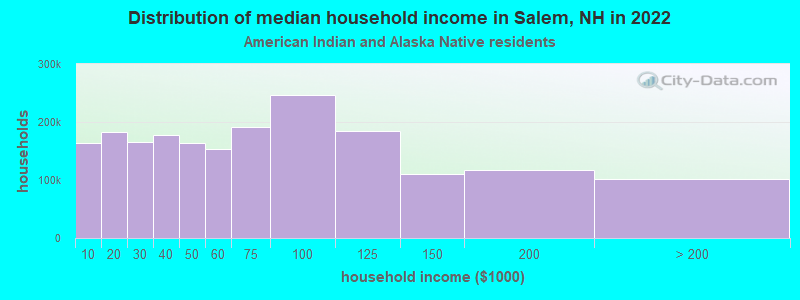
- Median household income in 2022
- $108,214White non-Hispanic householders
- $80,446Black householders
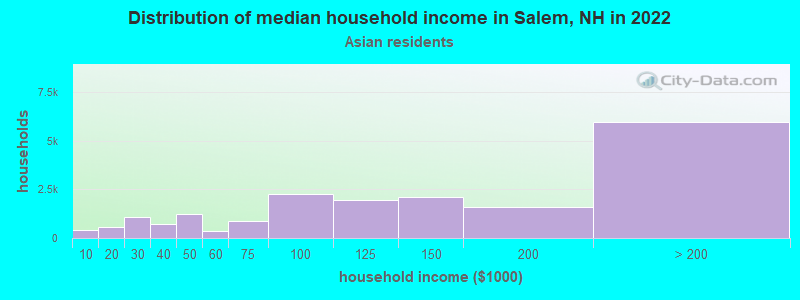
- $153,589Asian householders
- $33,095Some other race householders
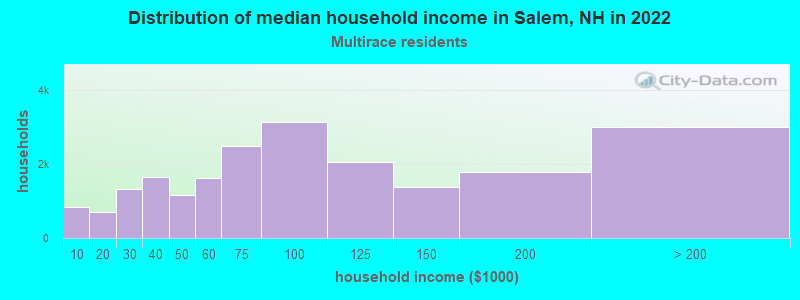
- $151,622Two or more races householders
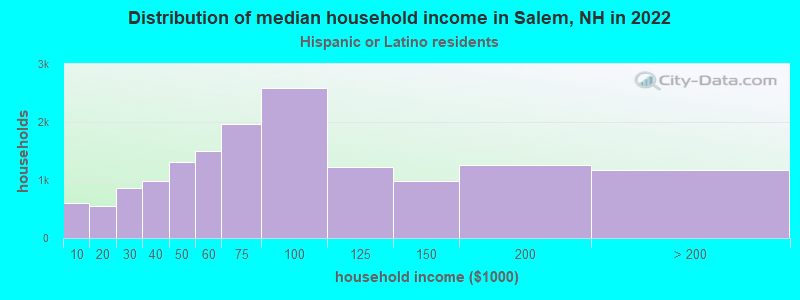
- $61,261Hispanic or Latino race householders
- Median 2022 house value
- $518,228White Non-Hispanic householders
- $348,031Black or African American householders
- $150,946American Indian or Alaska Native householders
- $544,200Asian householders
- $396,310Some other race householders
- $235,891Two or more races householders
- $399,671Hispanic or Latino householders
Household income for White non-Hispanic householders
Household income for Black householders
Household income for American Indian and Alaska Native householders
Household income for Asian householders
Household income for Two or more races householders
Household income for Hispanic or Latino race householders
Foreign-born residents in Salem
1,803 residents are foreign born (2.4% Asia, 2.1% Europe, 1.1% North America, 0.9% Latin America).
| This city: | 6.4% |
| New Hampshire: | 4.4% |
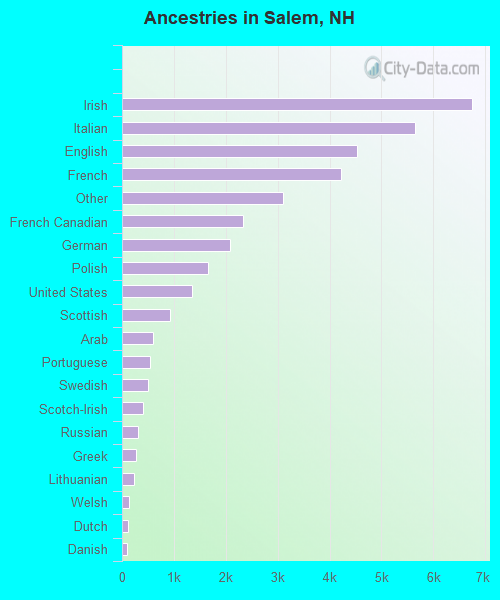
Ancestries in Salem

- 6,73618.7%Irish
- 5,65615.7%Italian
- 4,53812.6%English
- 4,22411.7%French
- 3,1128.6%Other
- 2,3346.5%French Canadian
- 2,0825.8%German
- 1,6554.6%Polish
- 1,3403.7%United States
- 9162.5%Scottish
- 6001.7%Arab
- 5391.5%Portuguese
- 4941.4%Swedish
- 4141.1%Scotch-Irish
- 3070.9%Russian
- 2610.7%Greek
- 2350.7%Lithuanian
- 1410.4%Welsh
- 1200.3%Dutch
- 890.2%Danish
- 510.1%Norwegian
- 490.1%Hungarian
- 420.1%Czech
- 360.10%Ukrainian
- 160.04%Slovak
- 160.04%Swiss
- 130.04%West Indian
- 80.02%Subsaharan African
Zip codes: 03079.