Royal Palm Beach, FL (Florida) Houses and Residents
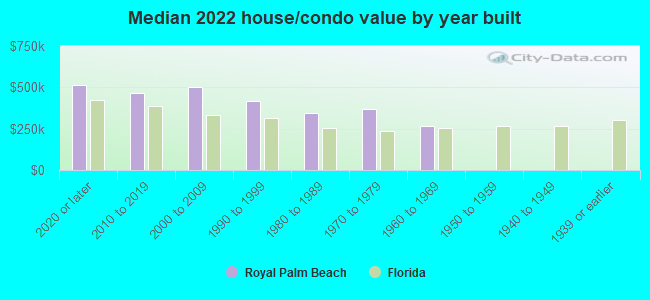
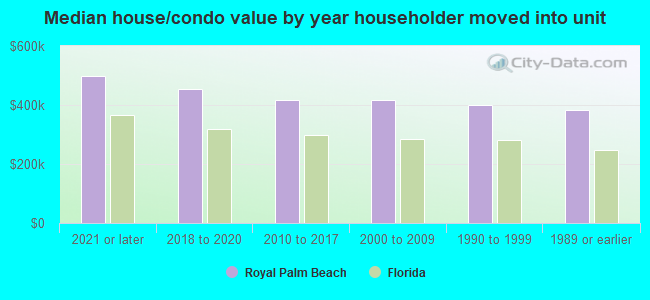
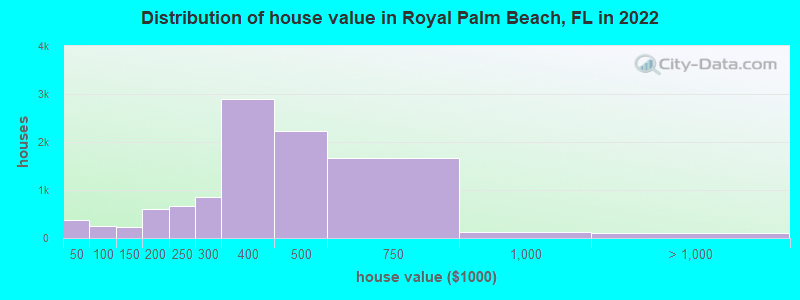
Estimated median house or condo value in 2022: $415,778 (it was $109,100 in 2000 )
Royal Palm Beach:
$415,778Florida:
$354,100
Lower value quartile - upper value quartile: $296,431 - $540,322Total population: 37,015 (Urban population: 21,564, Rural population: 0)
Houses: 14,074 (13,290 occupied: 10,832 owner occupied, 2,623 renter occupied )
% of renters here:
19%State:
33%
Housing density: 1,423 houses/condos per square mile
Median price asked for vacant for-sale houses and condos in 2022: $151,444.
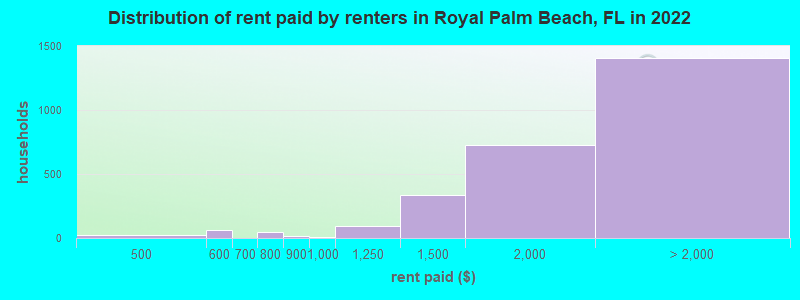
Median contract rent in 2022: $1,935 (lower quartile is $1,473, upper quartile is over $2,000)
Median rent asked for vacant for-rent units in 2022: $2,523
Median gross rent in Royal Palm Beach, FL in 2022: over $2,000
Housing units in Royal Palm Beach with a mortgage: 7,984 (531 second mortgage, 0 home equity loan, 338 both second mortgage and home equity loan )Houses without a mortgage: 117
Median household income for houses/condos with a mortgage: $102,894
Median household income for apartments without a mortgage: $73,322
Median monthly housing costs: $1,746
Data:
Median house or condo value ($)
Median house or condo value ($ change since 2000)
Median house or condo value ($) - White
Median house or condo value ($) - Black or African American
Median house or condo value ($) - Asian
Median house or condo value ($) - Hispanic or Latino
Median house or condo value ($) - American Indian and Alaska Native
Median house or condo value ($) - Multirace
Median house or condo value ($) - Other Race
Median price asked for mobile homes ($)
Household density (households per square mile)
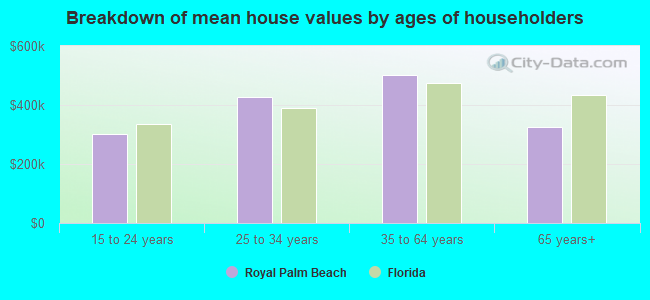
Mean house or condo value by units in structure - 1, detached ($)
Mean house or condo value by units in structure - 1, attached ($)
Mean house or condo value by units in structure - 2 ($)
Mean house or condo value by units in structure by units in structure - 3 or 4 ($)
Mean house or condo value by units in structure - 5 or more ($)
Mean house or condo value by units in structure - Boat, RV, van, etc. ($)
Mean house or condo value by units in structure - Mobile home ($)
Median contract rent ($)
Median contract rent - Lower quartile ($)
Median contract rent - Upper quartile ($)
Median gross rent ($)
Urban houses (%)
Rural houses (%)
Houses occupied (%)
Houses occupied (% change since 2000)
Houses owner occupied (%)
Houses owner occupied (% change since 2000)
Houses renter occupied (%)
Houses renter occupied (% change since 2000)
Vacant housing units - For rent (%)
Vacant housing units - For rent (% change since 2000)
Vacant housing units - For sale only (%)
Vacant housing units - For sale only (% change since 2000)
Vacant housing units - Rented or sold, not occupied (%)
Vacant housing units - Rented or sold, not occupied (% change since 2000)
Vacant housing units - For seasonal, recreational, or occasional use (%)
Vacant housing units - For seasonal, recreational, or occasional use (% change since 2000)
Vacant housing units - For migrant workers (%)
Vacant housing units - For migrant workers (% change since 2000)
Vacant housing units - Other vacant (%)
Vacant housing units - Other vacant (% change since 2000)
Median monthly housing costs ($)
Median household income for houses/condos with a mortgage ($)
Median household income for houses/condos without a mortgage ($)
Median household income ($)
Median household income ($) - White
Median household income ($) - Black or African American
Median household income ($) - Asian
Median household income ($) - Hispanic or Latino
Median household income ($) - American Indian and Alaska Native
Median household income ($) - Multirace
Median household income ($) - Other Race
Mortgage status - with mortgage (%)
Mortgage status - with second mortgage (%)
Mortgage status - with home equity loan (%)
Mortgage status - with both second mortgage and home equity loan (%)
Mortgage status - without a mortgage (%)
Median year house/condo built
Median year apartment built
Household type by relationship - Male householder living alone (%)
Household type by relationship - Male householder not living alone (%)
Household type by relationship - Female householder living alone (%)
Household type by relationship - Female householder not living alone (%)
Household type by relationship - Opposite-Sex spouse (%)
Household type by relationship - Same-Sex spouse (%)
Household type by relationship - Opposite-Sex unmarried partner (%)
Household type by relationship - Same-Sex unmarried partner (%)
Household type by relationship - In group quarters (%)
Size of family households - 2-person household (%)
Size of family households - 3-person household (%)
Size of family households - 4-person household (%)
Size of family households - 5-person household (%)
Size of family households - 6-person household (%)
Size of family households - 7-or-more-person household (%)
Size of nonfamily households - 1-person household (%)
Size of nonfamily households - 2-person household (%)
Size of nonfamily households - 3-person household (%)
Size of nonfamily households - 4-person household (%)
Size of nonfamily households - 5-person household (%)
Size of nonfamily households - 6-person household (%)
Size of nonfamily households - 7-or-moreperson household (%)
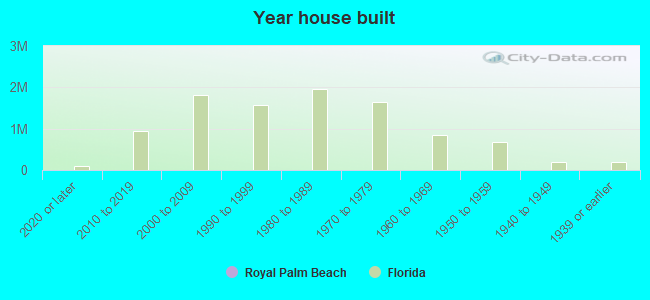
Year house built - Built 2010 or later (%)
Year house built - Built 2000 to 2009 (%)
Year house built - Built 1990 to 1999 (%)
Year house built - Built 1980 to 1989 (%)
Year house built - Built 1970 to 1979 (%)
Year house built - Built 1960 to 1969 (%)
Year house built - Built 1950 to 1959 (%)
Year house built - Built 1940 to 1949 (%)
Year house built - Built 1939 or earlier (%)
Median number of rooms in houses and condos
Median number of rooms in apartments
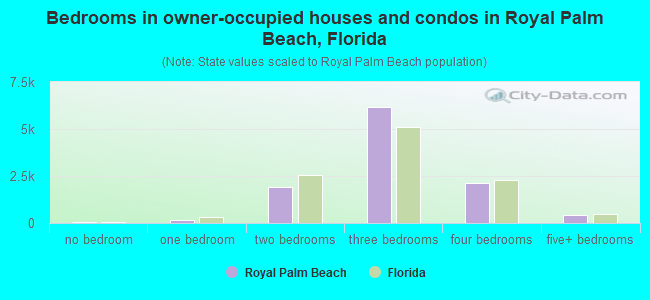
Median number of bedrooms in owner occupied houses
Mean number of bedrooms in owner occupied houses
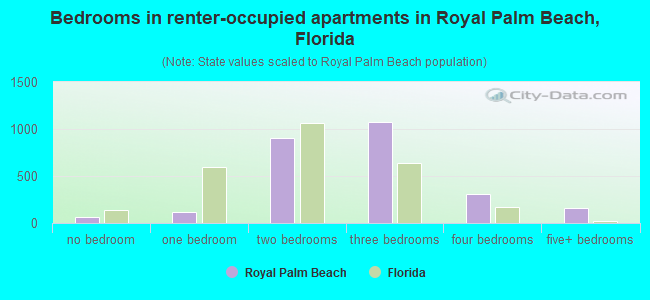
Median number of bedrooms in renter occupied houses
Mean number of bedrooms in renter occupied houses
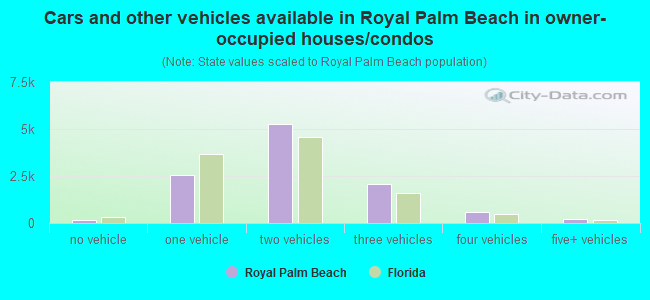
Median number of vehichles in owner occupied houses
Mean number of vehichles in owner occupied houses
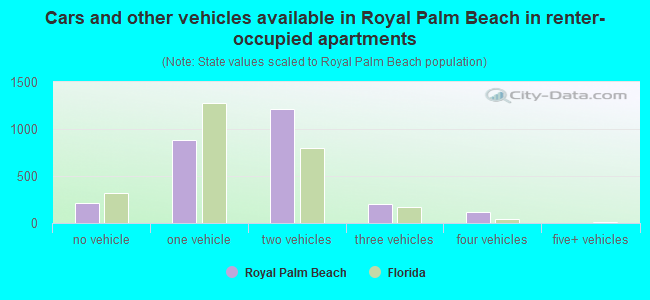
Median number of vehichles in renter occupied houses
Mean number of vehichles in renter occupied houses
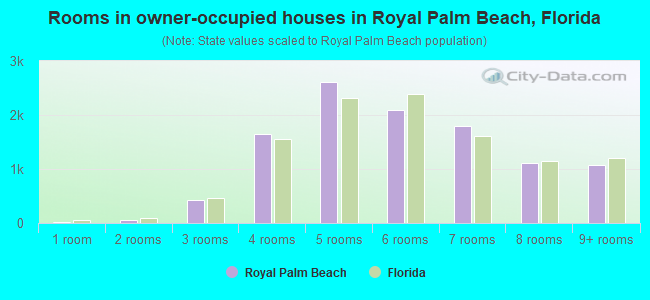
Rooms in owner-occupied houses - 1 room (%)
Rooms in owner-occupied houses - 2 rooms (%)
Rooms in owner-occupied houses - 3 rooms (%)
Rooms in owner-occupied houses - 4 rooms (%)
Rooms in owner-occupied houses - 5 rooms (%)
Rooms in owner-occupied houses - 6 rooms (%)
Rooms in owner-occupied houses - 7 rooms (%)
Rooms in owner-occupied houses - 8 rooms (%)
Rooms in owner-occupied houses - 9+ rooms (%)
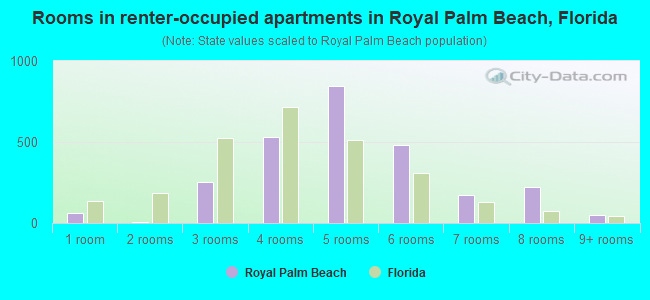
Rooms in renter-occupied houses - 1 room (%)
Rooms in renter-occupied houses - 2 rooms (%)
Rooms in renter-occupied houses - 3 rooms (%)
Rooms in renter-occupied houses - 4 rooms (%)
Rooms in renter-occupied houses - 5 rooms (%)
Rooms in renter-occupied houses - 6 rooms (%)
Rooms in renter-occupied houses - 7 rooms (%)
Rooms in renter-occupied houses - 8 rooms (%)
Rooms in renter-occupied houses - 9+ rooms (%)
Bedrooms in owner-occupied houses - no bedrooms (%)
Bedrooms in owner-occupied houses - 1 bedroom (%)
Bedrooms in owner-occupied houses - 2 bedrooms (%)
Bedrooms in owner-occupied houses - 3 bedrooms (%)
Bedrooms in owner-occupied houses - 4 bedrooms (%)
Bedrooms in owner-occupied houses - 5+ bedrooms (%)
Bedrooms in renter-occupied houses - no bedrooms (%)
Bedrooms in renter-occupied houses - 1 bedroom (%)
Bedrooms in renter-occupied houses - 2 bedrooms (%)
Bedrooms in renter-occupied houses - 3 bedrooms (%)
Bedrooms in renter-occupied houses - 4 bedrooms (%)
Bedrooms in renter-occupied houses - 5+ bedrooms (%)
Vehicles available in owner-occupied houses - no vehicle available (%)
Vehicles available in owner-occupied houses - 1 vehicle available(%)
Vehicles available in owner-occupied houses - 2 Vehicles available (%)
Vehicles available in owner-occupied houses - 3 Vehicles available (%)
Vehicles available in owner-occupied houses - 4 Vehicles available (%)
Vehicles available in owner-occupied houses - 5+ Vehicles available (%)
Vehicles available in renter-occupied houses - no vehicle available (%)
Vehicles available in renter-occupied houses - 1 vehicle available (%)
Vehicles available in renter-occupied houses - 2 Vehicles available (%)
Vehicles available in renter-occupied houses - 3 Vehicles available (%)
Vehicles available in renter-occupied houses - 4 Vehicles available (%)
Vehicles available in renter-occupied houses - 5+ Vehicles available (%)
Housing units in structures - 1, detached (%)
Housing units in structures - 1, attached (%)
Housing units in structures - 2 (%)
Housing units in structures - 3 or 4 (%)
Housing units in structures - 5 to 9 (%)
Housing units in structures - 10 to 19 (%)
Housing units in structures - 20 to 49 (%)
Housing units in structures - 50 or more (%)
Housing units in structures - Mobile home (%)
Housing units in structures - Boat, RV, van, etc. (%)
Housing units in structures - Owners - 1, detached (%)
Housing units in structures - Owners - 1, attached (%)
Housing units in structures - Owners - 2 (%)
Housing units in structures - Owners - 3 or 4 (%)
Housing units in structures - Owners - 5 to 9 (%)
Housing units in structures - Owners - 10 to 19 (%)
Housing units in structures - Owners - 20 to 49 (%)
Housing units in structures - Owners - 50 or more (%)
Housing units in structures - Owners - Mobile home (%)
Housing units in structures - Owners - Boat, RV, van, etc. (%)
Housing units in structures - Renters - 1, detached (%)
Housing units in structures - Renters - 1, attached (%)
Housing units in structures - Renters - 2 (%)
Housing units in structures - Renters - 3 or 4 (%)
Housing units in structures - Renters - 5 to 9 (%)
Housing units in structures - Renters - 10 to 19 (%)
Housing units in structures - Renters - 20 to 49 (%)
Housing units in structures - Renters - 50 or more (%)
Housing units in structures - Renters - Mobile home (%)
Housing units in structures - Renters - Boat, RV, van, etc. (%)
House/condo owner moved in on average (years ago)
Renter moved in on average (years ago)
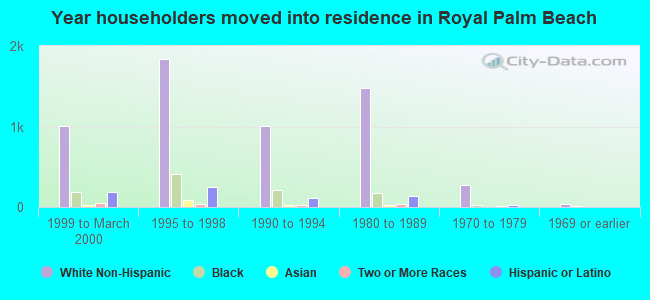
Year householder moved into unit - Moved in 1999 to March 2000 (%)
Year householder moved into unit - Moved in 1999 to March 2000 (%) - White
Year householder moved into unit - Moved in 1999 to March 2000 (%) - Black or African American
Year householder moved into unit - Moved in 1999 to March 2000 (%) - Asian
Year householder moved into unit - Moved in 1999 to March 2000 (%) - Hispanic or Latino
Year householder moved into unit - Moved in 1999 to March 2000 (%) - American Indian and Alaska Native
Year householder moved into unit - Moved in 1999 to March 2000 (%) - Multirace
Year householder moved into unit - Moved in 1999 to March 2000 (%) - Other Race
Year householder moved into unit - Moved in 1995 to 1998 (%)
Year householder moved into unit - Moved in 1995 to 1998 (%) - White
Year householder moved into unit - Moved in 1995 to 1998 (%) - Black or African American
Year householder moved into unit - Moved in 1995 to 1998 (%) - Asian
Year householder moved into unit - Moved in 1995 to 1998 (%) - Hispanic or Latino
Year householder moved into unit - Moved in 1995 to 1998 (%) - American Indian and Alaska Native
Year householder moved into unit - Moved in 1995 to 1998 (%) - Multirace
Year householder moved into unit - Moved in 1995 to 1998 (%) - Other Race
Year householder moved into unit - Moved in 1990 to 1994 (%)
Year householder moved into unit - Moved in 1990 to 1994 (%) - White
Year householder moved into unit - Moved in 1990 to 1994 (%) - Black or African American
Year householder moved into unit - Moved in 1990 to 1994 (%) - Asian
Year householder moved into unit - Moved in 1990 to 1994 (%) - Hispanic or Latino
Year householder moved into unit - Moved in 1990 to 1994 (%) - American Indian and Alaska Native
Year householder moved into unit - Moved in 1990 to 1994 (%) - Multirace
Year householder moved into unit - Moved in 1990 to 1994 (%) - Other Race
Year householder moved into unit - Moved in 1980 to 1989 (%)
Year householder moved into unit - Moved in 1980 to 1989 (%) - White
Year householder moved into unit - Moved in 1980 to 1989 (%) - Black or African American
Year householder moved into unit - Moved in 1980 to 1989 (%) - Asian
Year householder moved into unit - Moved in 1980 to 1989 (%) - Hispanic or Latino
Year householder moved into unit - Moved in 1980 to 1989 (%) - American Indian and Alaska Native
Year householder moved into unit - Moved in 1980 to 1989 (%) - Multirace
Year householder moved into unit - Moved in 1980 to 1989 (%) - Other Race
Year householder moved into unit - Moved in 1970 to 1979 (%)
Year householder moved into unit - Moved in 1970 to 1979 (%) - White
Year householder moved into unit - Moved in 1970 to 1979 (%) - Black or African American
Year householder moved into unit - Moved in 1970 to 1979 (%) - Asian
Year householder moved into unit - Moved in 1970 to 1979 (%) - Hispanic or Latino
Year householder moved into unit - Moved in 1970 to 1979 (%) - American Indian and Alaska Native
Year householder moved into unit - Moved in 1970 to 1979 (%) - Multirace
Year householder moved into unit - Moved in 1970 to 1979 (%) - Other Race
Year householder moved into unit - Moved in 1969 or earlier (%)
Year householder moved into unit - Moved in 1969 or earlier (%) - White
Year householder moved into unit - Moved in 1969 or earlier (%) - Black or African American
Year householder moved into unit - Moved in 1969 or earlier (%) - Asian
Year householder moved into unit - Moved in 1969 or earlier (%) - Hispanic or Latino
Year householder moved into unit - Moved in 1969 or earlier (%) - American Indian and Alaska Native
Year householder moved into unit - Moved in 1969 or earlier (%) - Multirace
Year householder moved into unit - Moved in 1969 or earlier (%) - Other Race
Housing units lacking complete plumbing facilities (%)
Housing units lacking complete kitchen facilities (%)
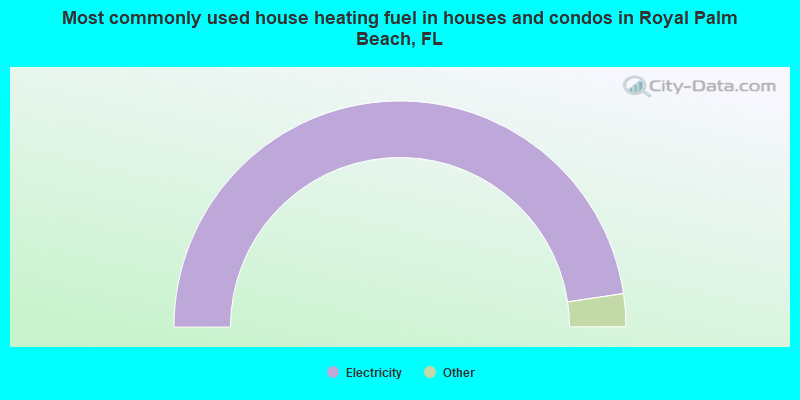
House heating fuel used in houses and condos - Utility gas (%)
House heating fuel used in houses and condos - Bottled, tank, or LP gas (%)
House heating fuel used in houses and condos - Electricity (%)
House heating fuel used in houses and condos - Fuel oil, kerosene, etc. (%)
House heating fuel used in houses and condos - Coal or coke (%)
House heating fuel used in houses and condos - Wood (%)
House heating fuel used in houses and condos - Solar energy (%)
House heating fuel used in houses and condos - Other fuel (%)
House heating fuel used in houses and condos - No fuel used (%)
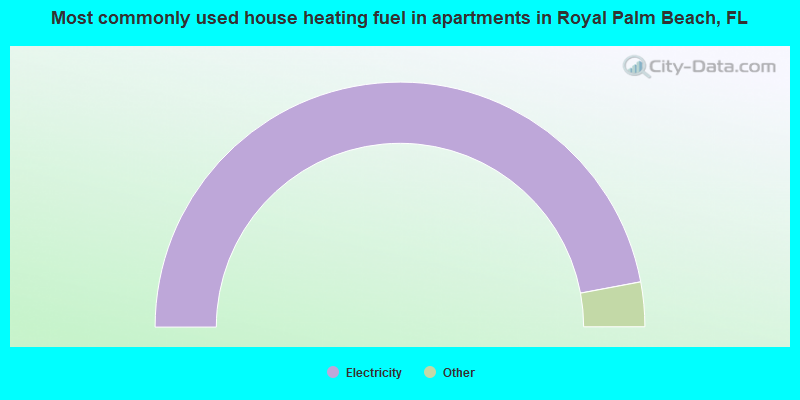
House heating fuel used in apartments - Utility gas (%)
House heating fuel used in apartments - Bottled, tank, or LP gas (%)
House heating fuel used in apartments - Electricity (%)
House heating fuel used in apartments - Fuel oil, kerosene, etc. (%)
House heating fuel used in apartments - Coal or coke (%)
House heating fuel used in apartments - Wood (%)
House heating fuel used in apartments - Solar energy (%)
House heating fuel used in apartments - Other fuel (%)
House heating fuel used in apartments - No fuel used (%)
Median year house/condo built: 1991Median year apartment built: 1993Household type by relationship:
Households: 39,489
Male householders: 5,681 (660 living alone ), Female householders: 7,585 (1,981 living alone )7,496 spouses (7,433 opposite-sex spouses ), 981 unmarried partners , (958 opposite-sex unmarried partners ), 12,804 children (12,082 natural , 238 adopted , 483 stepchildren ), 915 grandchildren , 481 brothers or sisters , 1,230 parents , 41 foster children , 966 other relatives , 1,114 non-relatives In group quarters: 190
Size of family households: 3,898 2-persons , 2,221 3-persons , 2,234 4-persons , 1,129 5-persons , 64 6-persons , 377 7-or-more-persons .
Size of nonfamily households: 2,717 1-person , 673 2-persons , 66 3-persons , 24 4-persons .
6,719 married couples with children. single-parent households (238 men , 1,096 women ).
69.0% of residents of Royal Palm Beach speak English at home. of residents speak Spanish at home (59% speak English very well , 26% speak English well , 11% speak English not well , 4% don't speak English at all ).of residents speak other Indo-European language at home (74% speak English very well , 7% speak English well , 13% speak English not well , 6% don't speak English at all ).of residents speak Asian or Pacific Island language at home (49% speak English very well , 30% speak English well , 12% speak English not well , 9% don't speak English at all ).of residents speak other language at home (100% speak English very well ).
Foreign born population: 11,253 (28.5%)of them are naturalized citizens )
Median number of rooms in houses and condos:
Median number of rooms in apartments
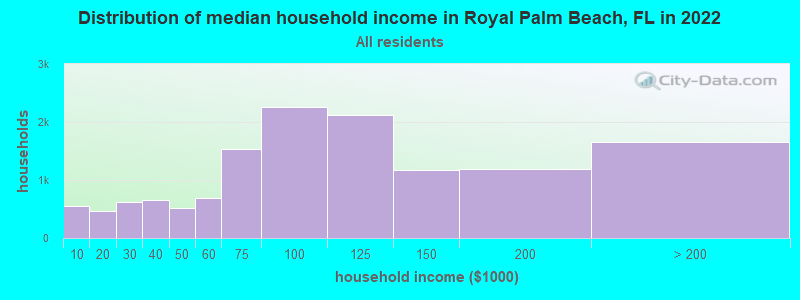
Royal Palm Beach, FL household income distribution 547 Less than $10,000461 $10,000 to $19,999617 $20,000 to $29,999652 $30,000 to $39,999524 $40,000 to $49,999685 $50,000 to $59,9991,542 $60,000 to $74,9992,257 $75,000 to $99,9992,128 $100,000 to $124,9991,177 $125,000 to $149,9991,192 $150,000 to $199,9991,648 $200,000 or more
Home value of owner - occupied houses in 2022 in Royal Palm Beach, FL 43 Less than $10,00017 $15,000 to $19,99935 $20,000 to $24,99930 $25,000 to $29,99926 $30,000 to $34,999184 $35,000 to $39,99941 $40,000 to $49,99963 $50,000 to $59,99948 $60,000 to $69,99924 $70,000 to $79,99933 $80,000 to $89,99935 $90,000 to $99,999138 $100,000 to $124,99993 $125,000 to $149,999230 $150,000 to $174,999384 $175,000 to $199,999660 $200,000 to $249,999846 $250,000 to $299,9992,895 $300,000 to $399,9992,237 $400,000 to $499,9991,666 $500,000 to $749,999115 $750,000 to $999,999101 $2,000,000 or moreRent paid by renters in 2022 in Royal Palm Beach, FL 9 $350 to $39926 $400 to $44947 $500 to $54913 $550 to $59945 $700 to $74917 $800 to $8993 $900 to $99994 $1,000 to $1,249339 $1,250 to $1,499725 $1,500 to $1,999788 $2,000 to $2,499300 $2,500 to $2,99997 $3,000 to $3,49913 $3,500 or more202 No cash rent
Percentage of workers working in this county: 94.0%Number of people working at home: 1,713 (8.2% of all workers )
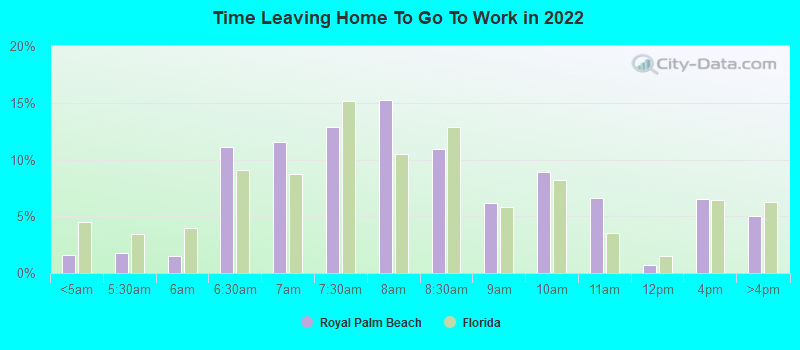
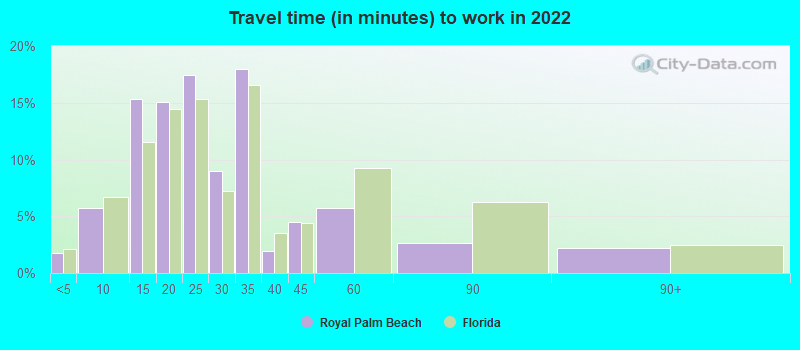
Travel time to work (commute)
Less than 5 minutes: 2335 to 9 minutes: 64910 to 14 minutes: 2,01615 to 19 minutes: 2,01620 to 24 minutes: 1,86325 to 29 minutes: 1,25930 to 34 minutes: 4,62735 to 39 minutes: 97440 to 44 minutes: 1,16045 to 59 minutes: 2,97260 to 89 minutes: 82890 or more minutes: 269
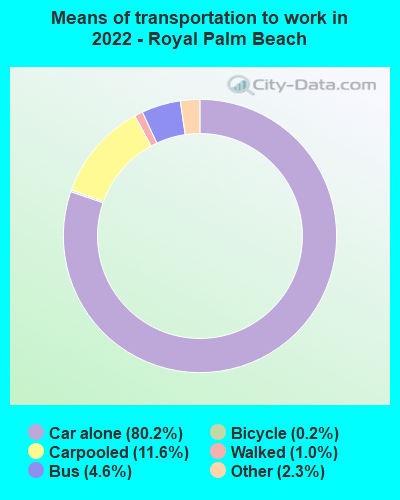
Means of transportation to work:
Drove a car alone: 9,931 (70.3%)Carpooled: 1,362 (9.6%)Bus : 416 (2.9%)Taxi: 346 (2.5%)Bicycle: 26 (0.2%)Walked: 137 (1.0%)Worked at home: 1,713 (12.1%)
Unemployment by race in 2022
Unemployment rate for White non-Hispanic residents 1.5% Males3.4% FemalesUnemployment rate for Black residents 4.3% Males6.4% FemalesUnemployment rate for Asian residents 10.4% Males3.0% FemalesUnemployment rate for two or more race residents 1.1% Males4.8% FemalesUnemployment rate for Hispanic or Latino residents 3.0% Males1.2% Females
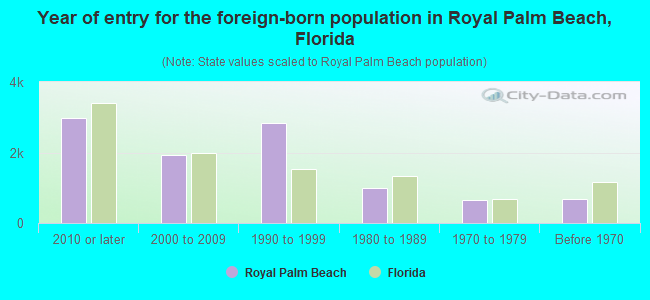
Year of entry for the foreign-born population in Royal Palm Beach, Florida
2,992 2010 or later 1,916 2000 to 2009 2,844 1990 to 1999 993 1980 to 1989 642 1970 to 1979 674 Before 1970
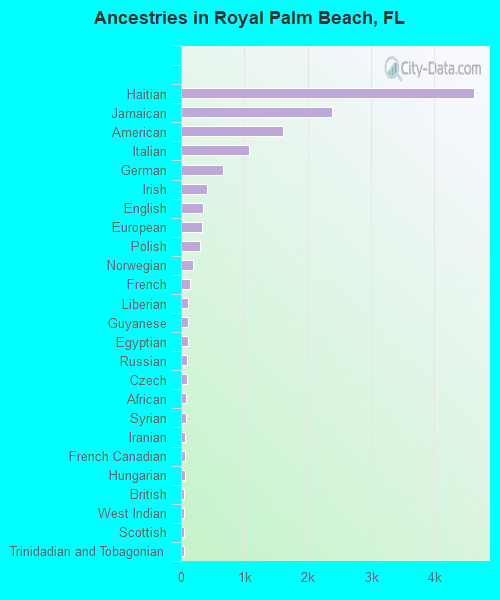
First ancestries reported:
Haitian: 4,630 (19.8%)
Jamaican: 2,391 (10.2%)
American: 1,611 (6.9%)
Italian: 1,076 (4.6%)
German: 657 (2.8%)
Irish: 418 (1.8%)
English: 354 (1.5%)
European: 331 (1.4%)
Polish: 294 (1.3%)
Norwegian: 195 (0.8%)
French: 137 (0.6%)
Liberian: 118 (0.5%)
Guyanese: 107 (0.5%)
Egyptian: 105 (0.5%)
Russian: 92 (0.4%)
Czech: 91 (0.4%)
African: 85 (0.4%)
Syrian: 79 (0.3%)
Iranian: 68 (0.3%)
French Canadian: 64 (0.3%)
Hungarian: 63 (0.3%)
British: 53 (0.2%)
West Indian: 53 (0.2%)
Scottish: 43 (0.2%)
Trinidadian and Tobagonian: 43 (0.2%)
Dutch: 42 (0.2%)
Bahamian: 39 (0.2%)
Brazilian: 38 (0.2%)
Lebanese: 32 (0.1%)
Serbian: 31 (0.1%)
Welsh: 29 (0.1%)
Ukrainian: 27 (0.1%)
Eastern European: 26 (0.1%)
Greek: 25 (0.1%)
Macedonian: 21 (0.09%)
Austrian: 21 (0.09%)
Belgian: 18 (0.08%)
Assyrian: 10 (0.04%)
Northern European: 9 (0.04%)
Yugoslavian: 9 (0.04%)
Basque: 8 (0.03%)
Slavic: 5 (0.02%) Most common places of birth for foreign-born residents (%): Haiti Royal Palm Beach:
20.6% (2,319)Florida:
7.5% (342,375)
Jamaica Royal Palm Beach:
20.6% (2,313)Florida:
5.0% (227,319)
Cuba Royal Palm Beach:
6.5% (736)Florida:
22.0% (1,006,576)
Colombia Royal Palm Beach:
6.2% (692)Florida:
6.5% (298,669)
Venezuela Royal Palm Beach:
6.0% (670)Florida:
5.7% (262,042)
Vietnam Royal Palm Beach:
3.0% (342)Florida:
1.3% (60,604)
Ecuador Royal Palm Beach:
2.9% (329)Florida:
1.2% (54,585)
Dominican Republic Royal Palm Beach:
2.8% (313)Florida:
3.0% (137,727)
Korea Royal Palm Beach:
2.6% (291)Florida:
0.4% (19,445)
Guyana Royal Palm Beach:
2.6% (291)Florida:
0.7% (33,556)
Trinidad and Tobago Royal Palm Beach:
2.3% (264)Florida:
1.0% (43,642)
Honduras Royal Palm Beach:
2.2% (250)Florida:
2.3% (107,160)
Guatemala Royal Palm Beach:
2.0% (222)Florida:
2.1% (97,632)
Syria Royal Palm Beach:
1.9% (218)Florida:
0.2% (7,299)
Place of birth for U.S.-born residents:
This state: 14,244Other state: 12,012Northeast: 6,879Midwest: 2,111South: 2,488West: 510 90.8% of Royal Palm Beach residents lived in the same house 1 years ago.
Out of people who lived in different houses, 34.9% lived in this county.
Out of people who lived in different counties, 44.4% lived in Florida.
Royal Palm Beach:
90.8%State average:
86.3%
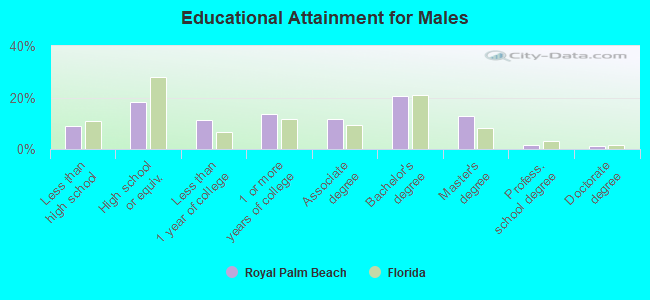
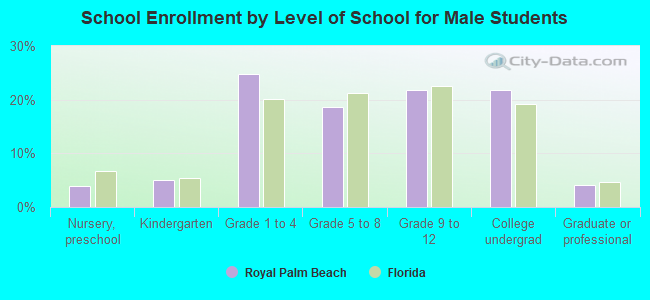
Education attainment for males 25 years and older:
No schooling: 331Nursery to 4th grade: 05th and 6th grade: 507th and 8th grade: 859th grade: 8710th grade: 14011th grade: 15312th grade, no diploma: 280High school graduate (or equivalency): 2,281Less than 1 year of college: 1,418Some college more than 1 year, no degree: 1,715Associate degree: 1,454Bachelor's degree: 2,597Master's degree: 1,610Professional school degree: 184Doctorate degree: 170
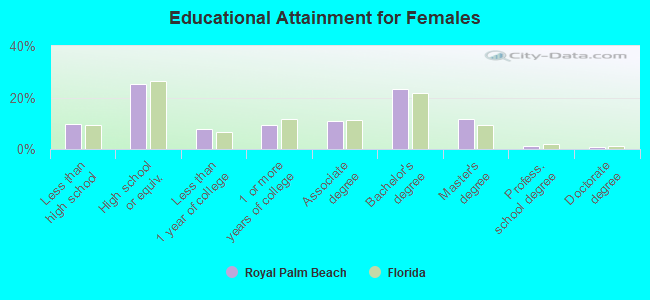
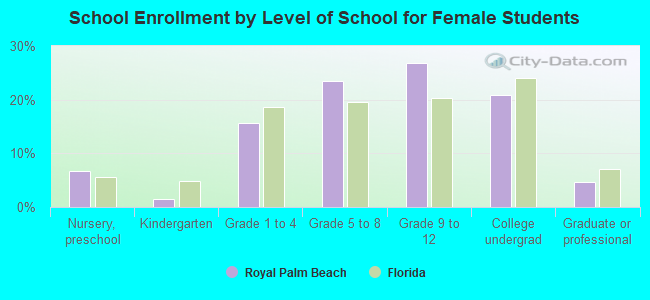
Education attainment for females 25 years and older:
No schooling: 429Nursery to 4th grade: 345th and 6th grade: 467th and 8th grade: 2709th grade: 6710th grade: 20111th grade: 12012th grade, no diploma: 318High school graduate (or equivalency): 3,781Less than 1 year of college: 1,151Some college more than 1 year, no degree: 1,426Associate degree: 1,641Bachelor's degree: 3,536Master's degree: 1,758Professional school degree: 181Doctorate degree: 96
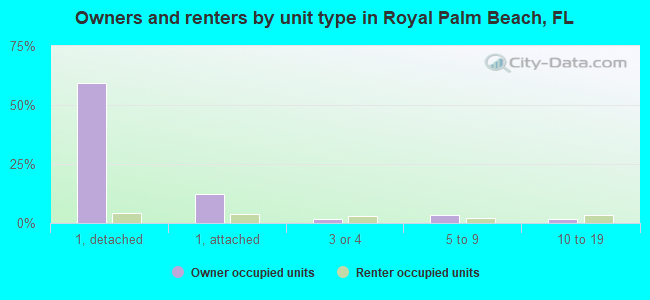
Housing units in structures:
One, detached: 8,927One, attached: 2,2663 or 4: 6375 to 9: 85410 to 19: 72520 to 49: 25650 or more: 200Mobile homes: 206House/condo owner moved in on average 9 years ago
Renter moved in on average 1 years ago
Private vs. public school enrollment:
Students in private schools in grades 1 to 8 (elementary and middle school): 339 Students in private schools in grades 9 to 12 (high school): 302 Students in private undergraduate colleges: 438