Royal Palm Beach, Florida Submit your own pictures of this village and show them to the world
OSM Map
General Map
Google Map
MSN Map
OSM Map
General Map
Google Map
MSN Map
OSM Map
General Map
Google Map
MSN Map
OSM Map
General Map
Google Map
MSN Map
Please wait while loading the map...
Population in 2022: 39,259 (100% urban, 0% rural). Population change since 2000: +82.4%Males: 18,710 Females: 20,549
March 2022 cost of living index in Royal Palm Beach: 101.4 (near average, U.S. average is 100) Percentage of residents living in poverty in 2022: 5.3%for White Non-Hispanic residents , 3.9% for Black residents , 8.7% for Hispanic or Latino residents , 9.4% for other race residents , 13.2% for two or more races residents )
Profiles of local businesses
Business Search - 14 Million verified businesses
Data:
Median household income ($)
Median household income (% change since 2000)
Household income diversity
Ratio of average income to average house value (%)
Ratio of average income to average rent
Median household income ($) - White
Median household income ($) - Black or African American
Median household income ($) - Asian
Median household income ($) - Hispanic or Latino
Median household income ($) - American Indian and Alaska Native
Median household income ($) - Multirace
Median household income ($) - Other Race
Median household income for houses/condos with a mortgage ($)
Median household income for apartments without a mortgage ($)
Races - White alone (%)
Races - White alone (% change since 2000)
Races - Black alone (%)
Races - Black alone (% change since 2000)
Races - American Indian alone (%)
Races - American Indian alone (% change since 2000)
Races - Asian alone (%)
Races - Asian alone (% change since 2000)
Races - Hispanic (%)
Races - Hispanic (% change since 2000)
Races - Native Hawaiian and Other Pacific Islander alone (%)
Races - Native Hawaiian and Other Pacific Islander alone (% change since 2000)
Races - Two or more races (%)
Races - Two or more races (% change since 2000)
Races - Other race alone (%)
Races - Other race alone (% change since 2000)
Racial diversity
Unemployment (%)
Unemployment (% change since 2000)
Unemployment (%) - White
Unemployment (%) - Black or African American
Unemployment (%) - Asian
Unemployment (%) - Hispanic or Latino
Unemployment (%) - American Indian and Alaska Native
Unemployment (%) - Multirace
Unemployment (%) - Other Race
Population density (people per square mile)
Population - Males (%)
Population - Females (%)
Population - Males (%) - White
Population - Males (%) - Black or African American
Population - Males (%) - Asian
Population - Males (%) - Hispanic or Latino
Population - Males (%) - American Indian and Alaska Native
Population - Males (%) - Multirace
Population - Males (%) - Other Race
Population - Females (%) - White
Population - Females (%) - Black or African American
Population - Females (%) - Asian
Population - Females (%) - Hispanic or Latino
Population - Females (%) - American Indian and Alaska Native
Population - Females (%) - Multirace
Population - Females (%) - Other Race
Coronavirus confirmed cases (May 04, 2024)
Deaths caused by coronavirus (May 04, 2024)
Coronavirus confirmed cases (per 100k population) (May 04, 2024)
Deaths caused by coronavirus (per 100k population) (May 04, 2024)
Daily increase in number of cases (May 04, 2024)
Weekly increase in number of cases (May 04, 2024)
Cases doubled (in days) (May 04, 2024)
Hospitalized patients (Apr 18, 2022)
Negative test results (Apr 18, 2022)
Total test results (Apr 18, 2022)
COVID Vaccine doses distributed (per 100k population) (Sep 19, 2023)
COVID Vaccine doses administered (per 100k population) (Sep 19, 2023)
COVID Vaccine doses distributed (Sep 19, 2023)
COVID Vaccine doses administered (Sep 19, 2023)
Likely homosexual households (%)
Likely homosexual households (% change since 2000)
Likely homosexual households - Lesbian couples (%)
Likely homosexual households - Lesbian couples (% change since 2000)
Likely homosexual households - Gay men (%)
Likely homosexual households - Gay men (% change since 2000)
Cost of living index
Median gross rent ($)
Median contract rent ($)
Median monthly housing costs ($)
Median house or condo value ($)
Median house or condo value ($ change since 2000)
Mean house or condo value by units in structure - 1, detached ($)
Mean house or condo value by units in structure - 1, attached ($)
Mean house or condo value by units in structure - 2 ($)
Mean house or condo value by units in structure by units in structure - 3 or 4 ($)
Mean house or condo value by units in structure - 5 or more ($)
Mean house or condo value by units in structure - Boat, RV, van, etc. ($)
Mean house or condo value by units in structure - Mobile home ($)
Median house or condo value ($) - White
Median house or condo value ($) - Black or African American
Median house or condo value ($) - Asian
Median house or condo value ($) - Hispanic or Latino
Median house or condo value ($) - American Indian and Alaska Native
Median house or condo value ($) - Multirace
Median house or condo value ($) - Other Race
Median resident age
Resident age diversity
Median resident age - Males
Median resident age - Females
Median resident age - White
Median resident age - Black or African American
Median resident age - Asian
Median resident age - Hispanic or Latino
Median resident age - American Indian and Alaska Native
Median resident age - Multirace
Median resident age - Other Race
Median resident age - Males - White
Median resident age - Males - Black or African American
Median resident age - Males - Asian
Median resident age - Males - Hispanic or Latino
Median resident age - Males - American Indian and Alaska Native
Median resident age - Males - Multirace
Median resident age - Males - Other Race
Median resident age - Females - White
Median resident age - Females - Black or African American
Median resident age - Females - Asian
Median resident age - Females - Hispanic or Latino
Median resident age - Females - American Indian and Alaska Native
Median resident age - Females - Multirace
Median resident age - Females - Other Race
Commute - mean travel time to work (minutes)
Travel time to work - Less than 5 minutes (%)
Travel time to work - Less than 5 minutes (% change since 2000)
Travel time to work - 5 to 9 minutes (%)
Travel time to work - 5 to 9 minutes (% change since 2000)
Travel time to work - 10 to 19 minutes (%)
Travel time to work - 10 to 19 minutes (% change since 2000)
Travel time to work - 20 to 29 minutes (%)
Travel time to work - 20 to 29 minutes (% change since 2000)
Travel time to work - 30 to 39 minutes (%)
Travel time to work - 30 to 39 minutes (% change since 2000)
Travel time to work - 40 to 59 minutes (%)
Travel time to work - 40 to 59 minutes (% change since 2000)
Travel time to work - 60 to 89 minutes (%)
Travel time to work - 60 to 89 minutes (% change since 2000)
Travel time to work - 90 or more minutes (%)
Travel time to work - 90 or more minutes (% change since 2000)
Marital status - Never married (%)
Marital status - Now married (%)
Marital status - Separated (%)
Marital status - Widowed (%)
Marital status - Divorced (%)
Median family income ($)
Median family income (% change since 2000)
Median non-family income ($)
Median non-family income (% change since 2000)
Median per capita income ($)
Median per capita income (% change since 2000)
Median family income ($) - White
Median family income ($) - Black or African American
Median family income ($) - Asian
Median family income ($) - Hispanic or Latino
Median family income ($) - American Indian and Alaska Native
Median family income ($) - Multirace
Median family income ($) - Other Race
Median year house/condo built
Median year apartment built
Year house built - Built 2005 or later (%)
Year house built - Built 2000 to 2004 (%)
Year house built - Built 1990 to 1999 (%)
Year house built - Built 1980 to 1989 (%)
Year house built - Built 1970 to 1979 (%)
Year house built - Built 1960 to 1969 (%)
Year house built - Built 1950 to 1959 (%)
Year house built - Built 1940 to 1949 (%)
Year house built - Built 1939 or earlier (%)
Average household size
Household density (households per square mile)
Average household size - White
Average household size - Black or African American
Average household size - Asian
Average household size - Hispanic or Latino
Average household size - American Indian and Alaska Native
Average household size - Multirace
Average household size - Other Race
Occupied housing units (%)
Vacant housing units (%)
Owner occupied housing units (%)
Renter occupied housing units (%)
Vacancy status - For rent (%)
Vacancy status - For sale only (%)
Vacancy status - Rented or sold, not occupied (%)
Vacancy status - For seasonal, recreational, or occasional use (%)
Vacancy status - For migrant workers (%)
Vacancy status - Other vacant (%)
Residents with income below the poverty level (%)
Residents with income below 50% of the poverty level (%)
Children below poverty level (%)
Poor families by family type - Married-couple family (%)
Poor families by family type - Male, no wife present (%)
Poor families by family type - Female, no husband present (%)
Poverty status for native-born residents (%)
Poverty status for foreign-born residents (%)
Poverty among high school graduates not in families (%)
Poverty among people who did not graduate high school not in families (%)
Residents with income below the poverty level (%) - White
Residents with income below the poverty level (%) - Black or African American
Residents with income below the poverty level (%) - Asian
Residents with income below the poverty level (%) - Hispanic or Latino
Residents with income below the poverty level (%) - American Indian and Alaska Native
Residents with income below the poverty level (%) - Multirace
Residents with income below the poverty level (%) - Other Race
Air pollution - Air Quality Index (AQI)
Air pollution - CO
Air pollution - NO2
Air pollution - SO2
Air pollution - Ozone
Air pollution - PM10
Air pollution - PM25
Air pollution - Pb
Crime - Murders per 100,000 population
Crime - Rapes per 100,000 population
Crime - Robberies per 100,000 population
Crime - Assaults per 100,000 population
Crime - Burglaries per 100,000 population
Crime - Thefts per 100,000 population
Crime - Auto thefts per 100,000 population
Crime - Arson per 100,000 population
Crime - City-data.com crime index
Crime - Violent crime index
Crime - Property crime index
Crime - Murders per 100,000 population (5 year average)
Crime - Rapes per 100,000 population (5 year average)
Crime - Robberies per 100,000 population (5 year average)
Crime - Assaults per 100,000 population (5 year average)
Crime - Burglaries per 100,000 population (5 year average)
Crime - Thefts per 100,000 population (5 year average)
Crime - Auto thefts per 100,000 population (5 year average)
Crime - Arson per 100,000 population (5 year average)
Crime - City-data.com crime index (5 year average)
Crime - Violent crime index (5 year average)
Crime - Property crime index (5 year average)
1996 Presidential Elections Results (%) - Democratic Party (Clinton)
1996 Presidential Elections Results (%) - Republican Party (Dole)
1996 Presidential Elections Results (%) - Other
2000 Presidential Elections Results (%) - Democratic Party (Gore)
2000 Presidential Elections Results (%) - Republican Party (Bush)
2000 Presidential Elections Results (%) - Other
2004 Presidential Elections Results (%) - Democratic Party (Kerry)
2004 Presidential Elections Results (%) - Republican Party (Bush)
2004 Presidential Elections Results (%) - Other
2008 Presidential Elections Results (%) - Democratic Party (Obama)
2008 Presidential Elections Results (%) - Republican Party (McCain)
2008 Presidential Elections Results (%) - Other
2012 Presidential Elections Results (%) - Democratic Party (Obama)
2012 Presidential Elections Results (%) - Republican Party (Romney)
2012 Presidential Elections Results (%) - Other
2016 Presidential Elections Results (%) - Democratic Party (Clinton)
2016 Presidential Elections Results (%) - Republican Party (Trump)
2016 Presidential Elections Results (%) - Other
2020 Presidential Elections Results (%) - Democratic Party (Biden)
2020 Presidential Elections Results (%) - Republican Party (Trump)
2020 Presidential Elections Results (%) - Other
Ancestries Reported - Arab (%)
Ancestries Reported - Czech (%)
Ancestries Reported - Danish (%)
Ancestries Reported - Dutch (%)
Ancestries Reported - English (%)
Ancestries Reported - French (%)
Ancestries Reported - French Canadian (%)
Ancestries Reported - German (%)
Ancestries Reported - Greek (%)
Ancestries Reported - Hungarian (%)
Ancestries Reported - Irish (%)
Ancestries Reported - Italian (%)
Ancestries Reported - Lithuanian (%)
Ancestries Reported - Norwegian (%)
Ancestries Reported - Polish (%)
Ancestries Reported - Portuguese (%)
Ancestries Reported - Russian (%)
Ancestries Reported - Scotch-Irish (%)
Ancestries Reported - Scottish (%)
Ancestries Reported - Slovak (%)
Ancestries Reported - Subsaharan African (%)
Ancestries Reported - Swedish (%)
Ancestries Reported - Swiss (%)
Ancestries Reported - Ukrainian (%)
Ancestries Reported - United States (%)
Ancestries Reported - Welsh (%)
Ancestries Reported - West Indian (%)
Ancestries Reported - Other (%)
Educational Attainment - No schooling completed (%)
Educational Attainment - Less than high school (%)
Educational Attainment - High school or equivalent (%)
Educational Attainment - Less than 1 year of college (%)
Educational Attainment - 1 or more years of college (%)
Educational Attainment - Associate degree (%)
Educational Attainment - Bachelor's degree (%)
Educational Attainment - Master's degree (%)
Educational Attainment - Professional school degree (%)
Educational Attainment - Doctorate degree (%)
School Enrollment - Nursery, preschool (%)
School Enrollment - Kindergarten (%)
School Enrollment - Grade 1 to 4 (%)
School Enrollment - Grade 5 to 8 (%)
School Enrollment - Grade 9 to 12 (%)
School Enrollment - College undergrad (%)
School Enrollment - Graduate or professional (%)
School Enrollment - Not enrolled in school (%)
School enrollment - Public schools (%)
School enrollment - Private schools (%)
School enrollment - Not enrolled (%)
Median number of rooms in houses and condos
Median number of rooms in apartments
Housing units lacking complete plumbing facilities (%)
Housing units lacking complete kitchen facilities (%)
Density of houses
Urban houses (%)
Rural houses (%)
Households with people 60 years and over (%)
Households with people 65 years and over (%)
Households with people 75 years and over (%)
Households with one or more nonrelatives (%)
Households with no nonrelatives (%)
Population in households (%)
Family households (%)
Nonfamily households (%)
Population in families (%)
Family households with own children (%)
Median number of bedrooms in owner occupied houses
Mean number of bedrooms in owner occupied houses
Median number of bedrooms in renter occupied houses
Mean number of bedrooms in renter occupied houses
Median number of vehichles in owner occupied houses
Mean number of vehichles in owner occupied houses
Median number of vehichles in renter occupied houses
Mean number of vehichles in renter occupied houses
Mortgage status - with mortgage (%)
Mortgage status - with second mortgage (%)
Mortgage status - with home equity loan (%)
Mortgage status - with both second mortgage and home equity loan (%)
Mortgage status - without a mortgage (%)
Average family size
Average family size - White
Average family size - Black or African American
Average family size - Asian
Average family size - Hispanic or Latino
Average family size - American Indian and Alaska Native
Average family size - Multirace
Average family size - Other Race
Geographical mobility - Same house 1 year ago (%)
Geographical mobility - Moved within same county (%)
Geographical mobility - Moved from different county within same state (%)
Geographical mobility - Moved from different state (%)
Geographical mobility - Moved from abroad (%)
Place of birth - Born in state of residence (%)
Place of birth - Born in other state (%)
Place of birth - Native, outside of US (%)
Place of birth - Foreign born (%)
Housing units in structures - 1, detached (%)
Housing units in structures - 1, attached (%)
Housing units in structures - 2 (%)
Housing units in structures - 3 or 4 (%)
Housing units in structures - 5 to 9 (%)
Housing units in structures - 10 to 19 (%)
Housing units in structures - 20 to 49 (%)
Housing units in structures - 50 or more (%)
Housing units in structures - Mobile home (%)
Housing units in structures - Boat, RV, van, etc. (%)
House/condo owner moved in on average (years ago)
Renter moved in on average (years ago)
Year householder moved into unit - Moved in 1999 to March 2000 (%)
Year householder moved into unit - Moved in 1995 to 1998 (%)
Year householder moved into unit - Moved in 1990 to 1994 (%)
Year householder moved into unit - Moved in 1980 to 1989 (%)
Year householder moved into unit - Moved in 1970 to 1979 (%)
Year householder moved into unit - Moved in 1969 or earlier (%)
Means of transportation to work - Drove car alone (%)
Means of transportation to work - Carpooled (%)
Means of transportation to work - Public transportation (%)
Means of transportation to work - Bus or trolley bus (%)
Means of transportation to work - Streetcar or trolley car (%)
Means of transportation to work - Subway or elevated (%)
Means of transportation to work - Railroad (%)
Means of transportation to work - Ferryboat (%)
Means of transportation to work - Taxicab (%)
Means of transportation to work - Motorcycle (%)
Means of transportation to work - Bicycle (%)
Means of transportation to work - Walked (%)
Means of transportation to work - Other means (%)
Working at home (%)
Industry diversity
Most Common Industries - Agriculture, forestry, fishing and hunting, and mining (%)
Most Common Industries - Agriculture, forestry, fishing and hunting (%)
Most Common Industries - Mining, quarrying, and oil and gas extraction (%)
Most Common Industries - Construction (%)
Most Common Industries - Manufacturing (%)
Most Common Industries - Wholesale trade (%)
Most Common Industries - Retail trade (%)
Most Common Industries - Transportation and warehousing, and utilities (%)
Most Common Industries - Transportation and warehousing (%)
Most Common Industries - Utilities (%)
Most Common Industries - Information (%)
Most Common Industries - Finance and insurance, and real estate and rental and leasing (%)
Most Common Industries - Finance and insurance (%)
Most Common Industries - Real estate and rental and leasing (%)
Most Common Industries - Professional, scientific, and management, and administrative and waste management services (%)
Most Common Industries - Professional, scientific, and technical services (%)
Most Common Industries - Management of companies and enterprises (%)
Most Common Industries - Administrative and support and waste management services (%)
Most Common Industries - Educational services, and health care and social assistance (%)
Most Common Industries - Educational services (%)
Most Common Industries - Health care and social assistance (%)
Most Common Industries - Arts, entertainment, and recreation, and accommodation and food services (%)
Most Common Industries - Arts, entertainment, and recreation (%)
Most Common Industries - Accommodation and food services (%)
Most Common Industries - Other services, except public administration (%)
Most Common Industries - Public administration (%)
Occupation diversity
Most Common Occupations - Management, business, science, and arts occupations (%)
Most Common Occupations - Management, business, and financial occupations (%)
Most Common Occupations - Management occupations (%)
Most Common Occupations - Business and financial operations occupations (%)
Most Common Occupations - Computer, engineering, and science occupations (%)
Most Common Occupations - Computer and mathematical occupations (%)
Most Common Occupations - Architecture and engineering occupations (%)
Most Common Occupations - Life, physical, and social science occupations (%)
Most Common Occupations - Education, legal, community service, arts, and media occupations (%)
Most Common Occupations - Community and social service occupations (%)
Most Common Occupations - Legal occupations (%)
Most Common Occupations - Education, training, and library occupations (%)
Most Common Occupations - Arts, design, entertainment, sports, and media occupations (%)
Most Common Occupations - Healthcare practitioners and technical occupations (%)
Most Common Occupations - Health diagnosing and treating practitioners and other technical occupations (%)
Most Common Occupations - Health technologists and technicians (%)
Most Common Occupations - Service occupations (%)
Most Common Occupations - Healthcare support occupations (%)
Most Common Occupations - Protective service occupations (%)
Most Common Occupations - Fire fighting and prevention, and other protective service workers including supervisors (%)
Most Common Occupations - Law enforcement workers including supervisors (%)
Most Common Occupations - Food preparation and serving related occupations (%)
Most Common Occupations - Building and grounds cleaning and maintenance occupations (%)
Most Common Occupations - Personal care and service occupations (%)
Most Common Occupations - Sales and office occupations (%)
Most Common Occupations - Sales and related occupations (%)
Most Common Occupations - Office and administrative support occupations (%)
Most Common Occupations - Natural resources, construction, and maintenance occupations (%)
Most Common Occupations - Farming, fishing, and forestry occupations (%)
Most Common Occupations - Construction and extraction occupations (%)
Most Common Occupations - Installation, maintenance, and repair occupations (%)
Most Common Occupations - Production, transportation, and material moving occupations (%)
Most Common Occupations - Production occupations (%)
Most Common Occupations - Transportation occupations (%)
Most Common Occupations - Material moving occupations (%)
People in Group quarters - Institutionalized population (%)
People in Group quarters - Correctional institutions (%)
People in Group quarters - Federal prisons and detention centers (%)
People in Group quarters - Halfway houses (%)
People in Group quarters - Local jails and other confinement facilities (including police lockups) (%)
People in Group quarters - Military disciplinary barracks (%)
People in Group quarters - State prisons (%)
People in Group quarters - Other types of correctional institutions (%)
People in Group quarters - Nursing homes (%)
People in Group quarters - Hospitals/wards, hospices, and schools for the handicapped (%)
People in Group quarters - Hospitals/wards and hospices for chronically ill (%)
People in Group quarters - Hospices or homes for chronically ill (%)
People in Group quarters - Military hospitals or wards for chronically ill (%)
People in Group quarters - Other hospitals or wards for chronically ill (%)
People in Group quarters - Hospitals or wards for drug/alcohol abuse (%)
People in Group quarters - Mental (Psychiatric) hospitals or wards (%)
People in Group quarters - Schools, hospitals, or wards for the mentally retarded (%)
People in Group quarters - Schools, hospitals, or wards for the physically handicapped (%)
People in Group quarters - Institutions for the deaf (%)
People in Group quarters - Institutions for the blind (%)
People in Group quarters - Orthopedic wards and institutions for the physically handicapped (%)
People in Group quarters - Wards in general hospitals for patients who have no usual home elsewhere (%)
People in Group quarters - Wards in military hospitals for patients who have no usual home elsewhere (%)
People in Group quarters - Juvenile institutions (%)
People in Group quarters - Long-term care (%)
People in Group quarters - Homes for abused, dependent, and neglected children (%)
People in Group quarters - Residential treatment centers for emotionally disturbed children (%)
People in Group quarters - Training schools for juvenile delinquents (%)
People in Group quarters - Short-term care, detention or diagnostic centers for delinquent children (%)
People in Group quarters - Type of juvenile institution unknown (%)
People in Group quarters - Noninstitutionalized population (%)
People in Group quarters - College dormitories (includes college quarters off campus) (%)
People in Group quarters - Military quarters (%)
People in Group quarters - On base (%)
People in Group quarters - Barracks, unaccompanied personnel housing (UPH), (Enlisted/Officer), ;and similar group living quarters for military personnel (%)
People in Group quarters - Transient quarters for temporary residents (%)
People in Group quarters - Military ships (%)
People in Group quarters - Group homes (%)
People in Group quarters - Homes or halfway houses for drug/alcohol abuse (%)
People in Group quarters - Homes for the mentally ill (%)
People in Group quarters - Homes for the mentally retarded (%)
People in Group quarters - Homes for the physically handicapped (%)
People in Group quarters - Other group homes (%)
People in Group quarters - Religious group quarters (%)
People in Group quarters - Dormitories (%)
People in Group quarters - Agriculture workers' dormitories on farms (%)
People in Group quarters - Job Corps and vocational training facilities (%)
People in Group quarters - Other workers' dormitories (%)
People in Group quarters - Crews of maritime vessels (%)
People in Group quarters - Other nonhousehold living situations (%)
People in Group quarters - Other noninstitutional group quarters (%)
Residents speaking English at home (%)
Residents speaking English at home - Born in the United States (%)
Residents speaking English at home - Native, born elsewhere (%)
Residents speaking English at home - Foreign born (%)
Residents speaking Spanish at home (%)
Residents speaking Spanish at home - Born in the United States (%)
Residents speaking Spanish at home - Native, born elsewhere (%)
Residents speaking Spanish at home - Foreign born (%)
Residents speaking other language at home (%)
Residents speaking other language at home - Born in the United States (%)
Residents speaking other language at home - Native, born elsewhere (%)
Residents speaking other language at home - Foreign born (%)
Class of Workers - Employee of private company (%)
Class of Workers - Self-employed in own incorporated business (%)
Class of Workers - Private not-for-profit wage and salary workers (%)
Class of Workers - Local government workers (%)
Class of Workers - State government workers (%)
Class of Workers - Federal government workers (%)
Class of Workers - Self-employed workers in own not incorporated business and Unpaid family workers (%)
House heating fuel used in houses and condos - Utility gas (%)
House heating fuel used in houses and condos - Bottled, tank, or LP gas (%)
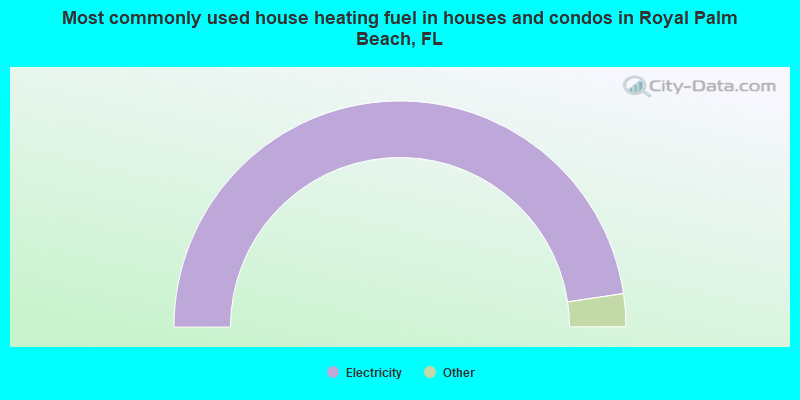
House heating fuel used in houses and condos - Electricity (%)
House heating fuel used in houses and condos - Fuel oil, kerosene, etc. (%)
House heating fuel used in houses and condos - Coal or coke (%)
House heating fuel used in houses and condos - Wood (%)
House heating fuel used in houses and condos - Solar energy (%)
House heating fuel used in houses and condos - Other fuel (%)
House heating fuel used in houses and condos - No fuel used (%)
House heating fuel used in apartments - Utility gas (%)
House heating fuel used in apartments - Bottled, tank, or LP gas (%)
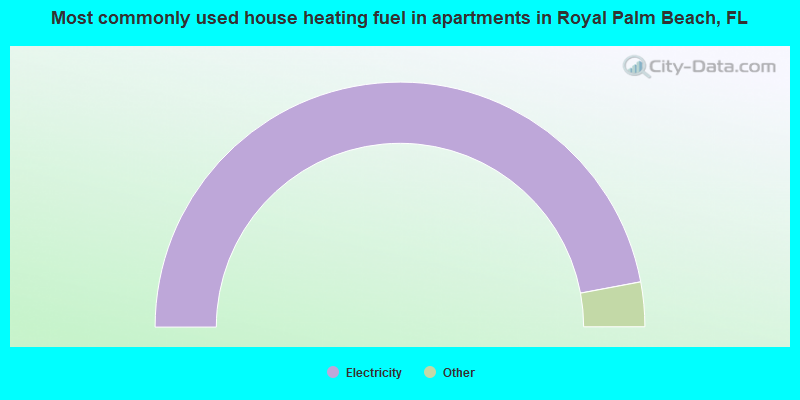
House heating fuel used in apartments - Electricity (%)
House heating fuel used in apartments - Fuel oil, kerosene, etc. (%)
House heating fuel used in apartments - Coal or coke (%)
House heating fuel used in apartments - Wood (%)
House heating fuel used in apartments - Solar energy (%)
House heating fuel used in apartments - Other fuel (%)
House heating fuel used in apartments - No fuel used (%)
Armed forces status - In Armed Forces (%)
Armed forces status - Civilian (%)
Armed forces status - Civilian - Veteran (%)
Armed forces status - Civilian - Nonveteran (%)
Fatal accidents locations in years 2005-2021
Fatal accidents locations in 2005
Fatal accidents locations in 2006
Fatal accidents locations in 2007
Fatal accidents locations in 2008
Fatal accidents locations in 2009
Fatal accidents locations in 2010
Fatal accidents locations in 2011
Fatal accidents locations in 2012
Fatal accidents locations in 2013
Fatal accidents locations in 2014
Fatal accidents locations in 2015
Fatal accidents locations in 2016
Fatal accidents locations in 2017
Fatal accidents locations in 2018
Fatal accidents locations in 2019
Fatal accidents locations in 2020
Fatal accidents locations in 2021
Alcohol use - People drinking some alcohol every month (%)
Alcohol use - People not drinking at all (%)
Alcohol use - Average days/month drinking alcohol
Alcohol use - Average drinks/week
Alcohol use - Average days/year people drink much
Audiometry - Average condition of hearing (%)
Audiometry - People that can hear a whisper from across a quiet room (%)
Audiometry - People that can hear normal voice from across a quiet room (%)
Audiometry - Ears ringing, roaring, buzzing (%)
Audiometry - Had a job exposure to loud noise (%)
Audiometry - Had off-work exposure to loud noise (%)
Blood Pressure & Cholesterol - Has high blood pressure (%)
Blood Pressure & Cholesterol - Checking blood pressure at home (%)
Blood Pressure & Cholesterol - Frequently checking blood cholesterol (%)
Blood Pressure & Cholesterol - Has high cholesterol level (%)
Consumer Behavior - Money monthly spent on food at supermarket/grocery store
Consumer Behavior - Money monthly spent on food at other stores
Consumer Behavior - Money monthly spent on eating out
Consumer Behavior - Money monthly spent on carryout/delivered foods
Consumer Behavior - Income spent on food at supermarket/grocery store (%)
Consumer Behavior - Income spent on food at other stores (%)
Consumer Behavior - Income spent on eating out (%)
Consumer Behavior - Income spent on carryout/delivered foods (%)
Current Health Status - General health condition (%)
Current Health Status - Blood donors (%)
Current Health Status - Has blood ever tested for HIV virus (%)
Current Health Status - Left-handed people (%)
Dermatology - People using sunscreen (%)
Diabetes - Diabetics (%)
Diabetes - Had a blood test for high blood sugar (%)
Diabetes - People taking insulin (%)
Diet Behavior & Nutrition - Diet health (%)
Diet Behavior & Nutrition - Milk product consumption (# of products/month)
Diet Behavior & Nutrition - Meals not home prepared (#/week)
Diet Behavior & Nutrition - Meals from fast food or pizza place (#/week)
Diet Behavior & Nutrition - Ready-to-eat foods (#/month)
Diet Behavior & Nutrition - Frozen meals/pizza (#/month)
Drug Use - People that ever used marijuana or hashish (%)
Drug Use - Ever used hard drugs (%)
Drug Use - Ever used any form of cocaine (%)
Drug Use - Ever used heroin (%)
Drug Use - Ever used methamphetamine (%)
Health Insurance - People covered by health insurance (%)
Kidney Conditions-Urology - Avg. # of times urinating at night
Medical Conditions - People with asthma (%)
Medical Conditions - People with anemia (%)
Medical Conditions - People with psoriasis (%)
Medical Conditions - People with overweight (%)
Medical Conditions - Elderly people having difficulties in thinking or remembering (%)
Medical Conditions - People who ever received blood transfusion (%)
Medical Conditions - People having trouble seeing even with glass/contacts (%)
Medical Conditions - People with arthritis (%)
Medical Conditions - People with gout (%)
Medical Conditions - People with congestive heart failure (%)
Medical Conditions - People with coronary heart disease (%)
Medical Conditions - People with angina pectoris (%)
Medical Conditions - People who ever had heart attack (%)
Medical Conditions - People who ever had stroke (%)
Medical Conditions - People with emphysema (%)
Medical Conditions - People with thyroid problem (%)
Medical Conditions - People with chronic bronchitis (%)
Medical Conditions - People with any liver condition (%)
Medical Conditions - People who ever had cancer or malignancy (%)
Mental Health - People who have little interest in doing things (%)
Mental Health - People feeling down, depressed, or hopeless (%)
Mental Health - People who have trouble sleeping or sleeping too much (%)
Mental Health - People feeling tired or having little energy (%)
Mental Health - People with poor appetite or overeating (%)
Mental Health - People feeling bad about themself (%)
Mental Health - People who have trouble concentrating on things (%)
Mental Health - People moving or speaking slowly or too fast (%)
Mental Health - People having thoughts they would be better off dead (%)
Oral Health - Average years since last visit a dentist
Oral Health - People embarrassed because of mouth (%)
Oral Health - People with gum disease (%)
Oral Health - General health of teeth and gums (%)
Oral Health - Average days a week using dental floss/device
Oral Health - Average days a week using mouthwash for dental problem
Oral Health - Average number of teeth
Pesticide Use - Households using pesticides to control insects (%)
Pesticide Use - Households using pesticides to kill weeds (%)
Physical Activity - People doing vigorous-intensity work activities (%)
Physical Activity - People doing moderate-intensity work activities (%)
Physical Activity - People walking or bicycling (%)
Physical Activity - People doing vigorous-intensity recreational activities (%)
Physical Activity - People doing moderate-intensity recreational activities (%)
Physical Activity - Average hours a day doing sedentary activities
Physical Activity - Average hours a day watching TV or videos
Physical Activity - Average hours a day using computer
Physical Functioning - People having limitations keeping them from working (%)
Physical Functioning - People limited in amount of work they can do (%)
Physical Functioning - People that need special equipment to walk (%)
Physical Functioning - People experiencing confusion/memory problems (%)
Physical Functioning - People requiring special healthcare equipment (%)
Prescription Medications - Average number of prescription medicines taking
Preventive Aspirin Use - Adults 40+ taking low-dose aspirin (%)
Reproductive Health - Vaginal deliveries (%)
Reproductive Health - Cesarean deliveries (%)
Reproductive Health - Deliveries resulted in a live birth (%)
Reproductive Health - Pregnancies resulted in a delivery (%)
Reproductive Health - Women breastfeeding newborns (%)
Reproductive Health - Women that had a hysterectomy (%)
Reproductive Health - Women that had both ovaries removed (%)
Reproductive Health - Women that have ever taken birth control pills (%)
Reproductive Health - Women taking birth control pills (%)
Reproductive Health - Women that have ever used Depo-Provera or injectables (%)
Reproductive Health - Women that have ever used female hormones (%)
Sexual Behavior - People 18+ that ever had sex (vaginal, anal, or oral) (%)
Sexual Behavior - Males 18+ that ever had vaginal sex with a woman (%)
Sexual Behavior - Males 18+ that ever performed oral sex on a woman (%)
Sexual Behavior - Males 18+ that ever had anal sex with a woman (%)
Sexual Behavior - Males 18+ that ever had any sex with a man (%)
Sexual Behavior - Females 18+ that ever had vaginal sex with a man (%)
Sexual Behavior - Females 18+ that ever performed oral sex on a man (%)
Sexual Behavior - Females 18+ that ever had anal sex with a man (%)
Sexual Behavior - Females 18+ that ever had any kind of sex with a woman (%)
Sexual Behavior - Average age people first had sex
Sexual Behavior - Average number of female sex partners in lifetime (males 18+)
Sexual Behavior - Average number of female vaginal sex partners in lifetime (males 18+)
Sexual Behavior - Average age people first performed oral sex on a woman (18+)
Sexual Behavior - Average number of woman performed oral sex on in lifetime (18+)
Sexual Behavior - Average number of male sex partners in lifetime (males 18+)
Sexual Behavior - Average number of male anal sex partners in lifetime (males 18+)
Sexual Behavior - Average age people first performed oral sex on a man (18+)
Sexual Behavior - Average number of male oral sex partners in lifetime (18+)
Sexual Behavior - People using protection when performing oral sex (%)
Sexual Behavior - Average number of times people have vaginal or anal sex a year
Sexual Behavior - People having sex without condom (%)
Sexual Behavior - Average number of male sex partners in lifetime (females 18+)
Sexual Behavior - Average number of male vaginal sex partners in lifetime (females 18+)
Sexual Behavior - Average number of female sex partners in lifetime (females 18+)
Sexual Behavior - Circumcised males 18+ (%)
Sleep Disorders - Average hours sleeping at night
Sleep Disorders - People that has trouble sleeping (%)
Smoking-Cigarette Use - People smoking cigarettes (%)
Taste & Smell - People 40+ having problems with smell (%)
Taste & Smell - People 40+ having problems with taste (%)
Taste & Smell - People 40+ that ever had wisdom teeth removed (%)
Taste & Smell - People 40+ that ever had tonsils teeth removed (%)
Taste & Smell - People 40+ that ever had a loss of consciousness because of a head injury (%)
Taste & Smell - People 40+ that ever had a broken nose or other serious injury to face or skull (%)
Taste & Smell - People 40+ that ever had two or more sinus infections (%)
Weight - Average height (inches)
Weight - Average weight (pounds)
Weight - Average BMI
Weight - People that are obese (%)
Weight - People that ever were obese (%)
Weight - People trying to lose weight (%)
Officers per 1,000 residents here:
0.03Florida average:
2.35
Latest news from Royal Palm Beach, FL collected exclusively by city-data.com from local newspapers, TV, and radio stations
Royal Palm Beach, FL City Guides: Ancestries: Haitian (18.1%), Jamaican (10.5%), American (5.9%), Italian (4.6%), German (2.8%), English (1.7%).
Current Local Time:
Land area: 9.89 square miles.
Population density: 3,969 people per square mile (average).
11,252 residents are foreign born (22.5% Latin America , 3.6% Asia ).
This village:
28.5%Florida:
21.1%
Median real estate property taxes paid for housing units with mortgages in 2022: $2,980 (0.7%)Median real estate property taxes paid for housing units with no mortgage in 2022: $2,552 (0.7%)
Nearest city with pop. 50,000+: Royal Palm Beach-West Jupiter, FL (4.2 miles
Nearest city with pop. 200,000+: Hialeah, FL
Nearest city with pop. 1,000,000+: Houston, TX
Nearest cities:
Latitude: 26.71 N, Longitude: 80.23 W
Daytime population change due to commuting: -6,665 (-16.9%)Workers who live and work in this village: 3,945 (19.0%)
Property values in Royal Palm Beach, FL
Single-family new house construction building permits:
2022: 63 buildings , average cost: $432,0002021: 93 buildings , average cost: $405,8002020: 72 buildings , average cost: $325,4002019: 173 buildings , average cost: $328,1002018: 117 buildings , average cost: $327,3002017: 39 buildings , average cost: $293,7002015: 36 buildings , average cost: $333,5002014: 74 buildings , average cost: $253,8002013: 116 buildings , average cost: $293,7002012: 79 buildings , average cost: $307,8002011: 67 buildings , average cost: $305,5002010: 26 buildings , average cost: $302,4002009: 37 buildings , average cost: $279,0002008: 61 buildings , average cost: $279,0002007: 26 buildings , average cost: $247,2002006: 51 buildings , average cost: $121,3002005: 174 buildings , average cost: $138,4002004: 239 buildings , average cost: $100,4002003: 772 buildings , average cost: $133,7002002: 1140 buildings , average cost: $124,9002001: 869 buildings , average cost: $113,4002000: 411 buildings , average cost: $112,0001999: 217 buildings , average cost: $85,7001998: 274 buildings , average cost: $83,7001997: 162 buildings , average cost: $93,500Unemployment in December 2023:
Population change in the 1990s: +5,790 (+36.8%).
Most common occupations in Royal Palm Beach, FL (%)
Both Males Females
Other office and administrative support workers, including supervisors (5.6%)
Other management occupations, except farmers and farm managers (5.1%)
Preschool, kindergarten, elementary, and middle school teachers (4.7%)
Electrical equipment mechanics and other installation, maintenance, and repair workers, including supervisors (4.4%)
Secretaries and administrative assistants (4.2%)
Other sales and related occupations, including supervisors (4.1%)
Material recording, scheduling, dispatching, and distributing workers (4.0%)
Electrical equipment mechanics and other installation, maintenance, and repair workers, including supervisors (8.5%)
Other management occupations, except farmers and farm managers (6.8%)
Material recording, scheduling, dispatching, and distributing workers (5.0%)
Driver/sales workers and truck drivers (4.5%)
Other sales and related occupations, including supervisors (3.9%)
Law enforcement workers, including supervisors (3.4%)
Sales representatives, services, wholesale and manufacturing (3.3%)
Other office and administrative support workers, including supervisors (8.7%)
Registered nurses (7.8%)
Secretaries and administrative assistants (7.8%)
Preschool, kindergarten, elementary, and middle school teachers (7.7%)
Other sales and related occupations, including supervisors (4.2%)
Information and record clerks, except customer service representatives (3.7%)
Health technologists and technicians (3.5%)
Tornado activity:
Royal Palm Beach-area historical tornado activity is slightly below Florida state average. It is 26% smaller than the overall U.S. average.
On 10/19/1958, a category F3 (max. wind speeds 158-206 mph) tornado 26.3 miles away from the Royal Palm Beach village center killed one person and injured 24 people and caused between $50,000 and $500,000 in damages.
On 3/1/1980, a category F3 tornado 32.8 miles away from the village center killed one person and injured 33 people and caused between $5,000,000 and $50,000,000 in damages.
Earthquake activity:
Royal Palm Beach-area historical earthquake activity is above Florida state average. It is 94% smaller than the overall U.S. average. On 9/10/2006 at 14:56:08, a magnitude 5.9 (5.9 MB, 5.5 MS, 5.8 MW, Class: Moderate, Intensity: VI - VII) earthquake occurred 397.7 miles away from Royal Palm Beach center On 2/22/1992 at 04:21:34, a magnitude 3.2 (3.2 MB, Depth: 6.2 mi, Class: Light, Intensity: II - III) earthquake occurred 86.3 miles away from Royal Palm Beach center On 6/23/2016 at 17:20:29, a magnitude 3.8 (3.8 ML) earthquake occurred 232.4 miles away from the city center On 7/16/2016 at 20:00:10, a magnitude 3.7 (3.7 MB) earthquake occurred 217.0 miles away from Royal Palm Beach center On 9/21/2016 at 16:30:52, a magnitude 3.8 (3.8 ML) earthquake occurred 237.1 miles away from the city center On 9/4/2016 at 18:29:29, a magnitude 3.8 (3.8 ML) earthquake occurred 238.1 miles away from Royal Palm Beach center Magnitude types: body-wave magnitude (MB), local magnitude (ML), surface-wave magnitude (MS), moment magnitude (MW) Natural disasters: The number of natural disasters in Palm Beach County (27) is a lot greater than the US average (15).Major Disasters (Presidential) Declared: 15Emergencies Declared: 8Hurricanes: 17, Tropical Storms: 4, Fires: 3, Flood: 1, Freeze: 1, Storm: 1, Other: 2 (Note: some incidents may be assigned to more than one category). Hospitals and medical centers in Royal Palm Beach: ROYAL MANOR (600 BUSINESS PARKWAY)
WESTERN COMMUNITY DIALYSIS CENTER LLC (11301 OKEECHOBEE BLVD)
Other hospitals and medical centers near Royal Palm Beach: PALMS WEST HOSPITAL (about 3 miles away; LOXAHATCHEE, FL)
ALL-CARE HOME HEALTH SERVICES INC (Home Health Center, about 3 miles away; WELLINGTON, FL)
LIFECARE SOLUTIONS OF PALM BEACH INC (Home Health Center, about 4 miles away; WEST PALM BEACH, FL)
WELLINGTON REGIONAL MEDICAL CENTER (about 4 miles away; WELLINGTON, FL)
FMC - ROYAL PALM BEACH (Dialysis Facility, about 5 miles away; WEST PALM BEACH, FL)
ORTHOPAEDIC HOME HEALTH AND REHABILITATION INC (Home Health Center, about 5 miles away; WEST PALM BEACH, FL)
WOOD LAKE NURSING AND REHABILITATION CENTER (Nursing Home, about 7 miles away; WEST PALM BEACH, FL)
Amtrak stations near Royal Palm Beach: 11 miles: WEST PALM BEACH (201 S. TAMARIND AVE.) Services: ticket office, fully wheelchair accessible, enclosed waiting area, public restrooms, public payphones, vending machines, free short-term parking, free long-term parking, taxi stand, intercity bus service, public transit connection.
20 miles: DELRAY BEACH (345 S. CONGRESS AVE.) Services: enclosed waiting area, public restrooms, public payphones, vending machines, free short-term parking, free long-term parking, call for car rental service, call for taxi service, public transit connection.
Colleges/Universities in Royal Palm Beach: South University-West Palm Beach Full-time enrollment: 932; Location: 9801 Belvedere Road; Private, for-profit; Website: www.southuniversity.edu; Offers Master's degree )
Ultrasound Medical Institute Full-time enrollment: 12; Location: 503 Royal Palm Beach Blvd; Private, for-profit; Website: www.sonogramcenter.com)
Colleges/universities with over 2000 students nearest to Royal Palm Beach:
Palm Beach State College (about 11 miles; Lake Worth, FL ; Full-time enrollment: 19,938)
Palm Beach Atlantic University (about 11 miles; West Palm Beach, FL ; FT enrollment: 2,868)
Lynn University (about 24 miles; Boca Raton, FL ; FT enrollment: 2,151)
Florida Atlantic University (about 25 miles; Boca Raton, FL ; FT enrollment: 24,403)
Everest University-Pompano Beach (about 34 miles; Pompano Beach, FL ; FT enrollment: 2,316)
Keiser University-Ft Lauderdale (about 37 miles; Fort Lauderdale, FL ; FT enrollment: 18,270)
Broward College (about 44 miles; Fort Lauderdale, FL ; FT enrollment: 30,322)
Public high school in Royal Palm Beach:
Private high school in Royal Palm Beach: THE LEARNING FOUNDATION OF FLORIDA Students: 62, Location: 507 ROYAL PALM BEACH BLVD, Grades: 4-12)
Public elementary/middle schools in Royal Palm Beach: H. L. JOHNSON ELEMENTARY SCHOOL Students: 1,042, Location: 1000 CRESTWOOD BLVD N, Grades: PK-5)ROYAL PALM BEACH ELEMENTARY SCHOOL Students: 386, Location: 11911 OKEECHOBEE BLVD, Grades: PK-5)WESTERN PINES COMMUNITY MIDDLE Students: 384, Location: 5949 140TH AVE N, Grades: 6-8)CYPRESS TRAILS ELEMENTARY SCHOOL Students: 368, Location: 133 PARK RD N, Grades: KG-5)CRESTWOOD COMMUNITY MIDDLE Students: 296, Location: 64 SPARROW DR, Grades: 6-8)WESTERN ACADEMY CHARTER SCHOOL Students: 204, Location: 650 ROYAL PALM BEACH BLVD, Grades: KG-8, Charter school )Private elementary/middle school in Royal Palm Beach: IDEAL SCHOOL Students: 240, Location: 400 ROYAL COMMERCE RD, Grades: PK-8)
See full list of schools located in Royal Palm Beach
Notable locations in Royal Palm Beach: (A) , Terra Verde Country Club (B) , Swiss Fairways (C) , Palm Beach County Library System Royal Palm Beach Branch (D) , Palm Beach County Public Library - Okeechobee Boulevard Branch (E) , Fire Station Number 28 (F) , Fire Station Number 29 (G) , Palm Beach County Fire Rescue Station 28 Headquarters (H) , Palm Beach County Fire Rescue Station 29 (I) , Palm Beach County Sheriff's Office District 9 Village of Royal Palm Beach (J) . Display/hide their locations on the map
Lake: (A) . Display/hide its location on the map
Birthplace of: Julian Battle - 2005 NFL player (Kansas City Chiefs, born : Jul 11, 1981).
Palm Beach County has a predicted average indoor radon screening level less than 2 pCi/L (pico curies per liter) - Low Potential Average household size: This village:
2.9 peopleFlorida:
2.5 people
Percentage of family households: This village:
78.3%Whole state:
65.2%
Percentage of households with unmarried partners: This village:
6.0%Whole state:
7.3%
Likely homosexual households (counted as self-reported same-sex unmarried-partner households)
Lesbian couples: 0.5% of all households Gay men: 0.3% of all households
People in group quarters in Royal Palm Beach in 2010:
119 people in nursing facilities/skilled-nursing facilities
110 people in correctional facilities intended for juveniles
7 people in group homes intended for adults
people in other group homes in 2000Banks with most branches in Royal Palm Beach (2011 data):
PNC Bank, National Association: Royal Palm Beach Boulevard Branch at 100 Royal Palm Beach Boulevard, branch established on 1976/03/15; West Okeechobee Branch at 10031 Fox Trail Road South, branch established on 1999/10/12. Info updated 2012/03/20: Bank assets: $263,309.6 mil, Deposits: $197,343.0 mil, headquarters in Wilmington, DE, positive income , Commercial Lending Specialization, 3085 total offices , Holding Company: Pnc Financial Services Group, Inc., The
Wells Fargo Bank, National Association: Royal Palm North Branch at 11707 Okeechobee Boulevard, branch established on 1933/10/01. Info updated 2011/04/05: Bank assets: $1,161,490.0 mil, Deposits: $905,653.0 mil, headquarters in Sioux Falls, SD, positive income , 6395 total offices , Holding Company: Wells Fargo & Company
TD Bank, National Association: Royal Palm Beach Branch at 665 Royal Palm Beach Boulevard, branch established on 2003/04/30. Info updated 2010/10/04: Bank assets: $188,912.6 mil, Deposits: $153,149.8 mil, headquarters in Wilmington, DE, positive income , 1314 total offices , Holding Company: Toronto-Dominion Bank, The
JPMorgan Chase Bank, National Association: Royal Palm Beach Branch at 1102 Royal Palm Beach Boulevard, branch established on 1999/02/01. Info updated 2011/11/10: Bank assets: $1,811,678.0 mil, Deposits: $1,190,738.0 mil, headquarters in Columbus, OH, positive income , International Specialization, 5577 total offices , Holding Company: Jpmorgan Chase & Co.
Bank of America, National Association: Royal Palm Branch at 11601 Okeechobee Road, branch established on 1990/07/23. Info updated 2009/11/18: Bank assets: $1,451,969.3 mil, Deposits: $1,077,176.8 mil, headquarters in Charlotte, NC, positive income , 5782 total offices , Holding Company: Bank Of America Corporation
Branch Banking and Trust Company: Royal Palm Beach Branch at 11317 Okeechobee Boulevard, branch established on 1997/07/01. Info updated 2010/03/29: Bank assets: $168,867.6 mil, Deposits: $127,549.5 mil, headquarters in Winston Salem, NC, positive income , Commercial Lending Specialization, 1793 total offices , Holding Company: Bb&T Corporation
Iberiabank: Palms West Branch at 119 South State Road 7, branch established on 2003/02/21. Info updated 2011/06/08: Bank assets: $11,676.7 mil, Deposits: $9,387.9 mil, headquarters in Lafayette, LA, positive income , Commercial Lending Specialization, 187 total offices , Holding Company: Iberiabank Corporation
Citibank, National Association: Royal Palm Beach at 11091 Southern Boulevard, branch established on 2007/12/18. Info updated 2012/01/10: Bank assets: $1,288,658.0 mil, Deposits: $882,541.0 mil, headquarters in Sioux Falls, SD, positive income , International Specialization, 1048 total offices , Holding Company: Citigroup Inc.
Regions Bank: Royal Palm Branch at 1184 Royal Palm Beach Boulevard, branch established on 1988/10/03. Info updated 2011/02/24: Bank assets: $123,368.2 mil, Deposits: $98,301.3 mil, headquarters in Birmingham, AL, positive income , Commercial Lending Specialization, 1778 total offices , Holding Company: Regions Financial Corporation
For population 15 years and over in Royal Palm Beach:
Never married: 30.1%Now married: 51.9%Separated: 1.6%Widowed: 4.1%Divorced: 12.3% For population 25 years and over in Royal Palm Beach:
High school or higher: 90.8%Bachelor's degree or higher: 34.7%Graduate or professional degree: 13.8%Unemployed: 3.1%Mean travel time to work (commute): 27.2 minutes
Education Gini index (Inequality in education) Here:
12.1Florida average:
12.2
Religion statistics for Royal Palm Beach, FL (based on Palm Beach County data)
Religion Adherents Congregations Catholic 210,006 36 Evangelical Protestant 143,738 477 Other 62,520 124 Mainline Protestant 44,223 83 Black Protestant 17,533 47 Orthodox 5,695 8 None 836,419 -
Source: Clifford Grammich, Kirk Hadaway, Richard Houseal, Dale E.Jones, Alexei Krindatch, Richie Stanley and Richard H.Taylor. 2012. 2010 U.S.Religion Census: Religious Congregations & Membership Study. Association of Statisticians of American Religious Bodies. Jones, Dale E., et al. 2002. Congregations and Membership in the United States 2000. Nashville, TN: Glenmary Research Center. Graphs represent county-level data
Food Environment Statistics: Number of grocery stores : 259Here :
2.05 / 10,000 pop.Florida :
2.04 / 10,000 pop.
Number of supercenters and club stores : 13Palm Beach County :
0.10 / 10,000 pop.Florida :
0.11 / 10,000 pop.
Number of convenience stores (no gas) : 161Palm Beach County :
1.28 / 10,000 pop.Florida :
1.28 / 10,000 pop.
Number of convenience stores (with gas) : 284Palm Beach County :
2.25 / 10,000 pop.State :
3.04 / 10,000 pop.
Number of full-service restaurants : 1,129Palm Beach County :
8.96 / 10,000 pop.Florida :
7.45 / 10,000 pop.
Adult diabetes rate : Palm Beach County :
8.7%State :
9.2%
Adult obesity rate : This county :
19.3%Florida :
23.7%
Low-income preschool obesity rate : Palm Beach County :
17.3%State :
14.0%
Health and Nutrition: Healthy diet rate : Royal Palm Beach:
52.5%Florida:
51.4%
Average overall health of teeth and gums : Royal Palm Beach:
51.3%State:
49.4%
Average BMI : Royal Palm Beach:
28.7State:
28.6
People feeling badly about themselves : Royal Palm Beach:
19.8%Florida:
19.5%
People not drinking alcohol at all : Royal Palm Beach:
10.5%Florida:
10.7%
Average hours sleeping at night : Royal Palm Beach:
6.8Florida:
6.9
Overweight people : This city:
35.5%Florida:
34.7%
General health condition : Average condition of hearing : Royal Palm Beach:
80.5%Florida:
79.2%
More about Health and Nutrition of Royal Palm Beach, FL Residents
Local government employment and payroll (March 2022)
Function
Full-time employees
Monthly full-time payroll
Average yearly full-time wage
Part-time employees
Monthly part-time payroll
Parks and Recreation
39 $150,272 $46,238 17 $25,746 Other and Unallocable
37 $213,346 $69,193 0 $0 Other Government Administration
14 $87,935 $75,373 1 $941 Financial Administration
11 $81,264 $88,652 0 $0 Streets and Highways
11 $44,199 $48,217 0 $0 Natural Resources
3 $13,704 $54,816 0 $0
Totals for Government
115 $590,720 $61,640 18 $26,687
Royal Palm Beach government finances - Expenditure in 2021 (per resident):
Construction - Regular Highways: $1,735,000 ($44.19)
Current Operations - Police Protection: $8,486,000 ($216.15)
Parks and Recreation: $4,699,000 ($119.69)Regular Highways: $2,947,000 ($75.07)Natural Resources - Other: $2,192,000 ($55.83)Central Staff Services: $1,906,000 ($48.55)Financial Administration: $1,851,000 ($47.15)Protective Inspection and Regulation - Other: $1,303,000 ($33.19)Judicial and Legal Services: $423,000 ($10.77)Other Capital Outlay - Parks and Recreation: $1,376,000 ($35.05)
Natural Resources - Other: $865,000 ($22.03)Police Protection: $26,000 ($0.66)Financial Administration: $4,000 ($0.10)
Royal Palm Beach government finances - Revenue in 2021 (per resident):
Charges - Parks and Recreation: $204,000 ($5.20)
Other: $101,000 ($2.57)Natural Resources - Other: $1,000 ($0.03)Federal Intergovernmental - Other: $701,000 ($17.86)
Local Intergovernmental - Other: $182,000 ($4.64)
General Local Government Support: $87,000 ($2.22)Miscellaneous - Interest Earnings: $3,043,000 ($77.51)
Rents: $723,000 ($18.42)Fines and Forfeits: $531,000 ($13.53)General Revenue - Other: $249,000 ($6.34)Special Assessments: $239,000 ($6.09)Sale of Property: $39,000 ($0.99)State Intergovernmental - General Local Government Support: $4,102,000 ($104.49)
Other: $59,000 ($1.50)Tax - Property: $5,490,000 ($139.84)
Public Utilities Sales: $4,672,000 ($119.00)Occupation and Business License - Other: $3,751,000 ($95.54)General Sales and Gross Receipts: $2,632,000 ($67.04)Other License: $2,147,000 ($54.69)Motor Fuels Sales: $683,000 ($17.40)Insurance Premiums Sales: $384,000 ($9.78)
Royal Palm Beach government finances - Cash and Securities in 2021 (per resident):
Other Funds - Cash and Securities: $90,324,000 ($2300.72)
7.12% of this county's 2021 resident taxpayers lived in other counties in 2020 ($242,201 average adjusted gross income )
Here:
7.12%Florida average:
8.80%
0.02% of residents moved from foreign countries ($131 average AGI )Palm Beach County:
0.02%Florida average:
0.05%
Top counties from which taxpayers relocated into this county between 2020 and 2021:
6.27% of this county's 2020 resident taxpayers moved to other counties in 2021 ($96,101 average adjusted gross income )
Here:
6.27%Florida average:
7.45%
0.02% of residents moved to foreign countries ($206 average AGI )Palm Beach County:
0.02%Florida average:
0.04%
Top counties to which taxpayers relocated from this county between 2020 and 2021:
Businesses in Royal Palm Beach, FL
Name Count Name Count
7-Eleven 3 Mazda 1 AT&T 1 McDonald's 1 Arby's 1 Nike 1 AutoZone 1 Nissan 1 Avenue 1 Old Navy 1 Bed Bath & Beyond 1 Outback 1 Blockbuster 1 Outback Steakhouse 1 Costco 1 Panera Bread 1 Dairy Queen 1 Payless 2 Dennys 1 Penske 1 Domino's Pizza 1 PetSmart 1 DressBarn 1 Pizza Hut 1 Dressbarn 1 Plato's Closet 1 Dunkin Donuts 1 Publix Super Markets 3 Famous Footwear 1 Quiznos 1 FedEx 3 Ruby Tuesday 1 Ford 1 SAS Shoes 1 GNC 1 Sprint Nextel 1 GameStop 1 Staples 1 H&R Block 1 Starbucks 2 Jamba Juice 1 Steak 'n Shake 1 Jimmy John's 1 Subway 3 Jones New York 1 T-Mobile 4 Justice 1 T.G.I. Driday's 1 KFC 1 Taco Bell 1 Kmart 1 Tire Kingdom 2 Kohl's 1 Toyota 1 Little Caesars Pizza 1 Toys"R"Us 1 Lowe's 1 U-Haul 1 Marshalls 1 UPS 5
Strongest AM radio stations in Royal Palm Beach:
WFTL (850 AM; 50 kW; WEST PALM BEACH, FL; Owner: JAMES CRYSTAL ENTERPRISES II, L.L.C.)
WJNO (1290 AM; 10 kW; WEST PALM BEACH, FL; Owner: CLEAR CHANNEL BROADCASTING LICENSES, INC.)
WLVJ (1040 AM; 25 kW; BOYNTON BEACH, FL; Owner: JAMES CRYSTAL BOYNTON BEACH, INC.)
WMNE (1600 AM; 5 kW; RIVIERA BEACH, FL; Owner: ABC, INC.)
WJNA (640 AM; 38 kW; ROYAL PALM BEACH, FL; Owner: SOUTH FLORIDA RADIO, INC.)
WWNN (1470 AM; 50 kW; POMPANO BEACH, FL; Owner: WWNN LICENSE, LLC)
WAQI (710 AM; 50 kW; MIAMI, FL; Owner: LICENSE CORPORATION #1)
WBZT (1230 AM; 1 kW; WEST PALM BEACH, FL; Owner: CAPSTAR TX LIMITED PARTNERSHIP)
WRFX (940 AM; 50 kW; MIAMI, FL; Owner: CLEAR CHANNEL BROADCASTING LICENSES, INC.)
WWFE (670 AM; 50 kW; MIAMI, FL; Owner: FENIX BROADCASTING CORP.)
WNMA (1210 AM; 49 kW; MIAMI SPRINGS, FL; Owner: RADIO UNICA OF MIAMI LICENSE CORP.)
WDJA (1420 AM; 5 kW; DELRAY BEACH, FL; Owner: JAMES CRYSTAL DELRAY BEACH, INC.)
WQBA (1140 AM; 50 kW; MIAMI, FL; Owner: WQBA-AM LICENSE CORP.)
Strongest FM radio stations in Royal Palm Beach:
WRMF (97.9 FM; PALM BEACH, FL; Owner: PBB LICENSES, LLC)
WIRK-FM (107.9 FM; WEST PALM BEACH, FL; Owner: INFINITY RADIO OPERATIONS INC.)
WEAT-FM (104.3 FM; WEST PALM BEACH, FL; Owner: INFINITY RADIO OPERATIONS INC.)
WXEL (90.7 FM; WEST PALM BEACH, FL; Owner: BARRY TELECOMMUNICATIONS, INC.)
WOLL (105.5 FM; HOBE SOUND, FL; Owner: CLEAR CHANNEL BROADCASTING LICENSES, INC.)
WRLX (92.1 FM; WEST PALM BEACH, FL; Owner: CAPSTAR TX LIMITED PARTNERSHIP)
WAYF (88.1 FM; WEST PALM BEACH, FL; Owner: WAY-FM MEDIA GROUP. INC.)
W262AE (100.3 FM; WEST PALM BEACH, FL; Owner: FAMILY STATIONS, INC.)
WKGR (98.7 FM; FORT PIERCE, FL; Owner: CLEAR CHANNEL BROADCASTING LICENSES, INC.)
W270AD (101.9 FM; WEST PALM BEACH, FL; Owner: TRINITY INTERNATIONAL FOUNDATION, INC.)
WMBX (102.3 FM; JENSEN BEACH, FL; Owner: INFINITY RADIO OPERATIONS INC.)
WPBZ (103.1 FM; INDIANTOWN, FL; Owner: INFINITY RADIO OPERATIONS INC.)
WZZR (94.3 FM; RIVIERA BEACH, FL; Owner: CLEAR CHANNEL BROADCASTING LICENSES, INC.)
WRMB (89.3 FM; BOYNTON BEACH, FL; Owner: THE MOODY BIBLE INSTITUTE OF CHICAGO)
WWFR (91.7 FM; STUART, FL; Owner: FAMILY STATIONS, INC.)
WLDI (95.5 FM; FORT PIERCE, FL; Owner: CLEAR CHANNEL BROADCASTING LICENSES, INC.)
WJBW-FM (106.3 FM; JUPITER, FL; Owner: INFINITY RADIO OPERATIONS INC.)
WEDR (99.1 FM; MIAMI, FL; Owner: COX RADIO, INC.)
WCNO (89.9 FM; PALM CITY, FL; Owner: NATIONAL CHRISTIAN NETWORK, INC.)
W203AY (88.5 FM; GOLDEN LAKES, FL; Owner: CALVARY CHAPEL OF TWIN FALLS, INC.)
TV broadcast stations around Royal Palm Beach:
WFGC (Channel 61; PALM BEACH, FL; Owner: CHRISTIAN TELEVISION OF PALM BEACH COUNTY, INC.)
WPTV (Channel 5; WEST PALM BEACH, FL; Owner: SCRIPPS HOWARD BROADCASTING COMPANY)
WFLX (Channel 29; WEST PALM BEACH, FL; Owner: RAYCOM NATIONAL, INC.)
WXEL-TV (Channel 42; WEST PALM BEACH, FL; Owner: BARRY TELECOMMUNICATIONS, INC.)
WPEC (Channel 12; WEST PALM BEACH, FL; Owner: FREEDOM BROADCASTING OF FLORIDA, INC)
WPXP (Channel 67; LAKE WORTH, FL; Owner: PAXSON WEST PALM BEACH LICENSE, INC.)
WWHB-CA (Channel 15; STUART, FL; Owner: AMERICAN NETCOM, INC.)
WBWP-LP (Channel 57; WEST PALM BEACH, FL; Owner: H&R PRODUCTION GROUP, LLC)
W47BG (Channel 47; WEST PALM BEACH, FL; Owner: JACKSONVILLE EDUCATORS B/CING., INC.)
WTVX (Channel 34; FORT PIERCE, FL; Owner: C-34 FCC LICENSEE SUBSIDIARY, LLC)
WPBF (Channel 25; TEQUESTA, FL; Owner: WPBF-TV COMPANY)
WTCN-CA (Channel 43; PALM BEACH, FL; Owner: WILLIAM H. BROTHERS)
WHDT-LP (Channel 44; MIAMI, FL; Owner: GUENTER MARKSTEINER)
W53BS (Channel 53; JUPITER, FL; Owner: SPIRIT PRODUCTIONS, INC.)
FCC Registered Antenna Towers: 131 (
See the full list of FCC Registered Antenna Towers in Royal Palm Beach )
FCC Registered Broadcast Land Mobile Towers: 13 (
See the full list of FCC Registered Broadcast Land Mobile Towers in Royal Palm Beach, FL )
FCC Registered Microwave Towers: 6
STATION, 801 Sansbury Way (Lat: 26.688667 Lon: -80.187528), Overall height: 57.9 m, Call Sign: WNTL366, Assigned Frequencies: 6805.00 MHz, 6825.00 MHz, Grant Date: 12/07/2011, Expiration Date: 02/21/2022, Cancellation Date: 02/26/2014, Registrant: South Florida Water Mgt, 3301 Gun Club Rd, West Palm Beach, FL 33406, Phone: (561) 682-6137, Email:
WPB F/S, 801 Sansbury Way (Lat: 26.688667 Lon: -80.187556), Type: Ltower, Structure height: 57.9 m, Call Sign: WPRS318, Assigned Frequencies: 6286.19 MHz, 6197.24 MHz, 6226.89 MHz, 6256.54 MHz, 6226.89 MHz, 6256.54 MHz, 6226.89 MHz, 6256.54 MHz, 6226.89 MHz, 6256.54 MHz... (+46 more), Grant Date: 12/08/2020, Expiration Date: 01/10/2031, Certifier: Wayne C Lutz, Registrant: South Florida Water Management District, 3301 Gun Club Road, West Palm Beach, FL 33406, Phone: (561) 682-6148, Email:
ROYAL PALM BEACH, Lat: 26.651667 Lon: -80.208333, Call Sign: WPRW287, Licensee ID: L00267953, Assigned Frequencies: 956.431 MHz, Grant Date: 12/16/2020, Expiration Date: 02/27/2031, Certifier: Gary Dernlan, Registrant: County Of Palm Beach Royal Palm Beach (WI, 10500 60th St (Lat: 26.763333 Lon: -80.205000), Type: Tower, Structure height: 134.7 m, Call Sign: WQIP997, Assigned Frequencies: 10755.0 MHz, Grant Date: 04/10/2008, Expiration Date: 04/10/2018, Cancellation Date: 10/10/2009, Certifier: William Chastain, Registrant: Radio Dynamics Corporation, Silver Spring, MD 20914, Phone: (301) 493-5171, Fax: (301) 576-4553, Email:
SFWMD, 801 Sansbury Way (Lat: 26.688944 Lon: -80.187500), Type: Tower, Structure height: 57.9 m, Call Sign: WQOD844, Assigned Frequencies: 10955.0 MHz, 11075.0 MHz, Grant Date: 08/20/2021, Expiration Date: 08/24/2031, Certifier: Kevin O'Connor, Registrant: Municipal Public Safety Communications Consortium Of Palm Beach County, 10500 North Military Trail, Palm Beach Gardens, FL 33410, Phone: (561) 799-4448, Email:
CROWN ABBX, 390 North State Road 7 (Lat: 26.669556 Lon: -80.200222), Type: Mtower, Structure height: 48.5 m, Overall height: 50.6 m, Call Sign: WRFJ442, Assigned Frequencies: 11245.0 MHz, 11245.0 MHz, 11245.0 MHz, 11245.0 MHz, 11245.0 MHz, 11245.0 MHz, 11245.0 MHz, 11325.0 MHz, 11325.0 MHz, 11325.0 MHz... (+4 more), Grant Date: 03/16/2020, Expiration Date: 03/16/2030, Certifier: Laurie Gebhardt, Registrant: Cellco Partnership, 5055 North Point Pkwy, Np2ne Network Engineering, Alpharetta, GA 30022, Phone: (770) 797-1070, Email:
FCC Registered Amateur Radio Licenses: 132 (
See the full list of FCC Registered Amateur Radio Licenses in Royal Palm Beach )
FAA Registered Aircraft Manufacturers and Dealers: 3 (
See the full list of FAA Registered Manufacturers and Dealers in Royal Palm Beach )
FAA Registered Aircraft: 17 (
See the full list of FAA Registered Aircraft )
Home Mortgage Disclosure Act Aggregated Statistics For Year 2009(Based on 2 full and 3 partial tracts) A) FHA, FSA/RHS & VA B) Conventional C) Refinancings D) Home Improvement Loans F) Non-occupant Loans on Number Average Value Number Average Value Number Average Value Number Average Value Number Average Value
LOANS ORIGINATED 166 $162,738 84 $149,669 184 $169,603 6 $90,987 29 $164,283 APPLICATIONS APPROVED, NOT ACCEPTED 10 $162,830 11 $137,922 27 $155,990 0 $0 5 $102,284 APPLICATIONS DENIED 48 $160,045 27 $129,991 153 $195,405 12 $50,126 22 $133,881 APPLICATIONS WITHDRAWN 23 $154,457 17 $165,041 45 $199,130 0 $0 3 $219,750 FILES CLOSED FOR INCOMPLETENESS 8 $162,711 6 $159,093 31 $182,429 1 $59,470 6 $146,932
Aggregated Statistics For Year 2008(Based on 2 full and 3 partial tracts) A) FHA, FSA/RHS & VA B) Conventional C) Refinancings D) Home Improvement Loans F) Non-occupant Loans on G) Loans On Manufactured Number Average Value Number Average Value Number Average Value Number Average Value Number Average Value Number Average Value
LOANS ORIGINATED 99 $194,882 200 $211,168 200 $184,190 24 $56,947 71 $206,925 1 $187,310 APPLICATIONS APPROVED, NOT ACCEPTED 9 $205,937 41 $219,029 58 $197,632 4 $130,700 19 $189,431 0 $0 APPLICATIONS DENIED 31 $188,164 116 $228,354 289 $219,169 27 $84,486 61 $219,038 0 $0 APPLICATIONS WITHDRAWN 20 $213,094 46 $233,329 82 $217,418 4 $602,160 20 $225,204 0 $0 FILES CLOSED FOR INCOMPLETENESS 4 $215,768 22 $212,047 44 $204,701 3 $118,130 9 $182,448 0 $0
Aggregated Statistics For Year 2007(Based on 2 full and 3 partial tracts) A) FHA, FSA/RHS & VA B) Conventional C) Refinancings D) Home Improvement Loans F) Non-occupant Loans on G) Loans On Manufactured Number Average Value Number Average Value Number Average Value Number Average Value Number Average Value Number Average Value
LOANS ORIGINATED 8 $251,211 452 $201,488 630 $200,682 97 $103,635 148 $194,741 1 $72,000 APPLICATIONS APPROVED, NOT ACCEPTED 0 $0 88 $227,966 183 $202,334 24 $85,701 32 $219,840 1 $72,000 APPLICATIONS DENIED 5 $287,640 291 $217,892 609 $239,387 70 $118,665 131 $206,169 1 $17,190 APPLICATIONS WITHDRAWN 3 $700,327 89 $199,227 215 $229,962 18 $119,261 33 $215,374 0 $0 FILES CLOSED FOR INCOMPLETENESS 1 $305,390 29 $253,043 96 $250,342 4 $185,888 17 $234,541 0 $0
Aggregated Statistics For Year 2006(Based on 2 full and 3 partial tracts) A) FHA, FSA/RHS & VA B) Conventional C) Refinancings D) Home Improvement Loans E) Loans on Dwellings For 5+ Families F) Non-occupant Loans on G) Loans On Manufactured Number Average Value Number Average Value Number Average Value Number Average Value Number Average Value Number Average Value Number Average Value
LOANS ORIGINATED 6 $246,633 1,141 $201,593 1,098 $208,652 111 $118,180 0 $0 337 $193,895 1 $344,680 APPLICATIONS APPROVED, NOT ACCEPTED 0 $0 142 $205,939 226 $209,891 22 $80,722 0 $0 42 $212,490 0 $0 APPLICATIONS DENIED 2 $251,235 370 $191,872 516 $226,420 97 $115,314 0 $0 113 $202,652 4 $50,448 APPLICATIONS WITHDRAWN 2 $278,465 202 $195,164 401 $220,402 36 $134,611 1 $59,000 46 $209,356 3 $109,270 FILES CLOSED FOR INCOMPLETENESS 0 $0 48 $217,729 135 $243,770 6 $107,173 0 $0 18 $196,522 0 $0
Aggregated Statistics For Year 2005(Based on 2 full and 3 partial tracts) A) FHA, FSA/RHS & VA B) Conventional C) Refinancings D) Home Improvement Loans F) Non-occupant Loans on G) Loans On Manufactured Number Average Value Number Average Value Number Average Value Number Average Value Number Average Value Number Average Value
LOANS ORIGINATED 6 $202,278 1,186 $195,684 1,377 $195,885 137 $109,364 338 $188,832 0 $0 APPLICATIONS APPROVED, NOT ACCEPTED 0 $0 135 $200,605 221 $190,710 25 $73,073 34 $190,039 1 $39,820 APPLICATIONS DENIED 0 $0 316 $190,391 585 $191,257 102 $95,048 107 $176,879 9 $46,198 APPLICATIONS WITHDRAWN 1 $162,810 214 $179,412 528 $187,577 63 $154,154 66 $175,848 2 $34,500 FILES CLOSED FOR INCOMPLETENESS 0 $0 44 $217,961 157 $196,593 13 $103,151 13 $198,051 1 $60,000
Aggregated Statistics For Year 2004(Based on 2 full and 3 partial tracts) A) FHA, FSA/RHS & VA B) Conventional C) Refinancings D) Home Improvement Loans E) Loans on Dwellings For 5+ Families F) Non-occupant Loans on G) Loans On Manufactured Number Average Value Number Average Value Number Average Value Number Average Value Number Average Value Number Average Value Number Average Value
LOANS ORIGINATED 23 $184,914 1,317 $175,236 1,093 $157,062 138 $87,170 1 $826,410 319 $158,489 2 $107,845 APPLICATIONS APPROVED, NOT ACCEPTED 3 $160,523 180 $178,765 194 $159,533 37 $77,082 0 $0 39 $163,405 1 $45,850 APPLICATIONS DENIED 4 $182,042 234 $178,626 532 $159,926 132 $57,729 0 $0 57 $154,471 8 $42,592 APPLICATIONS WITHDRAWN 3 $209,253 160 $193,016 329 $156,484 32 $61,996 0 $0 42 $147,362 0 $0 FILES CLOSED FOR INCOMPLETENESS 0 $0 31 $190,133 253 $163,279 14 $58,399 0 $0 5 $177,608 0 $0
Aggregated Statistics For Year 2003(Based on 2 full and 3 partial tracts) A) FHA, FSA/RHS & VA B) Conventional C) Refinancings D) Home Improvement Loans E) Loans on Dwellings For 5+ Families F) Non-occupant Loans on Number Average Value Number Average Value Number Average Value Number Average Value Number Average Value Number Average Value
LOANS ORIGINATED 38 $142,067 1,260 $163,295 1,762 $127,662 55 $35,151 1 $11,904,440 251 $135,432 APPLICATIONS APPROVED, NOT ACCEPTED 0 $0 155 $166,801 268 $123,435 14 $22,451 0 $0 37 $146,605 APPLICATIONS DENIED 5 $135,860 202 $153,381 718 $131,674 67 $34,029 0 $0 49 $132,993 APPLICATIONS WITHDRAWN 8 $124,272 142 $154,013 301 $133,456 18 $37,563 0 $0 31 $141,423 FILES CLOSED FOR INCOMPLETENESS 5 $107,372 39 $182,389 92 $124,612 10 $31,040 0 $0 8 $155,826
Aggregated Statistics For Year 1999(Based on 1 full and 1 partial tracts) A) FHA, FSA/RHS & VA B) Conventional C) Refinancings D) Home Improvement Loans F) Non-occupant Loans on Number Average Value Number Average Value Number Average Value Number Average Value Number Average Value
LOANS ORIGINATED 121 $95,739 375 $96,447 303 $79,570 57 $18,329 40 $91,273 APPLICATIONS APPROVED, NOT ACCEPTED 3 $95,223 44 $89,356 72 $81,977 18 $23,593 8 $49,841 APPLICATIONS DENIED 18 $99,776 79 $96,687 148 $67,797 71 $22,965 14 $90,759 APPLICATIONS WITHDRAWN 12 $96,175 43 $104,885 141 $76,740 12 $62,246 5 $79,758 FILES CLOSED FOR INCOMPLETENESS 4 $74,205 10 $112,311 80 $88,166 0 $0 0 $0
Detailed HMDA statistics for the following Tracts:
0078.12
, 0078.13 , 0078.16 , 0078.17 , 0078.18
Private Mortgage Insurance Companies Aggregated Statistics For Year 2009(Based on 2 full and 3 partial tracts) A) Conventional B) Refinancings C) Non-occupant Loans on Number Average Value Number Average Value Number Average Value
LOANS ORIGINATED 9 $209,991 2 $178,695 0 $0 APPLICATIONS APPROVED, NOT ACCEPTED 11 $290,938 3 $204,213 2 $190,945 APPLICATIONS DENIED 4 $97,500 0 $0 0 $0 APPLICATIONS WITHDRAWN 0 $0 0 $0 0 $0 FILES CLOSED FOR INCOMPLETENESS 3 $253,203 0 $0 2 $255,380
Aggregated Statistics For Year 2008(Based on 2 full and 3 partial tracts) A) Conventional B) Refinancings C) Non-occupant Loans on Number Average Value Number Average Value Number Average Value
LOANS ORIGINATED 92 $252,250 23 $237,527 28 $260,636 APPLICATIONS APPROVED, NOT ACCEPTED 55 $249,679 19 $268,782 17 $240,322 APPLICATIONS DENIED 20 $270,505 4 $201,000 9 $235,342 APPLICATIONS WITHDRAWN 9 $258,991 0 $0 2 $289,460 FILES CLOSED FOR INCOMPLETENESS 8 $254,132 3 $261,283 7 $261,657
Aggregated Statistics For Year 2007(Based on 2 full and 3 partial tracts) A) Conventional B) Refinancings C) Non-occupant Loans on Number Average Value Number Average Value Number Average Value
LOANS ORIGINATED 126 $250,991 47 $265,083 24 $248,117 APPLICATIONS APPROVED, NOT ACCEPTED 20 $295,498 14 $272,076 4 $283,838 APPLICATIONS DENIED 4 $393,265 1 $448,850 1 $669,970 APPLICATIONS WITHDRAWN 7 $285,813 5 $249,114 5 $254,286 FILES CLOSED FOR INCOMPLETENESS 0 $0 0 $0 0 $0
Aggregated Statistics For Year 2006(Based on 2 full and 3 partial tracts) A) Conventional B) Refinancings C) Non-occupant Loans on Number Average Value Number Average Value Number Average Value
LOANS ORIGINATED 119 $269,546 27 $279,159 24 $247,395 APPLICATIONS APPROVED, NOT ACCEPTED 16 $275,826 18 $257,398 5 $243,102 APPLICATIONS DENIED 2 $416,000 1 $268,760 0 $0 APPLICATIONS WITHDRAWN 10 $228,022 3 $221,487 4 $222,810 FILES CLOSED FOR INCOMPLETENESS 1 $423,130 0 $0 0 $0
Aggregated Statistics For Year 2005(Based on 2 full and 3 partial tracts) A) Conventional B) Refinancings C) Non-occupant Loans on Number Average Value Number Average Value Number Average Value
LOANS ORIGINATED 110 $228,898 32 $236,711 15 $217,397 APPLICATIONS APPROVED, NOT ACCEPTED 29 $203,075 18 $213,113 5 $187,560 APPLICATIONS DENIED 3 $239,340 1 $306,210 0 $0 APPLICATIONS WITHDRAWN 8 $222,622 2 $260,490 0 $0 FILES CLOSED FOR INCOMPLETENESS 0 $0 0 $0 0 $0
Aggregated Statistics For Year 2004(Based on 2 full and 3 partial tracts) A) Conventional B) Refinancings C) Non-occupant Loans on Number Average Value Number Average Value Number Average Value
LOANS ORIGINATED 322 $188,295 48 $174,574 81 $159,831 APPLICATIONS APPROVED, NOT ACCEPTED 84 $212,446 30 $175,183 16 $180,145 APPLICATIONS DENIED 3 $243,677 0 $0 1 $101,350 APPLICATIONS WITHDRAWN 32 $223,830 6 $148,430 3 $128,947 FILES CLOSED FOR INCOMPLETENESS 3 $217,200 0 $0 0 $0
Aggregated Statistics For Year 2003(Based on 2 full and 3 partial tracts) A) Conventional B) Refinancings C) Non-occupant Loans on Number Average Value Number Average Value Number Average Value
LOANS ORIGINATED 602 $171,895 119 $156,977 93 $140,013 APPLICATIONS APPROVED, NOT ACCEPTED 120 $178,575 47 $157,008 11 $162,255 APPLICATIONS DENIED 15 $194,913 4 $139,342 5 $161,862 APPLICATIONS WITHDRAWN 42 $152,617 15 $164,926 8 $136,285 FILES CLOSED FOR INCOMPLETENESS 3 $200,463 0 $0 0 $0
Aggregated Statistics For Year 1999(Based on 1 full and 1 partial tracts) A) Conventional B) Refinancings C) Non-occupant Loans on Number Average Value Number Average Value Number Average Value
LOANS ORIGINATED 136 $101,443 49 $97,158 7 $80,704 APPLICATIONS APPROVED, NOT ACCEPTED 13 $125,425 11 $107,864 1 $55,810 APPLICATIONS DENIED 9 $110,887 3 $109,807 1 $93,140 APPLICATIONS WITHDRAWN 12 $100,423 7 $96,374 0 $0 FILES CLOSED FOR INCOMPLETENESS 2 $121,935 0 $0 0 $0
Detailed PMIC statistics for the following Tracts:
0078.12
, 0078.13 , 0078.16 , 0078.17 , 0078.18 Fire-safe hotels and motels in Royal Palm Beach, Florida:
Royal Inn Hotel, 675 Royal Palm Beach Blvd, Royal Palm Beach, Florida 33411 Phone: (561) 793-3000, Fax: (561) 795-1502
Hampton Inn, West Palm Beach/Fl Turnpike, 2025 Vista Pkwy, Royal Palm Beach, Florida 33411 Phone: (561) 682-9990, Fax: (561) 682-9446
All 2 fire-safe hotels and motels in Royal Palm Beach, Florida Royal Palm Beach compared to Florida state average:
Unemployed percentage significantly below state average. Black race population percentage significantly above state average. Hispanic race population percentage above state average. Foreign-born population percentage significantly above state average. Renting percentage below state average. Length of stay since moving in significantly above state average. Number of college students above state average. Royal Palm Beach on our top lists :
#58 on the list of "Top 101 cities with the most residents born in Jamaica (population 500+)"
#6 on the list of "Top 101 counties with the largest number of people without health insurance coverage in 2000 (pop. 50,000+)"
#8 on the list of "Top 101 counties with the lowest average weight of females"
#10 on the list of "Top 101 counties with the highest ground withdrawal of fresh water for public supply"
#28 on the list of "Top 101 counties with the highest total withdrawal of fresh water for public supply"
#35 on the list of "Top 101 counties with the most Evangelical Protestant congregations"
Top Patent Applicants
Jeffrey Farr (20)
Eddy H. Del Rio (10)
Alfred J. Alasia (8)
Robert E. Townsend, Jr. (7)
Larry G. Brown (4)
Joseph S. Seriani (4)
Denise James (2)
George A. Teacherson (2)
Mark J. Ricciardo (2)
Helena Hepburn (2)
Total of 110 patent applications in 2008-2024.

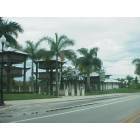
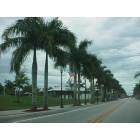
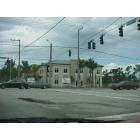
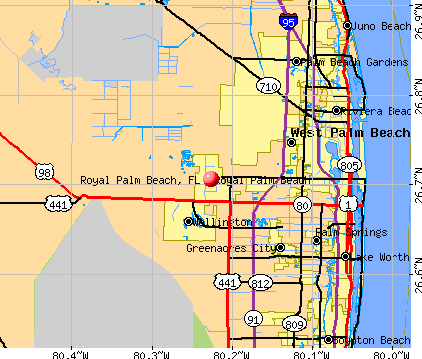


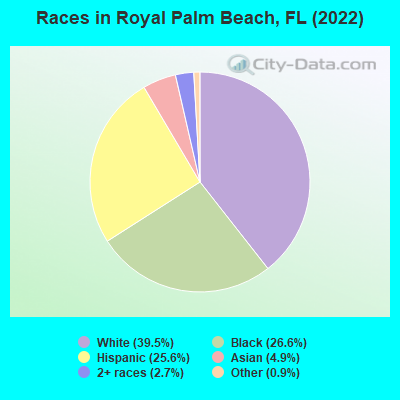
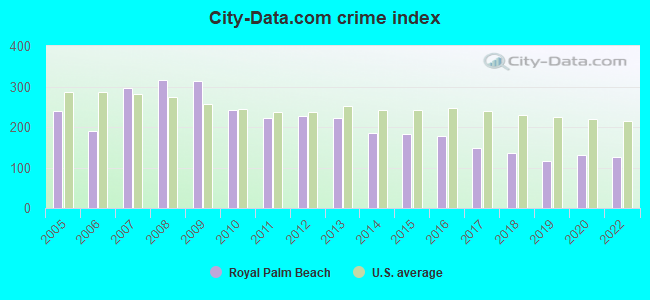
 Recent articles from our blog. Our writers, many of them Ph.D. graduates or candidates, create easy-to-read articles on a wide variety of topics.

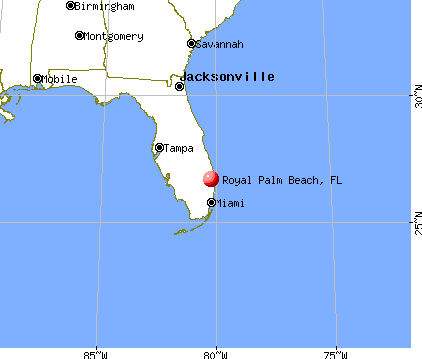
 , pop. 74,157).
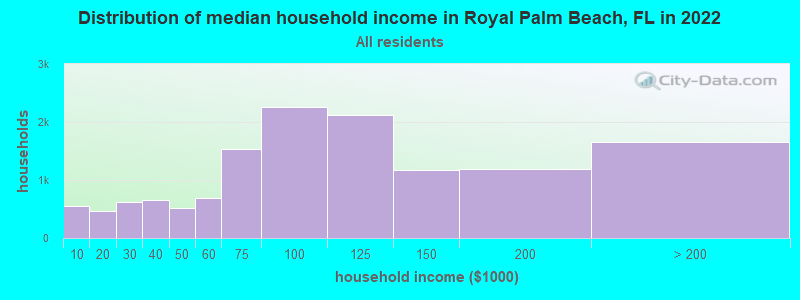
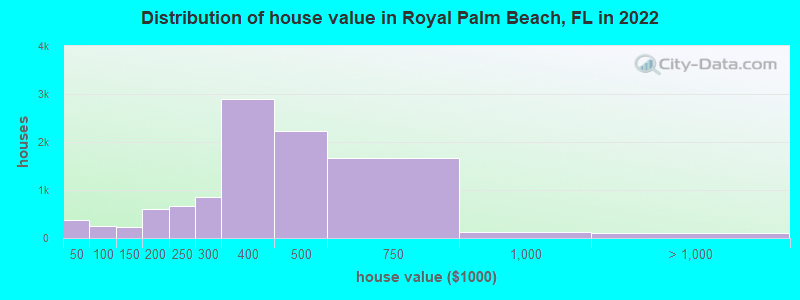
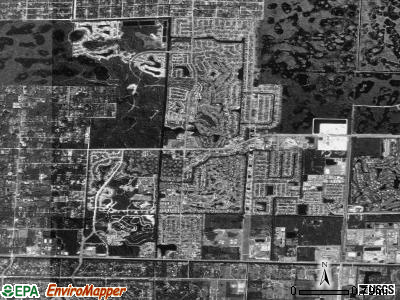
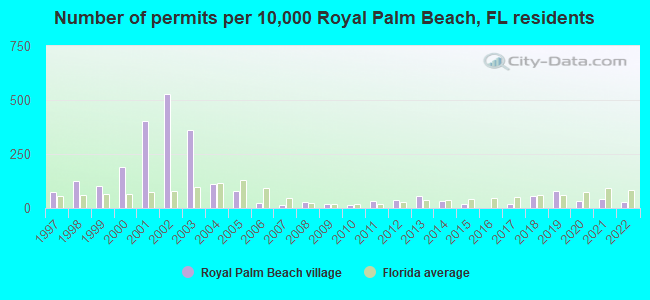
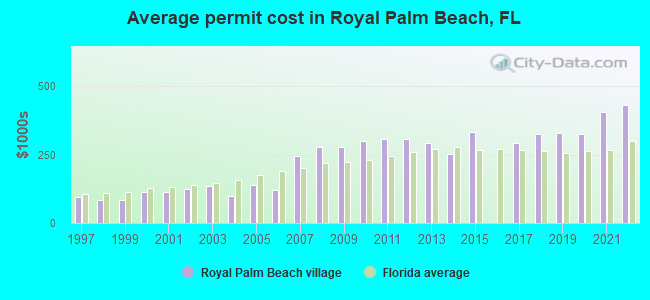
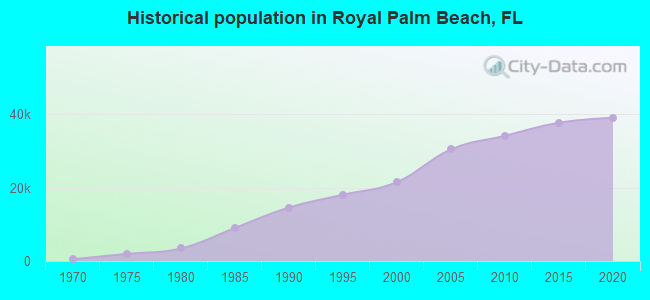
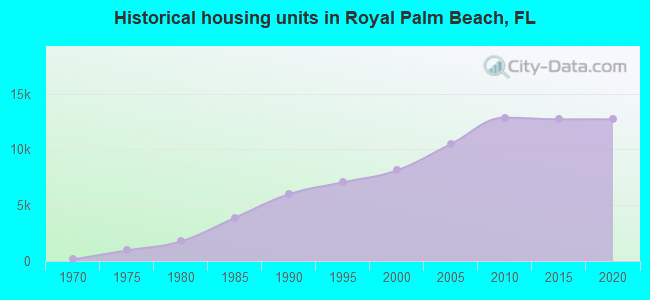
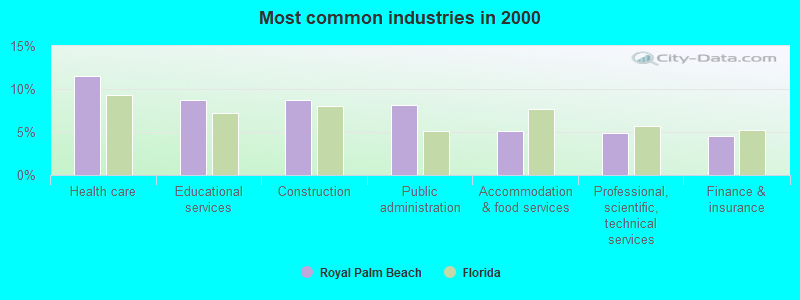
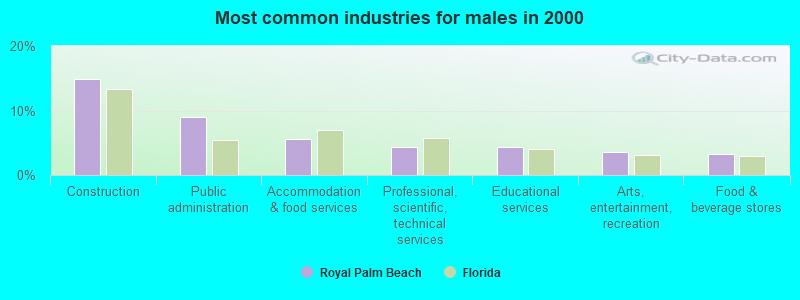
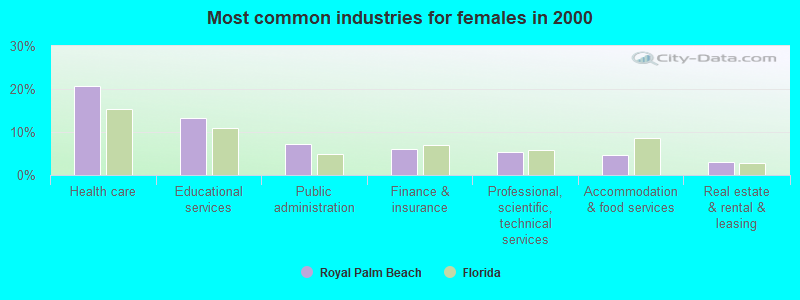
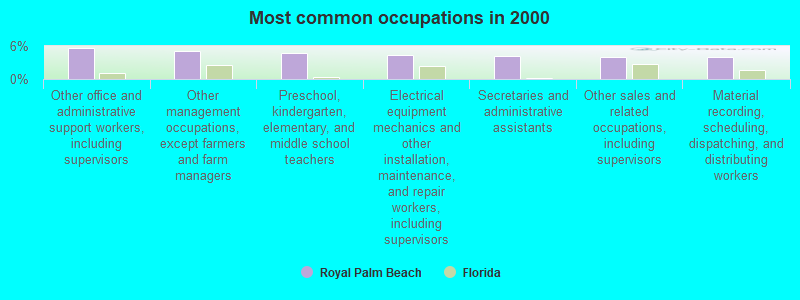
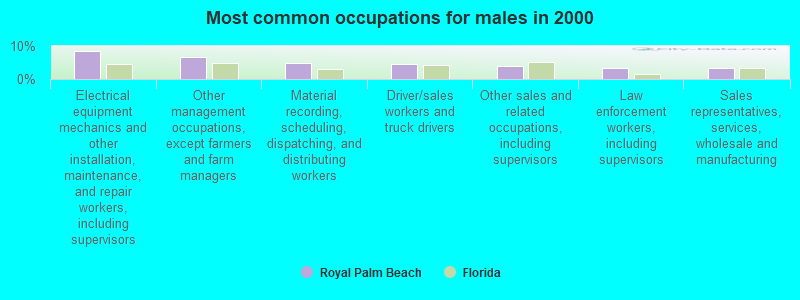
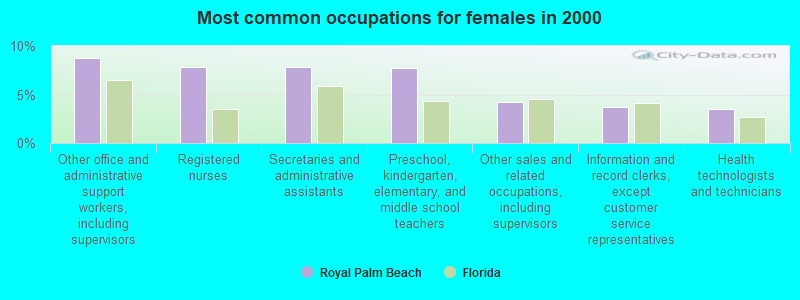
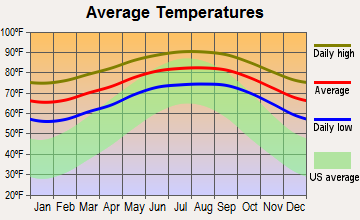
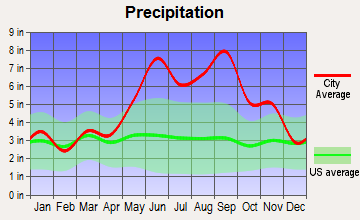
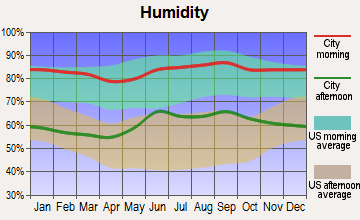
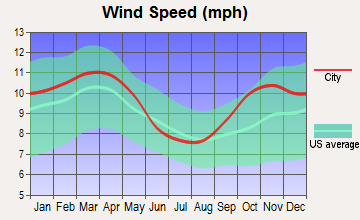
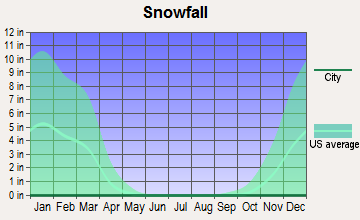
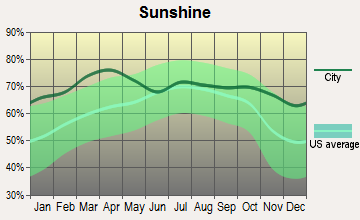
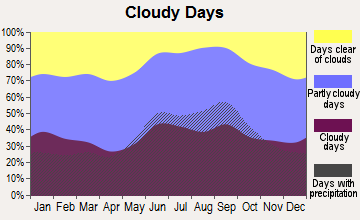
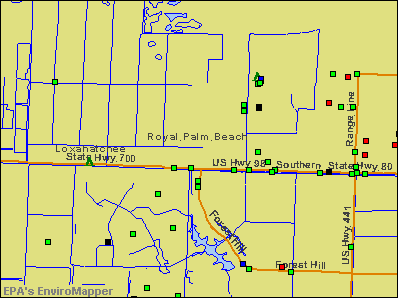

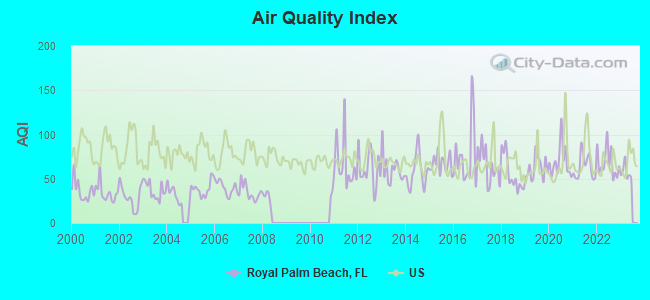
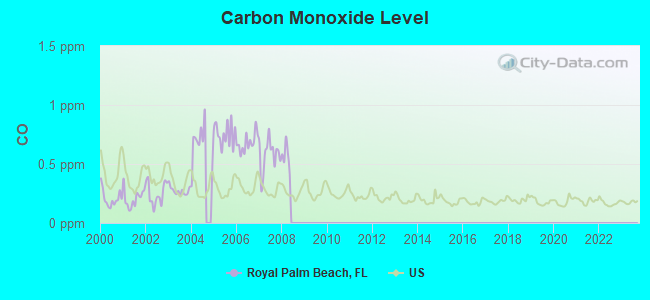
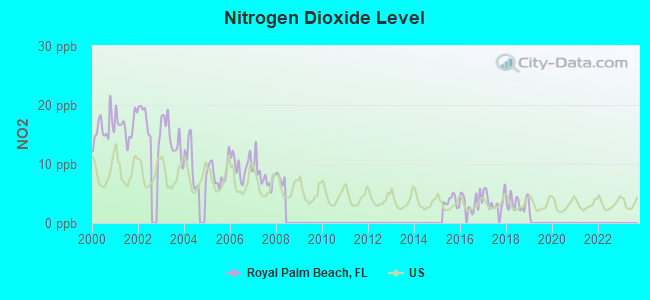
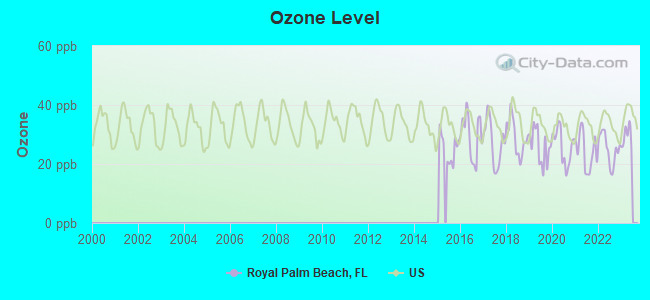
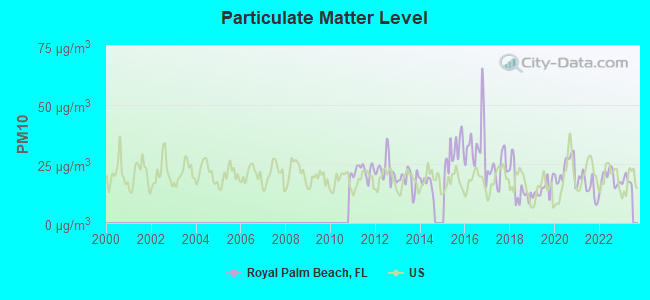
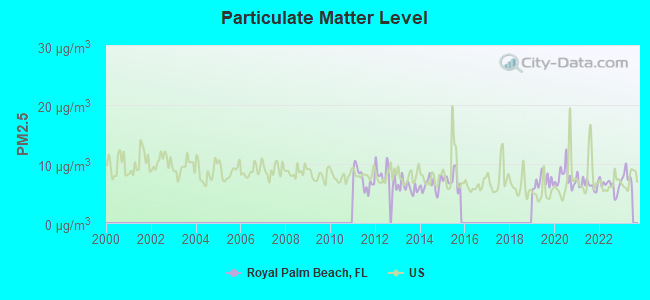
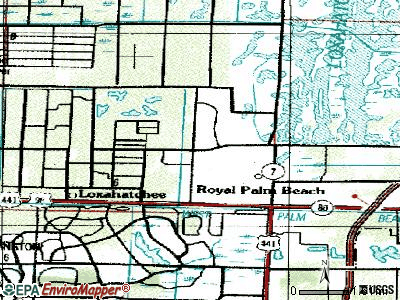
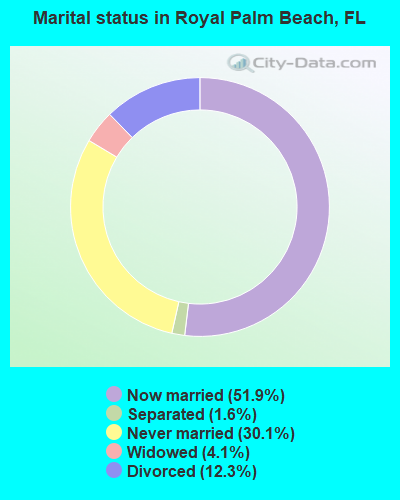
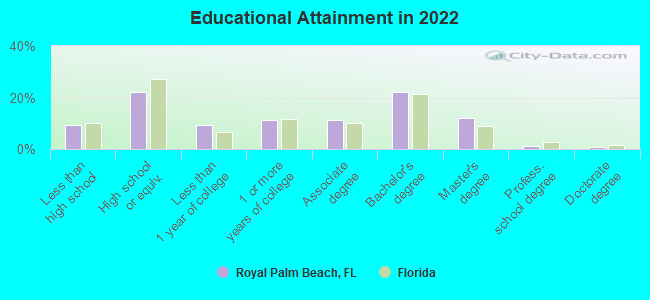
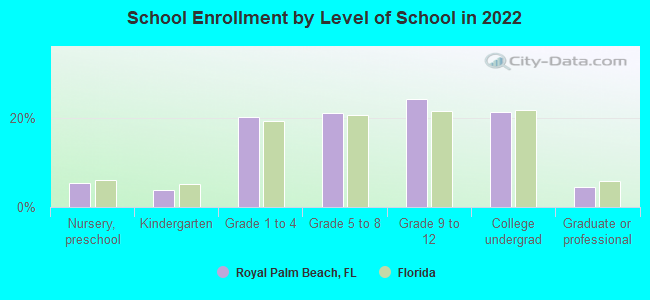
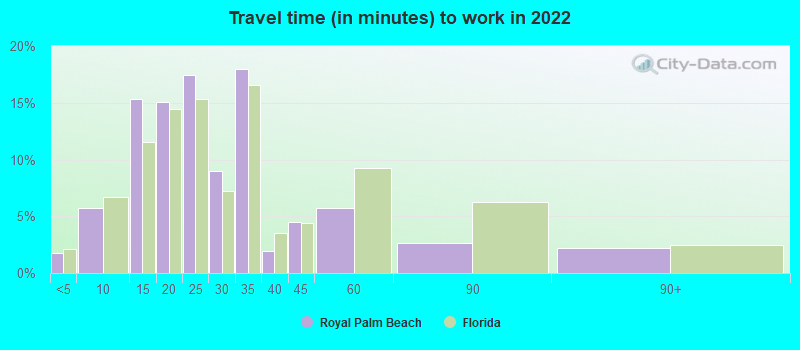
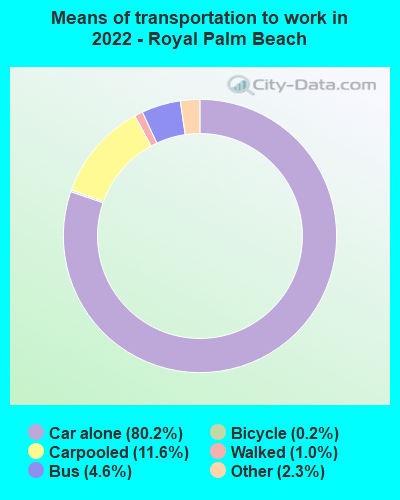
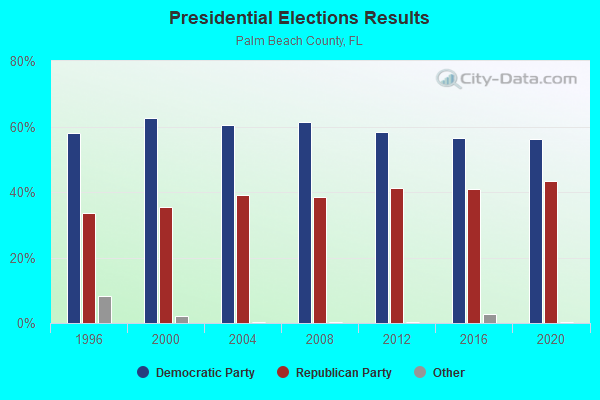
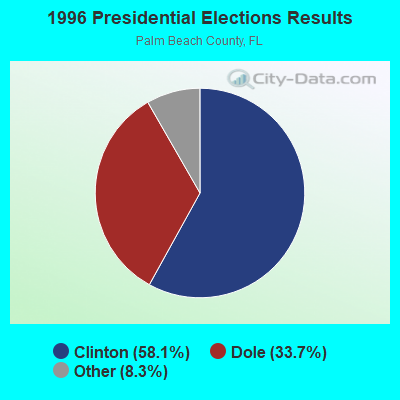
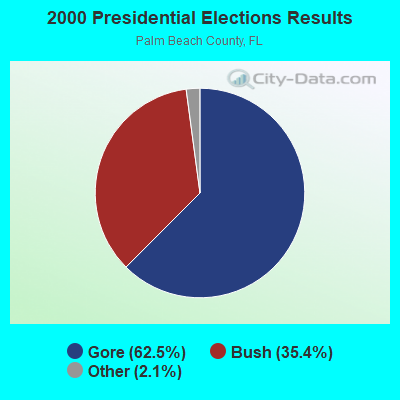

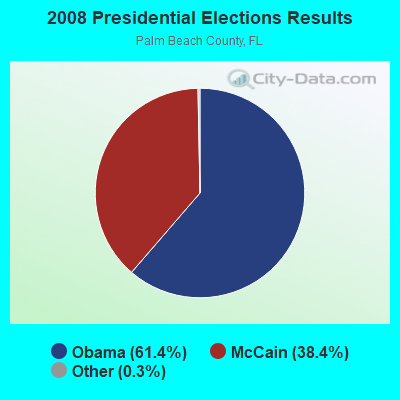
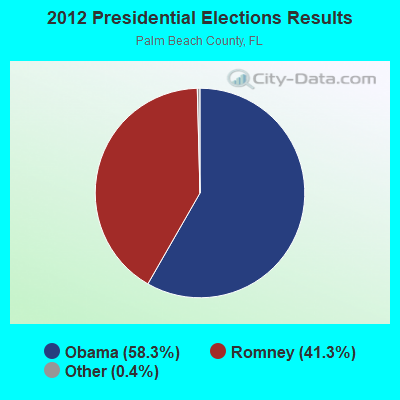
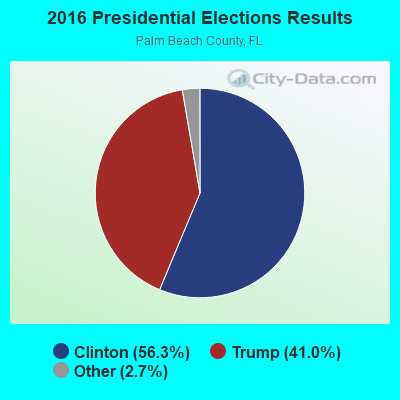
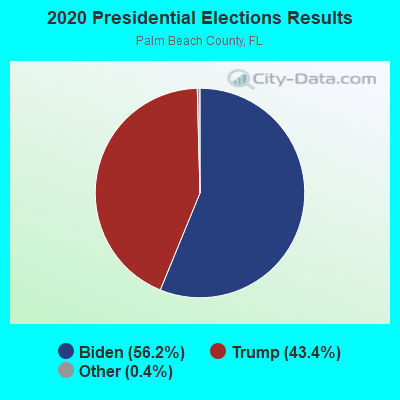
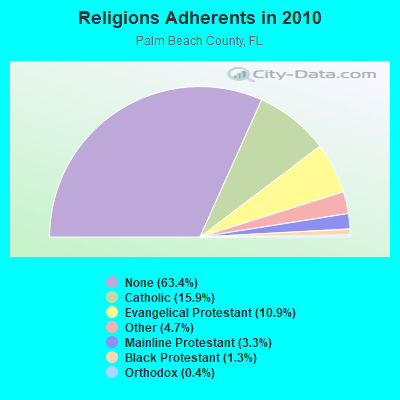
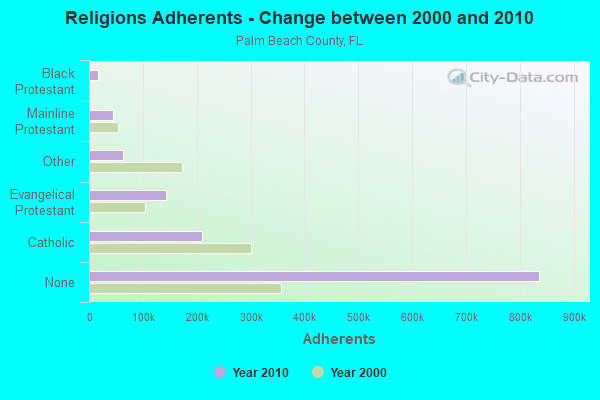
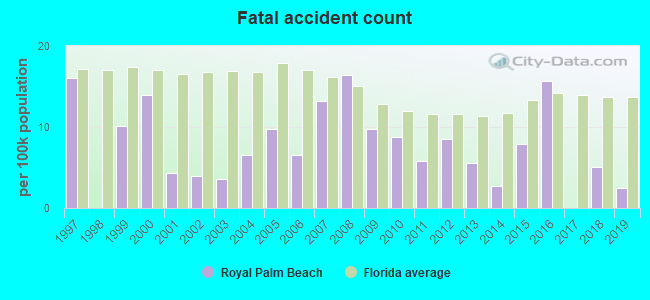
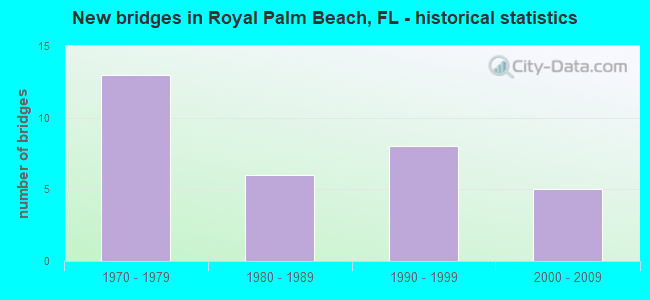
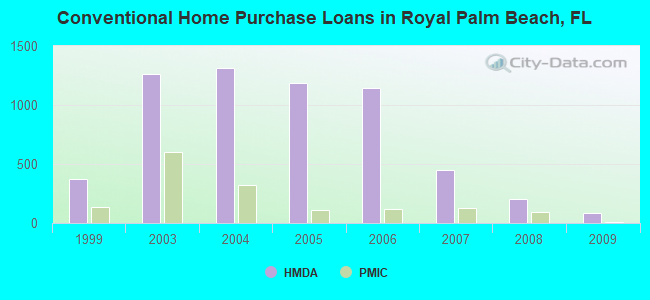
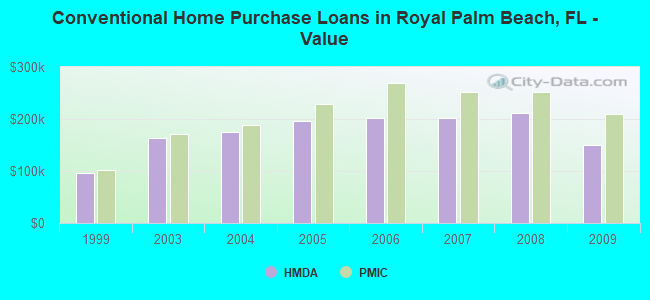
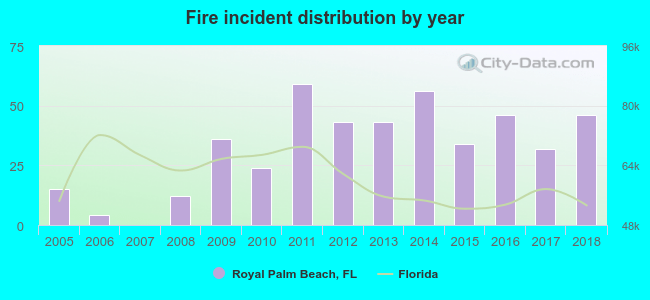 According to the data from the years 2005 - 2018 the average number of fires per year is 32. The highest number of reported fires - 59 took place in 2011, and the least - 0 in 2007. The data has an increasing trend.
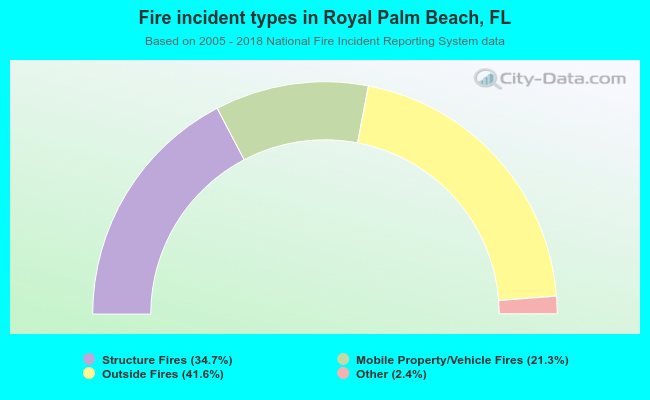 When looking into fire subcategories, the most reports belonged to: Outside Fires (41.6%), and Structure Fires (34.7%).