Red Hill, SC (South Carolina) Houses and Residents
Estimated median house or condo value in 2022: $259,107 (it was $104,100 in 2000 )
Red Hill:
$259,107South Carolina:
$254,600
Lower value quartile - upper value quartile: $164,279 - $318,340Total population: 13,223 (Urban population: 10,240, Rural population: 383 (16 farm, 367 nonfarm ))
Houses: 6,885 (6,034 occupied: 4,813 owner occupied, 1,725 renter occupied )
% of renters here:
26%State:
28%
Housing density: 630 houses/condos per square mile
Median price asked for vacant for-sale houses and condos in 2022 in this county: $181,874.
Median contract rent in 2022: $918 (lower quartile is $708, upper quartile is $1,158)
Median rent asked for vacant for-rent units in 2022: $1,251
Median gross rent in Red Hill, SC in 2022: $1,107
Housing units in Red Hill with a mortgage: 2,636 (287 second mortgage, 0 home equity loan, 181 both second mortgage and home equity loan )Houses without a mortgage: 135
Median household income for houses/condos with a mortgage: $77,362
Median household income for apartments without a mortgage: $46,973
Median monthly housing costs: $928
Data:
Median house or condo value ($)
Median house or condo value ($ change since 2000)
Median house or condo value ($) - White
Median house or condo value ($) - Black or African American
Median house or condo value ($) - Asian
Median house or condo value ($) - Hispanic or Latino
Median house or condo value ($) - American Indian and Alaska Native
Median house or condo value ($) - Multirace
Median house or condo value ($) - Other Race
Median price asked for mobile homes ($)
Household density (households per square mile)
Mean house or condo value by units in structure - 1, detached ($)
Mean house or condo value by units in structure - 1, attached ($)
Mean house or condo value by units in structure - 2 ($)
Mean house or condo value by units in structure by units in structure - 3 or 4 ($)
Mean house or condo value by units in structure - 5 or more ($)
Mean house or condo value by units in structure - Boat, RV, van, etc. ($)
Mean house or condo value by units in structure - Mobile home ($)
Median contract rent ($)
Median contract rent - Lower quartile ($)
Median contract rent - Upper quartile ($)
Median gross rent ($)
Urban houses (%)
Rural houses (%)
Houses occupied (%)
Houses occupied (% change since 2000)
Houses owner occupied (%)
Houses owner occupied (% change since 2000)
Houses renter occupied (%)
Houses renter occupied (% change since 2000)
Vacant housing units - For rent (%)
Vacant housing units - For rent (% change since 2000)
Vacant housing units - For sale only (%)
Vacant housing units - For sale only (% change since 2000)
Vacant housing units - Rented or sold, not occupied (%)
Vacant housing units - Rented or sold, not occupied (% change since 2000)
Vacant housing units - For seasonal, recreational, or occasional use (%)
Vacant housing units - For seasonal, recreational, or occasional use (% change since 2000)
Vacant housing units - For migrant workers (%)
Vacant housing units - For migrant workers (% change since 2000)
Vacant housing units - Other vacant (%)
Vacant housing units - Other vacant (% change since 2000)
Median monthly housing costs ($)
Median household income for houses/condos with a mortgage ($)
Median household income for houses/condos without a mortgage ($)
Median household income ($)
Median household income ($) - White
Median household income ($) - Black or African American
Median household income ($) - Asian
Median household income ($) - Hispanic or Latino
Median household income ($) - American Indian and Alaska Native
Median household income ($) - Multirace
Median household income ($) - Other Race
Mortgage status - with mortgage (%)
Mortgage status - with second mortgage (%)
Mortgage status - with home equity loan (%)
Mortgage status - with both second mortgage and home equity loan (%)
Mortgage status - without a mortgage (%)
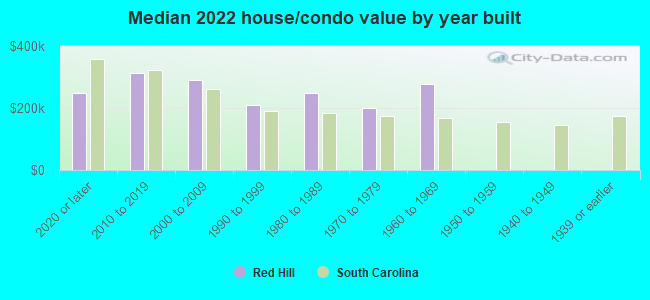
Median year house/condo built
Median year apartment built
Household type by relationship - Male householder living alone (%)
Household type by relationship - Male householder not living alone (%)
Household type by relationship - Female householder living alone (%)
Household type by relationship - Female householder not living alone (%)
Household type by relationship - Opposite-Sex spouse (%)
Household type by relationship - Same-Sex spouse (%)
Household type by relationship - Opposite-Sex unmarried partner (%)
Household type by relationship - Same-Sex unmarried partner (%)
Household type by relationship - In group quarters (%)
Size of family households - 2-person household (%)
Size of family households - 3-person household (%)
Size of family households - 4-person household (%)
Size of family households - 5-person household (%)
Size of family households - 6-person household (%)
Size of family households - 7-or-more-person household (%)
Size of nonfamily households - 1-person household (%)
Size of nonfamily households - 2-person household (%)
Size of nonfamily households - 3-person household (%)
Size of nonfamily households - 4-person household (%)
Size of nonfamily households - 5-person household (%)
Size of nonfamily households - 6-person household (%)
Size of nonfamily households - 7-or-moreperson household (%)
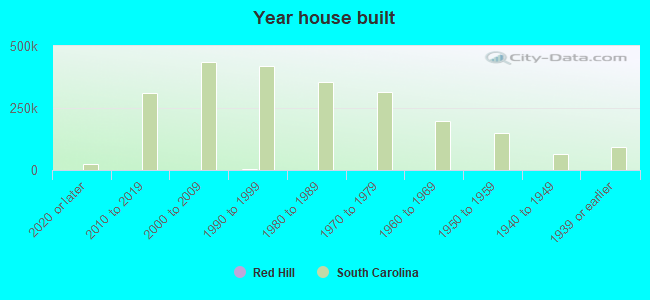
Year house built - Built 2010 or later (%)
Year house built - Built 2000 to 2009 (%)
Year house built - Built 1990 to 1999 (%)
Year house built - Built 1980 to 1989 (%)
Year house built - Built 1970 to 1979 (%)
Year house built - Built 1960 to 1969 (%)
Year house built - Built 1950 to 1959 (%)
Year house built - Built 1940 to 1949 (%)
Year house built - Built 1939 or earlier (%)
Median number of rooms in houses and condos
Median number of rooms in apartments
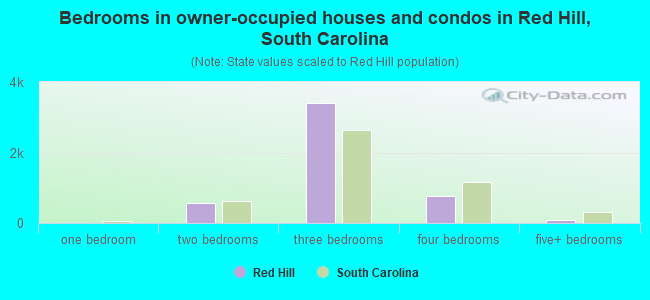
Median number of bedrooms in owner occupied houses
Mean number of bedrooms in owner occupied houses
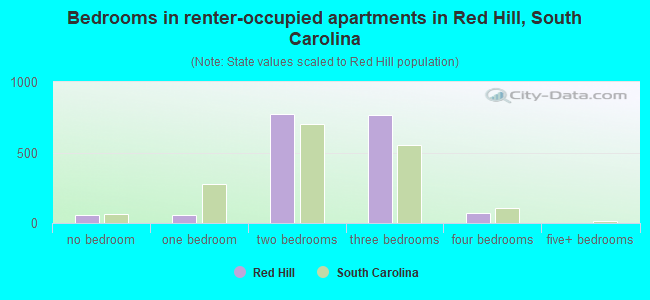
Median number of bedrooms in renter occupied houses
Mean number of bedrooms in renter occupied houses
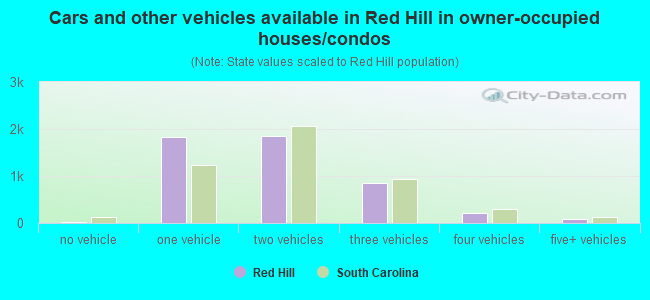
Median number of vehichles in owner occupied houses
Mean number of vehichles in owner occupied houses
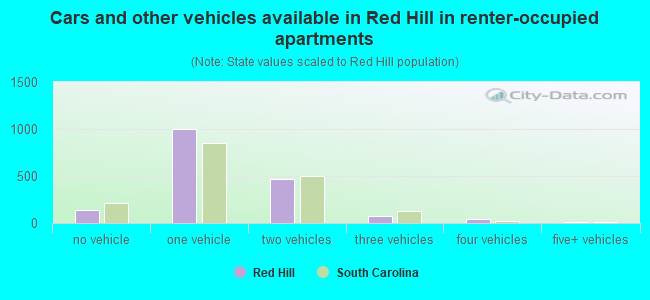
Median number of vehichles in renter occupied houses
Mean number of vehichles in renter occupied houses
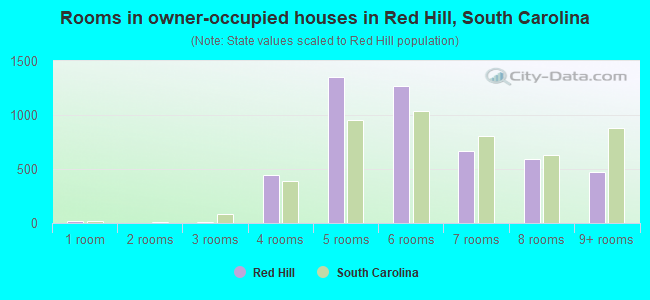
Rooms in owner-occupied houses - 1 room (%)
Rooms in owner-occupied houses - 2 rooms (%)
Rooms in owner-occupied houses - 3 rooms (%)
Rooms in owner-occupied houses - 4 rooms (%)
Rooms in owner-occupied houses - 5 rooms (%)
Rooms in owner-occupied houses - 6 rooms (%)
Rooms in owner-occupied houses - 7 rooms (%)
Rooms in owner-occupied houses - 8 rooms (%)
Rooms in owner-occupied houses - 9+ rooms (%)
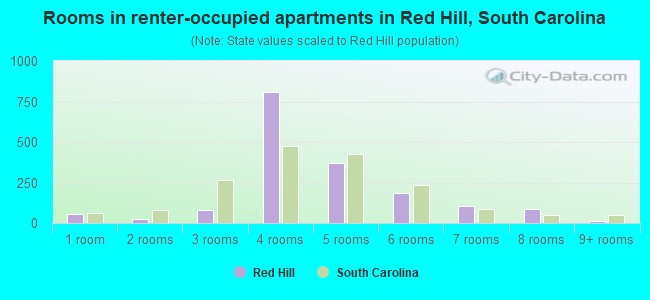
Rooms in renter-occupied houses - 1 room (%)
Rooms in renter-occupied houses - 2 rooms (%)
Rooms in renter-occupied houses - 3 rooms (%)
Rooms in renter-occupied houses - 4 rooms (%)
Rooms in renter-occupied houses - 5 rooms (%)
Rooms in renter-occupied houses - 6 rooms (%)
Rooms in renter-occupied houses - 7 rooms (%)
Rooms in renter-occupied houses - 8 rooms (%)
Rooms in renter-occupied houses - 9+ rooms (%)
Bedrooms in owner-occupied houses - no bedrooms (%)
Bedrooms in owner-occupied houses - 1 bedroom (%)
Bedrooms in owner-occupied houses - 2 bedrooms (%)
Bedrooms in owner-occupied houses - 3 bedrooms (%)
Bedrooms in owner-occupied houses - 4 bedrooms (%)
Bedrooms in owner-occupied houses - 5+ bedrooms (%)
Bedrooms in renter-occupied houses - no bedrooms (%)
Bedrooms in renter-occupied houses - 1 bedroom (%)
Bedrooms in renter-occupied houses - 2 bedrooms (%)
Bedrooms in renter-occupied houses - 3 bedrooms (%)
Bedrooms in renter-occupied houses - 4 bedrooms (%)
Bedrooms in renter-occupied houses - 5+ bedrooms (%)
Vehicles available in owner-occupied houses - no vehicle available (%)
Vehicles available in owner-occupied houses - 1 vehicle available(%)
Vehicles available in owner-occupied houses - 2 Vehicles available (%)
Vehicles available in owner-occupied houses - 3 Vehicles available (%)
Vehicles available in owner-occupied houses - 4 Vehicles available (%)
Vehicles available in owner-occupied houses - 5+ Vehicles available (%)
Vehicles available in renter-occupied houses - no vehicle available (%)
Vehicles available in renter-occupied houses - 1 vehicle available (%)
Vehicles available in renter-occupied houses - 2 Vehicles available (%)
Vehicles available in renter-occupied houses - 3 Vehicles available (%)
Vehicles available in renter-occupied houses - 4 Vehicles available (%)
Vehicles available in renter-occupied houses - 5+ Vehicles available (%)
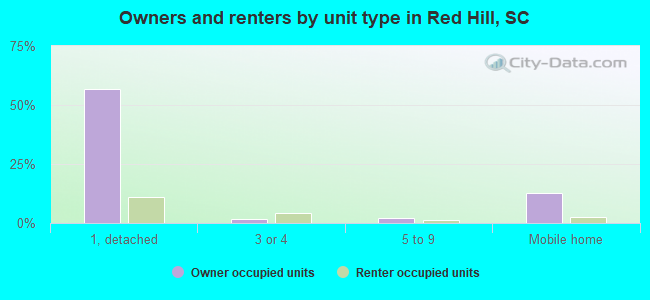
Housing units in structures - 1, detached (%)
Housing units in structures - 1, attached (%)
Housing units in structures - 2 (%)
Housing units in structures - 3 or 4 (%)
Housing units in structures - 5 to 9 (%)
Housing units in structures - 10 to 19 (%)
Housing units in structures - 20 to 49 (%)
Housing units in structures - 50 or more (%)
Housing units in structures - Mobile home (%)
Housing units in structures - Boat, RV, van, etc. (%)
Housing units in structures - Owners - 1, detached (%)
Housing units in structures - Owners - 1, attached (%)
Housing units in structures - Owners - 2 (%)
Housing units in structures - Owners - 3 or 4 (%)
Housing units in structures - Owners - 5 to 9 (%)
Housing units in structures - Owners - 10 to 19 (%)
Housing units in structures - Owners - 20 to 49 (%)
Housing units in structures - Owners - 50 or more (%)
Housing units in structures - Owners - Mobile home (%)
Housing units in structures - Owners - Boat, RV, van, etc. (%)
Housing units in structures - Renters - 1, detached (%)
Housing units in structures - Renters - 1, attached (%)
Housing units in structures - Renters - 2 (%)
Housing units in structures - Renters - 3 or 4 (%)
Housing units in structures - Renters - 5 to 9 (%)
Housing units in structures - Renters - 10 to 19 (%)
Housing units in structures - Renters - 20 to 49 (%)
Housing units in structures - Renters - 50 or more (%)
Housing units in structures - Renters - Mobile home (%)
Housing units in structures - Renters - Boat, RV, van, etc. (%)
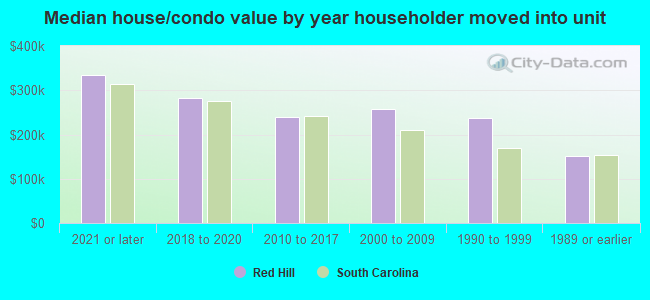
House/condo owner moved in on average (years ago)
Renter moved in on average (years ago)
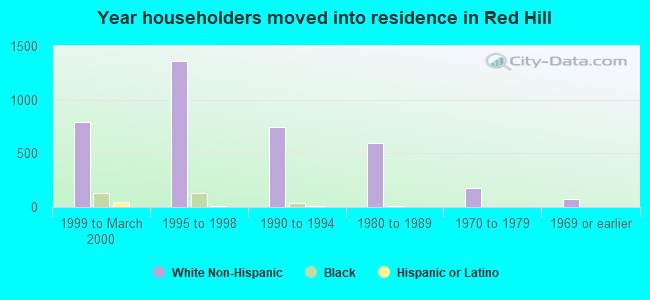
Year householder moved into unit - Moved in 1999 to March 2000 (%)
Year householder moved into unit - Moved in 1999 to March 2000 (%) - White
Year householder moved into unit - Moved in 1999 to March 2000 (%) - Black or African American
Year householder moved into unit - Moved in 1999 to March 2000 (%) - Asian
Year householder moved into unit - Moved in 1999 to March 2000 (%) - Hispanic or Latino
Year householder moved into unit - Moved in 1999 to March 2000 (%) - American Indian and Alaska Native
Year householder moved into unit - Moved in 1999 to March 2000 (%) - Multirace
Year householder moved into unit - Moved in 1999 to March 2000 (%) - Other Race
Year householder moved into unit - Moved in 1995 to 1998 (%)
Year householder moved into unit - Moved in 1995 to 1998 (%) - White
Year householder moved into unit - Moved in 1995 to 1998 (%) - Black or African American
Year householder moved into unit - Moved in 1995 to 1998 (%) - Asian
Year householder moved into unit - Moved in 1995 to 1998 (%) - Hispanic or Latino
Year householder moved into unit - Moved in 1995 to 1998 (%) - American Indian and Alaska Native
Year householder moved into unit - Moved in 1995 to 1998 (%) - Multirace
Year householder moved into unit - Moved in 1995 to 1998 (%) - Other Race
Year householder moved into unit - Moved in 1990 to 1994 (%)
Year householder moved into unit - Moved in 1990 to 1994 (%) - White
Year householder moved into unit - Moved in 1990 to 1994 (%) - Black or African American
Year householder moved into unit - Moved in 1990 to 1994 (%) - Asian
Year householder moved into unit - Moved in 1990 to 1994 (%) - Hispanic or Latino
Year householder moved into unit - Moved in 1990 to 1994 (%) - American Indian and Alaska Native
Year householder moved into unit - Moved in 1990 to 1994 (%) - Multirace
Year householder moved into unit - Moved in 1990 to 1994 (%) - Other Race
Year householder moved into unit - Moved in 1980 to 1989 (%)
Year householder moved into unit - Moved in 1980 to 1989 (%) - White
Year householder moved into unit - Moved in 1980 to 1989 (%) - Black or African American
Year householder moved into unit - Moved in 1980 to 1989 (%) - Asian
Year householder moved into unit - Moved in 1980 to 1989 (%) - Hispanic or Latino
Year householder moved into unit - Moved in 1980 to 1989 (%) - American Indian and Alaska Native
Year householder moved into unit - Moved in 1980 to 1989 (%) - Multirace
Year householder moved into unit - Moved in 1980 to 1989 (%) - Other Race
Year householder moved into unit - Moved in 1970 to 1979 (%)
Year householder moved into unit - Moved in 1970 to 1979 (%) - White
Year householder moved into unit - Moved in 1970 to 1979 (%) - Black or African American
Year householder moved into unit - Moved in 1970 to 1979 (%) - Asian
Year householder moved into unit - Moved in 1970 to 1979 (%) - Hispanic or Latino
Year householder moved into unit - Moved in 1970 to 1979 (%) - American Indian and Alaska Native
Year householder moved into unit - Moved in 1970 to 1979 (%) - Multirace
Year householder moved into unit - Moved in 1970 to 1979 (%) - Other Race
Year householder moved into unit - Moved in 1969 or earlier (%)
Year householder moved into unit - Moved in 1969 or earlier (%) - White
Year householder moved into unit - Moved in 1969 or earlier (%) - Black or African American
Year householder moved into unit - Moved in 1969 or earlier (%) - Asian
Year householder moved into unit - Moved in 1969 or earlier (%) - Hispanic or Latino
Year householder moved into unit - Moved in 1969 or earlier (%) - American Indian and Alaska Native
Year householder moved into unit - Moved in 1969 or earlier (%) - Multirace
Year householder moved into unit - Moved in 1969 or earlier (%) - Other Race
Housing units lacking complete plumbing facilities (%)
Housing units lacking complete kitchen facilities (%)
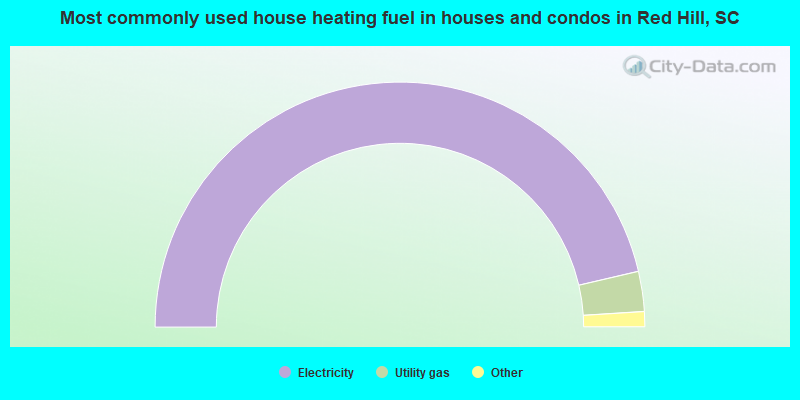
House heating fuel used in houses and condos - Utility gas (%)
House heating fuel used in houses and condos - Bottled, tank, or LP gas (%)
House heating fuel used in houses and condos - Electricity (%)
House heating fuel used in houses and condos - Fuel oil, kerosene, etc. (%)
House heating fuel used in houses and condos - Coal or coke (%)
House heating fuel used in houses and condos - Wood (%)
House heating fuel used in houses and condos - Solar energy (%)
House heating fuel used in houses and condos - Other fuel (%)
House heating fuel used in houses and condos - No fuel used (%)
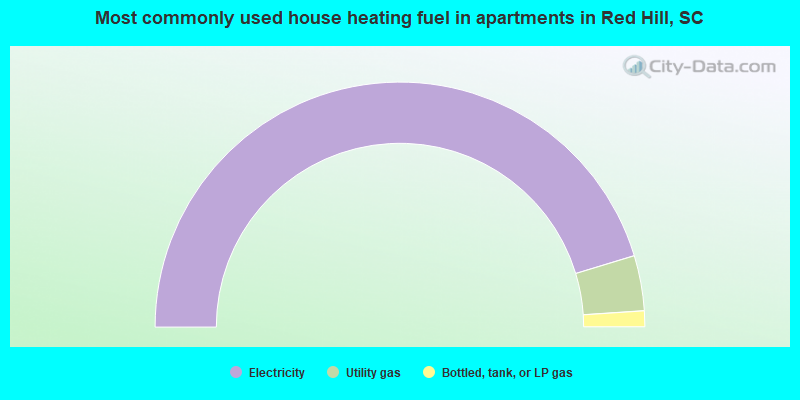
House heating fuel used in apartments - Utility gas (%)
House heating fuel used in apartments - Bottled, tank, or LP gas (%)
House heating fuel used in apartments - Electricity (%)
House heating fuel used in apartments - Fuel oil, kerosene, etc. (%)
House heating fuel used in apartments - Coal or coke (%)
House heating fuel used in apartments - Wood (%)
House heating fuel used in apartments - Solar energy (%)
House heating fuel used in apartments - Other fuel (%)
House heating fuel used in apartments - No fuel used (%)
Median year house/condo built: 1998Median year apartment built: 1992Household type by relationship:
Households: 16,744
Male householders: 2,854 (682 living alone ), Female householders: 3,314 (774 living alone )2,883 spouses (2,861 opposite-sex spouses ), 282 unmarried partners , (269 opposite-sex unmarried partners ), 4,432 children (4,252 natural , 172 adopted , 7 stepchildren ), 501 grandchildren , 76 brothers or sisters , 252 parents , 16 foster children , 149 other relatives , 1,884 non-relatives In group quarters: 95
Size of family households: 2,595 2-persons , 1,134 3-persons , 502 4-persons , 259 5-persons , 11 6-persons .
Size of nonfamily households: 1,466 1-person , 422 2-persons , 25 3-persons , 74 4-persons , 70 5-persons .
1,577 married couples with children. single-parent households (166 men , 1,016 women ).
89.0% of residents of Red Hill speak English at home. of residents speak Spanish at home (77% speak English very well , 13% speak English well , 10% speak English not well ).of residents speak other Indo-European language at home (93% speak English very well , 7% speak English well ).of residents speak Asian or Pacific Island language at home (76% speak English very well , 15% speak English well , 10% speak English not well ).
Foreign born population: 730 (4.4%)of them are naturalized citizens )
Median number of rooms in houses and condos:
Median number of rooms in apartments
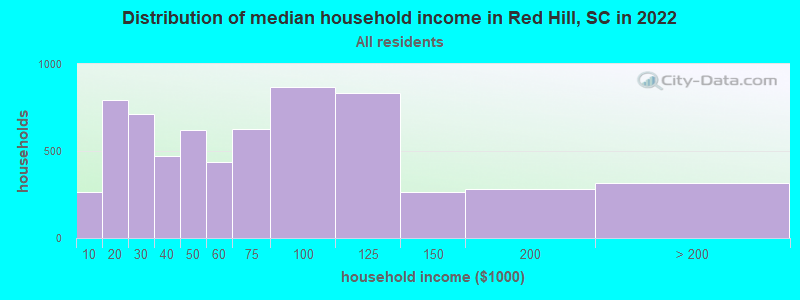
Red Hill, SC household income distribution 266 Less than $10,000792 $10,000 to $19,999714 $20,000 to $29,999470 $30,000 to $39,999623 $40,000 to $49,999436 $50,000 to $59,999629 $60,000 to $74,999869 $75,000 to $99,999833 $100,000 to $124,999267 $125,000 to $149,999282 $150,000 to $199,999314 $200,000 or more
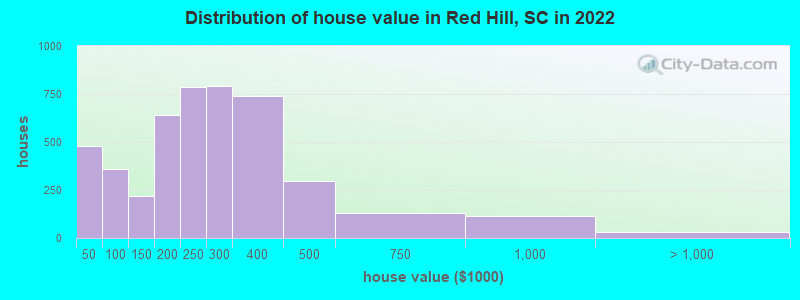
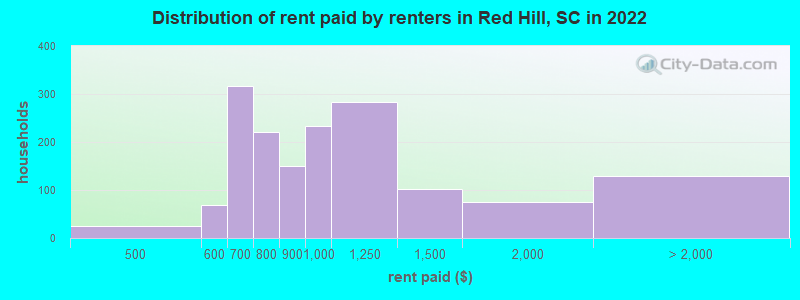
Home value of owner - occupied houses in 2022 in Red Hill, SC 52 Less than $10,00056 $10,000 to $14,999168 $15,000 to $19,99922 $20,000 to $24,99991 $25,000 to $29,99935 $30,000 to $34,99916 $35,000 to $39,99935 $40,000 to $49,999119 $50,000 to $59,99973 $60,000 to $69,99913 $70,000 to $79,99970 $80,000 to $89,99945 $90,000 to $99,99976 $100,000 to $124,999145 $125,000 to $149,999322 $150,000 to $174,999316 $175,000 to $199,999785 $200,000 to $249,999792 $250,000 to $299,999740 $300,000 to $399,999297 $400,000 to $499,999129 $500,000 to $749,999111 $750,000 to $999,99931 $1,000,000 to $1,499,999Rent paid by renters in 2022 in Red Hill, SC 26 $450 to $49928 $500 to $54940 $550 to $599260 $600 to $64955 $650 to $699144 $700 to $74975 $750 to $799150 $800 to $899233 $900 to $999283 $1,000 to $1,249101 $1,250 to $1,49976 $1,500 to $1,999129 No cash rent
Percentage of workers working in this county: 94.1%Number of people working at home: 452 (6.2% of all workers )
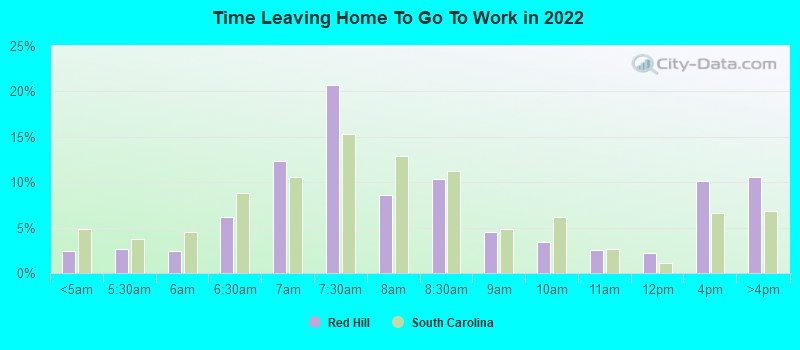
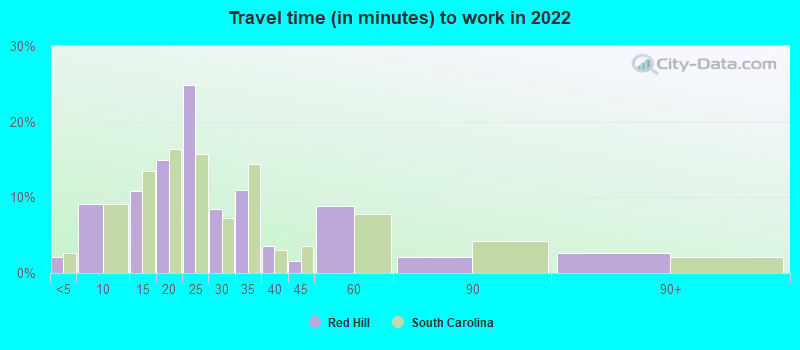
Travel time to work (commute)
Less than 5 minutes: 1575 to 9 minutes: 87610 to 14 minutes: 57015 to 19 minutes: 1,08220 to 24 minutes: 1,73925 to 29 minutes: 54630 to 34 minutes: 1,15635 to 39 minutes: 6840 to 44 minutes: 11945 to 59 minutes: 27960 to 89 minutes: 8590 or more minutes: 40
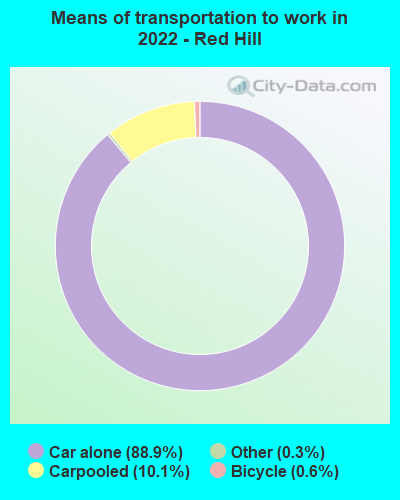
Means of transportation to work:
Drove a car alone: 2,577 (74.9%)Carpooled: 359 (10.4%)Taxi: 17 (0.5%)Bicycle: 18 (0.5%)Walked: 2 (0.1%)Worked at home: 452 (13.1%)
Unemployment by race in 2022
Unemployment rate for White non-Hispanic residents 0.6% Males3.2% FemalesUnemployment rate for Black residents 21.4% MalesUnemployment rate for American Indian and Alaska Native residents 30.5% MalesUnemployment rate for Asian residents 44.8% MalesUnemployment rate for other race residents 26.3% MalesUnemployment rate for two or more race residents 43.9% Males3.6% FemalesUnemployment rate for Hispanic or Latino residents 15.1% Males
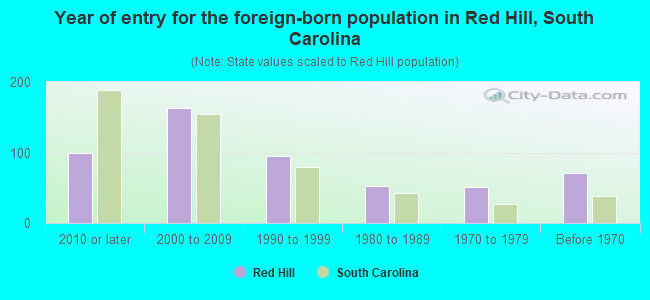
Year of entry for the foreign-born population in Red Hill, South Carolina
99 2010 or later 163 2000 to 2009 95 1990 to 1999 52 1980 to 1989 51 1970 to 1979 71 Before 1970
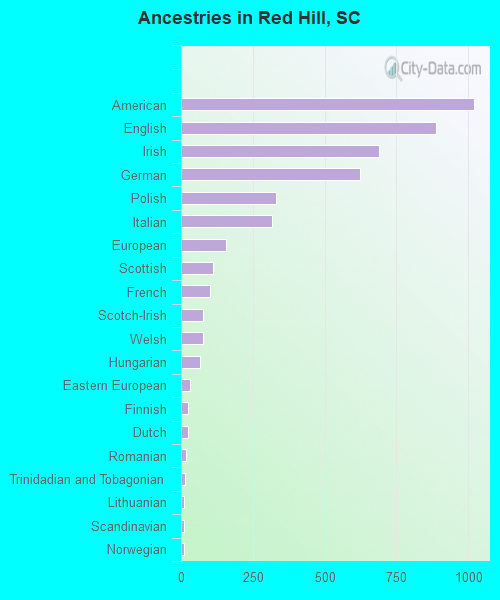
First ancestries reported:
American: 1,022 (11.5%)
English: 888 (10.0%)
Irish: 689 (7.7%)
German: 622 (7.0%)
Polish: 331 (3.7%)
Italian: 317 (3.6%)
European: 157 (1.8%)
Scottish: 112 (1.3%)
French: 100 (1.1%)
Scotch-Irish: 78 (0.9%)
Welsh: 77 (0.9%)
Hungarian: 66 (0.7%)
Eastern European: 30 (0.3%)
Finnish: 26 (0.3%)
Dutch: 24 (0.3%)
Romanian: 18 (0.2%)
Trinidadian and Tobagonian: 14 (0.2%)
Lithuanian: 11 (0.1%)
Scandinavian: 11 (0.1%)
Norwegian: 10 (0.1%)
Russian: 9 (0.1%)
Slovak: 4 (0.04%) Most common places of birth for foreign-born residents (%): Mexico Red Hill:
26.3% (170)South Carolina:
22.5% (60,774)
El Salvador Red Hill:
9.8% (63)South Carolina:
1.1% (2,998)
Italy Red Hill:
9.4% (61)South Carolina:
0.5% (1,444)
Dominican Republic Red Hill:
8.2% (53)South Carolina:
0.9% (2,357)
Korea Red Hill:
7.9% (51)South Carolina:
1.7% (4,513)
Philippines Red Hill:
7.1% (46)South Carolina:
4.1% (11,031)
Japan Red Hill:
6.3% (41)South Carolina:
0.8% (2,055)
Honduras Red Hill:
5.3% (34)South Carolina:
4.8% (12,834)
Colombia Red Hill:
4.2% (27)South Carolina:
4.3% (11,533)
Germany Red Hill:
3.9% (25)South Carolina:
3.7% (9,982)
Trinidad and Tobago Red Hill:
3.9% (25)South Carolina:
0.4% (1,084)
Venezuela Red Hill:
2.2% (14)South Carolina:
1.4% (3,822)
Canada Red Hill:
2.2% (14)South Carolina:
3.0% (8,193)
England Red Hill:
2.0% (13)South Carolina:
1.9% (5,117)
Chile Red Hill:
1.9% (12)South Carolina:
0.2% (567)
Netherlands Red Hill:
1.5% (10)South Carolina:
0.3% (727)
Ecuador Red Hill:
1.5% (10)South Carolina:
0.9% (2,502)
Place of birth for U.S.-born residents:
This state: 5,693Other state: 10,058Northeast: 4,909Midwest: 1,716South: 2,992West: 514 85.2% of Red Hill residents lived in the same house 1 years ago.
Out of people who lived in different houses, 37.9% lived in this county.
Out of people who lived in different counties, 23.8% lived in South Carolina.
Red Hill:
85.2%State average:
86.5%
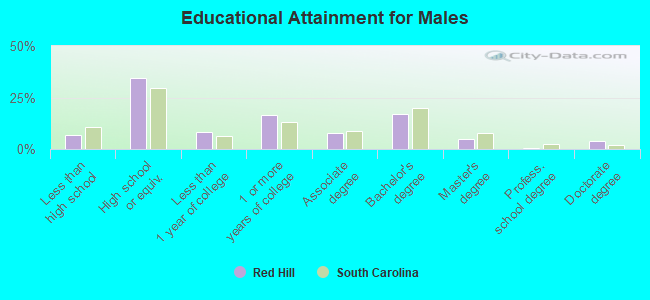
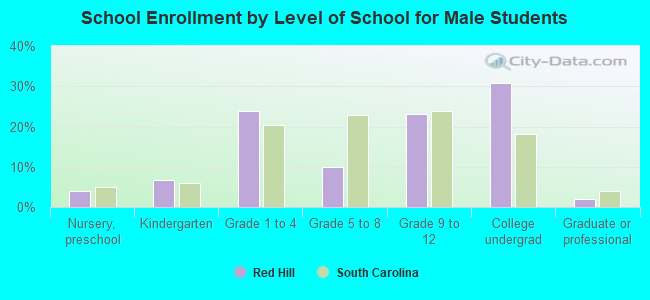
Education attainment for males 25 years and older:
No schooling: 102Nursery to 4th grade: 05th and 6th grade: 157th and 8th grade: 479th grade: 6110th grade: 2411th grade: 7112th grade, no diploma: 44High school graduate (or equivalency): 1,869Less than 1 year of college: 455Some college more than 1 year, no degree: 888Associate degree: 416Bachelor's degree: 911Master's degree: 258Professional school degree: 34Doctorate degree: 215
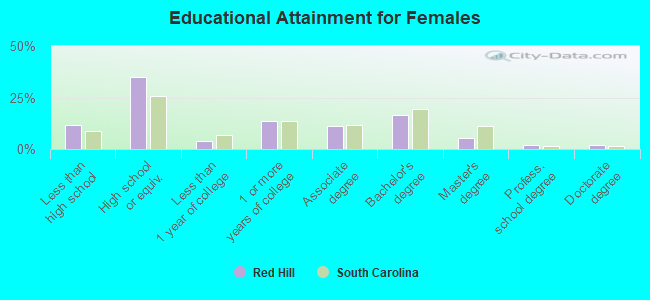
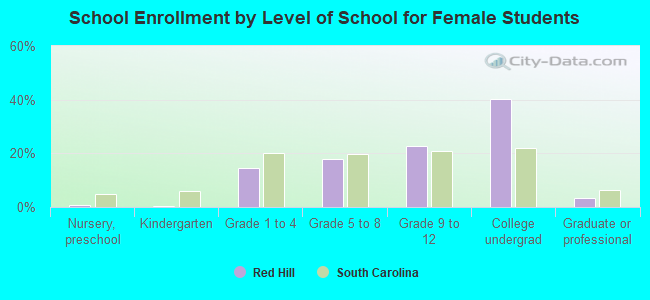
Education attainment for females 25 years and older:
No schooling: 311Nursery to 4th grade: 135th and 6th grade: 07th and 8th grade: 279th grade: 2010th grade: 17611th grade: 14712th grade, no diploma: 45High school graduate (or equivalency): 2,244Less than 1 year of college: 262Some college more than 1 year, no degree: 871Associate degree: 710Bachelor's degree: 1,069Master's degree: 333Professional school degree: 126Doctorate degree: 111
Housing units in structures:
One, detached: 4,380One, attached: 35Two: 843 or 4: 4615 to 9: 44810 to 19: 25920 to 49: 3750 or more: 21Mobile homes: 1,148Boats, RVs, vans, etc.: 7Median worth of mobile homes: $65,389
Housing units lacking complete kitchen facilities in 2022: 0.3%House/condo owner moved in on average 9 years ago
Renter moved in on average 4 years ago
Private vs. public school enrollment:
Students in private schools in grades 1 to 8 (elementary and middle school): 469 Here:
37.2%South Carolina:
14.4%
Students in private schools in grades 9 to 12 (high school): 25 Here:
3.4%South Carolina:
11.1%
Students in private undergraduate colleges: 141 Here:
11.1%South Carolina:
21.9%