Races in Red Hill, South Carolina (SC) Detailed Stats
Data:
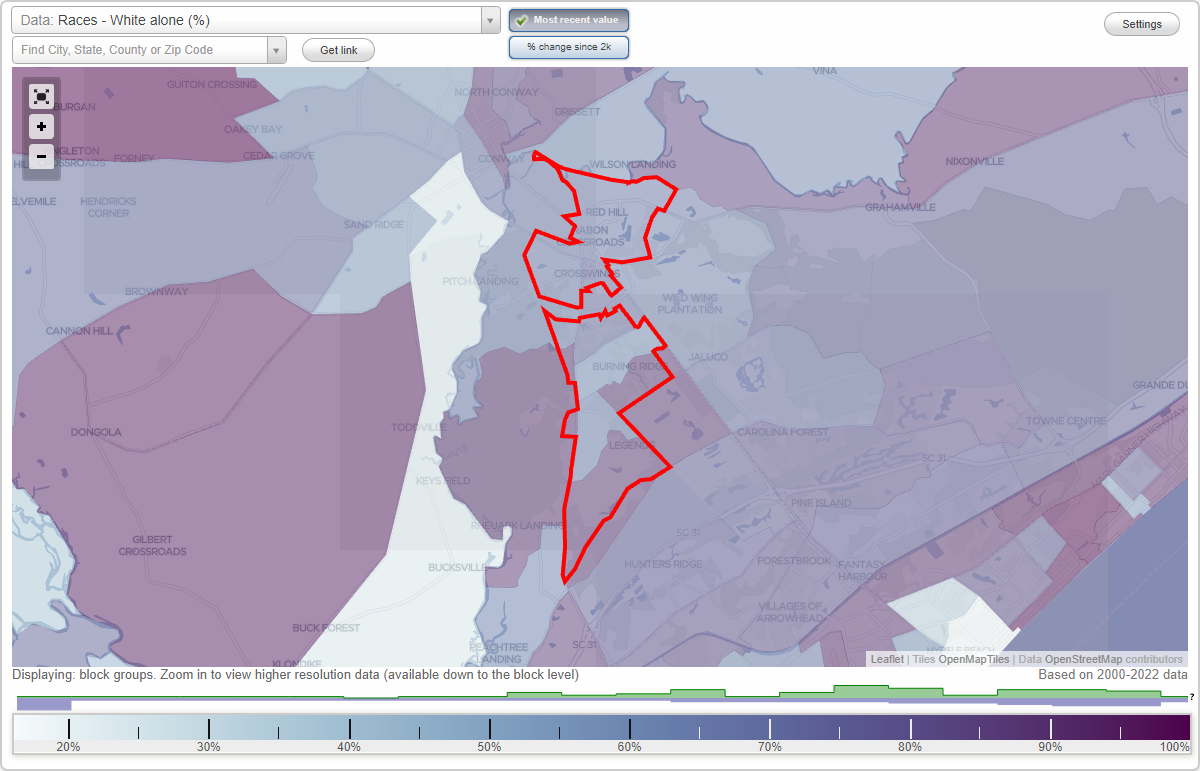
Races - White alone (%)
Races - White alone (% change since 2000)
Races - Black alone (%)
Races - Black alone (% change since 2000)
Races - American Indian alone (%)
Races - American Indian alone (% change since 2000)
Races - Asian alone (%)
Races - Asian alone (% change since 2000)
Races - Hispanic (%)
Races - Hispanic (% change since 2000)
Races - Native Hawaiian and Other Pacific Islander alone (%)
Races - Native Hawaiian and Other Pacific Islander alone (% change since 2000)
Races - Two or more races(%)
Races - Two or more races(% change since 2000)
Races - Other race alone (%)
Races - Other race alone (% change since 2000)
Racial diversity
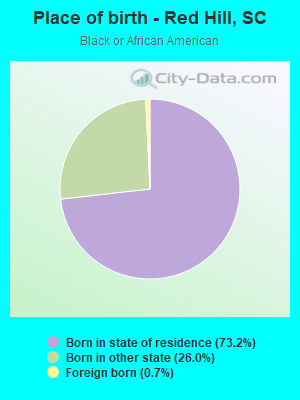
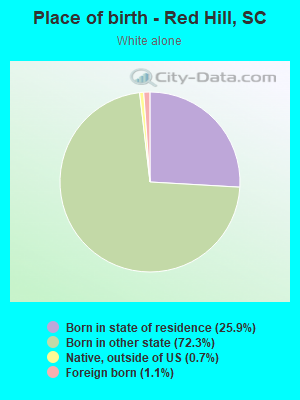
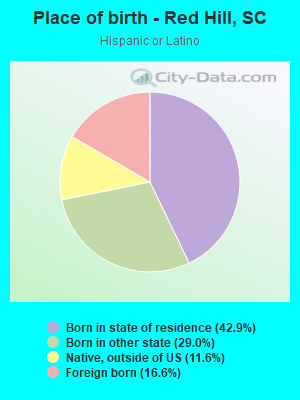
Place of birth - Born in state of residence (%)
Place of birth - Born in state of residence (%) - White
Place of birth - Born in state of residence (%) - Black or African American
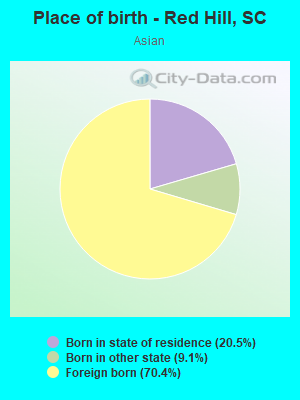
Place of birth - Born in state of residence (%) - Asian
Place of birth - Born in state of residence (%) - Hispanic or Latino
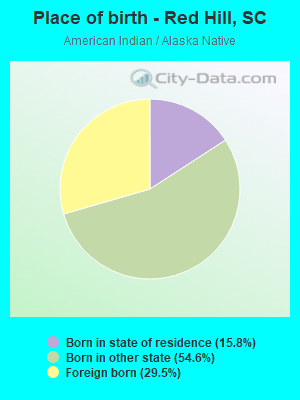
Place of birth - Born in state of residence (%) - American Indian and Alaska Native
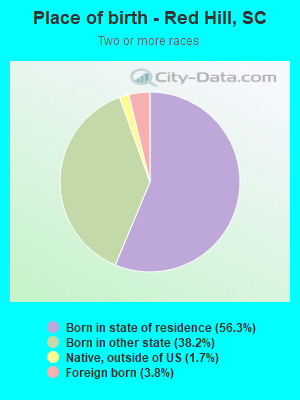
Place of birth - Born in state of residence (%) - Multirace
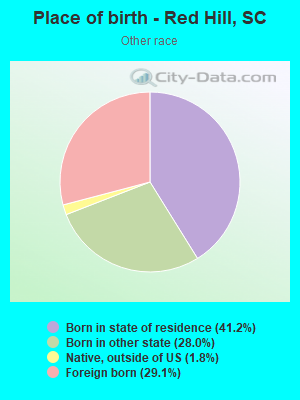
Place of birth - Born in state of residence (%) - Other Race
Place of birth - Born in other state (%)
Place of birth - Born in other state (%) - White
Place of birth - Born in other state (%) - Black or African American
Place of birth - Born in other state (%) - Asian
Place of birth - Born in other state (%) - Hispanic or Latino
Place of birth - Born in other state (%) - American Indian and Alaska Native
Place of birth - Born in other state (%) - Multirace
Place of birth - Born in other state (%) - Other Race
Place of birth - Native, outside of US (%)
Place of birth - Native, outside of US (%) - White
Place of birth - Native, outside of US (%) - Black or African American
Place of birth - Native, outside of US (%) - Asian
Place of birth - Native, outside of US (%) - Hispanic or Latino
Place of birth - Native, outside of US (%) - American Indian and Alaska Native
Place of birth - Native, outside of US (%) - Multirace
Place of birth - Native, outside of US (%) - Other Race
Place of birth - Foreign born (%)
Place of birth - Foreign born (%) - White
Place of birth - Foreign born (%) - Black or African American
Place of birth - Foreign born (%) - Asian
Place of birth - Foreign born (%) - Hispanic or Latino
Place of birth - Foreign born (%) - American Indian and Alaska Native
Place of birth - Foreign born (%) - Multirace
Place of birth - Foreign born (%) - Other Race
Residents speaking English at home (%)
Residents speaking English at home - Born in the United States (%)
Residents speaking English at home - Native, born elsewhere (%)
Residents speaking English at home - Foreign born (%)
Residents speaking Spanish at home (%)
Residents speaking Spanish at home - Born in the United States (%)
Residents speaking Spanish at home - Native, born elsewhere (%)
Residents speaking Spanish at home - Foreign born (%)
Residents speaking other language at home (%)
Residents speaking other language at home - Born in the United States (%)
Residents speaking other language at home - Native, born elsewhere (%)
Residents speaking other language at home - Foreign born (%)
Marital status - Never married (%)
Marital status - Now married (%)
Marital status - Separated (%)
Marital status - Widowed (%)
Marital status - Divorced (%)
Ancestries Reported - Arab (%)
Ancestries Reported - Czech (%)
Ancestries Reported - Danish (%)
Ancestries Reported - Dutch (%)
Ancestries Reported - English (%)
Ancestries Reported - French (%)
Ancestries Reported - French Canadian (%)
Ancestries Reported - German (%)
Ancestries Reported - Greek (%)
Ancestries Reported - Hungarian (%)
Ancestries Reported - Irish (%)
Ancestries Reported - Italian (%)
Ancestries Reported - Lithuanian (%)
Ancestries Reported - Norwegian (%)
Ancestries Reported - Polish (%)
Ancestries Reported - Portuguese (%)
Ancestries Reported - Russian (%)
Ancestries Reported - Scotch-Irish (%)
Ancestries Reported - Scottish (%)
Ancestries Reported - Slovak (%)
Ancestries Reported - Subsaharan African (%)
Ancestries Reported - Swedish (%)
Ancestries Reported - Swiss (%)
Ancestries Reported - Ukrainian (%)
Ancestries Reported - United States (%)
Ancestries Reported - Welsh (%)
Ancestries Reported - West Indian (%)
Ancestries Reported - Other (%)
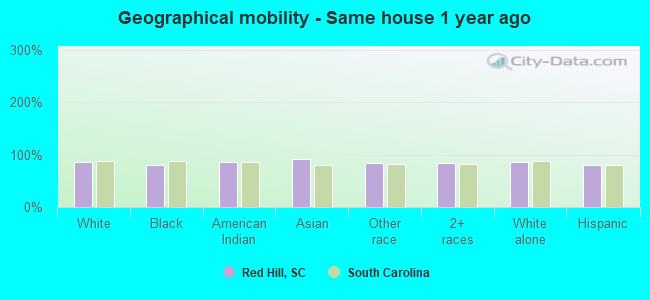
Geographical mobility - Same house 1 year ago (%)
Geographical mobility - Same house 1 year ago (%) - White
Geographical mobility - Same house 1 year ago (%) - Black or African American
Geographical mobility - Same house 1 year ago (%) - Asian
Geographical mobility - Same house 1 year ago (%) - Hispanic or Latino
Geographical mobility - Same house 1 year ago (%) - American Indian and Alaska Native
Geographical mobility - Same house 1 year ago (%) - Multirace
Geographical mobility - Same house 1 year ago (%) - Other Race
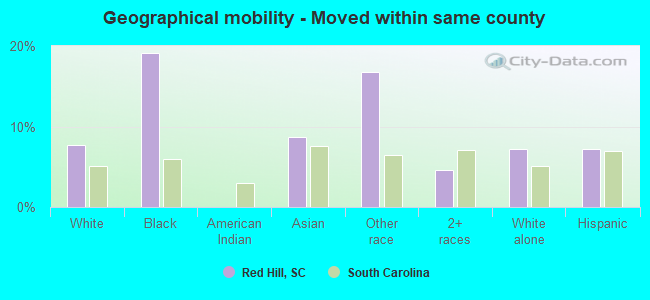
Geographical mobility - Moved within same county (%)
Geographical mobility - Moved within same county (%) - White
Geographical mobility - Moved within same county (%) - Black or African American
Geographical mobility - Moved within same county (%) - Asian
Geographical mobility - Moved within same county (%) - Hispanic or Latino
Geographical mobility - Moved within same county (%) - American Indian and Alaska Native
Geographical mobility - Moved within same county (%) - Multirace
Geographical mobility - Moved within same county (%) - Other Race
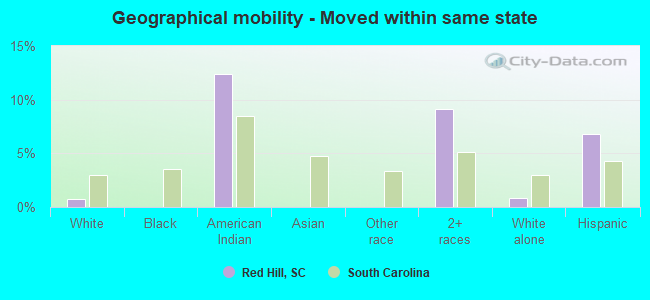
Geographical mobility - Moved from different county within same state (%)
Geographical mobility - Moved from different county within same state (%) - White
Geographical mobility - Moved from different county within same state (%) - Black or African American
Geographical mobility - Moved from different county within same state (%) - Asian
Geographical mobility - Moved from different county within same state (%) - Hispanic or Latino
Geographical mobility - Moved from different county within same state (%) - American Indian and Alaska Native
Geographical mobility - Moved from different county within same state (%) - Multirace
Geographical mobility - Moved from different county within same state (%) - Other Race
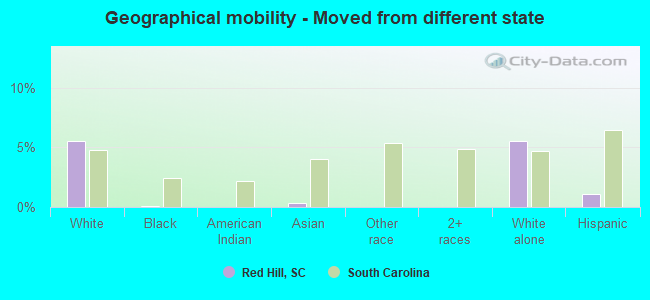
Geographical mobility - Moved from different state (%)
Geographical mobility - Moved from different state (%) - White
Geographical mobility - Moved from different state (%) - Black or African American
Geographical mobility - Moved from different state (%) - Asian
Geographical mobility - Moved from different state (%) - Hispanic or Latino
Geographical mobility - Moved from different state (%) - American Indian and Alaska Native
Geographical mobility - Moved from different state (%) - Multirace
Geographical mobility - Moved from different state (%) - Other Race
Geographical mobility - Moved from abroad (%)
Geographical mobility - Moved from abroad (%) - White
Geographical mobility - Moved from abroad (%) - Black or African American
Geographical mobility - Moved from abroad (%) - Asian
Geographical mobility - Moved from abroad (%) - Hispanic or Latino
Geographical mobility - Moved from abroad (%) - American Indian and Alaska Native
Geographical mobility - Moved from abroad (%) - Multirace
Geographical mobility - Moved from abroad (%) - Other Race
Place of birth for the foreign-born population - Ireland (%)
Place of birth for the foreign-born population - Denmark (%)
Place of birth for the foreign-born population - Norway (%)
Place of birth for the foreign-born population - Sweden (%)
Place of birth for the foreign-born population - United Kingdom (%)
Place of birth for the foreign-born population - England (%)
Place of birth for the foreign-born population - Scotland (%)
Place of birth for the foreign-born population - Other Northern Europe (%)
Place of birth for the foreign-born population - Austria (%)
Place of birth for the foreign-born population - Belgium (%)
Place of birth for the foreign-born population - France (%)
Place of birth for the foreign-born population - Germany (%)
Place of birth for the foreign-born population - Netherlands (%)
Place of birth for the foreign-born population - Switzerland (%)
Place of birth for the foreign-born population - Other Western Europe (%)
Place of birth for the foreign-born population - Greece (%)
Place of birth for the foreign-born population - Italy (%)
Place of birth for the foreign-born population - Portugal (%)
Place of birth for the foreign-born population - Spain (%)
Place of birth for the foreign-born population - Other Southern Europe (%)
Place of birth for the foreign-born population - Albania (%)
Place of birth for the foreign-born population - Belarus (%)
Place of birth for the foreign-born population - Bosnia and Herzegovina (%)
Place of birth for the foreign-born population - Bulgaria (%)
Place of birth for the foreign-born population - Croatia (%)
Place of birth for the foreign-born population - Czechoslovakia (%)
Place of birth for the foreign-born population - Hungary (%)
Place of birth for the foreign-born population - Latvia (%)
Place of birth for the foreign-born population - Lithuania (%)
Place of birth for the foreign-born population - North Macedonia (Macedonia) (%)
Place of birth for the foreign-born population - Moldova (%)
Place of birth for the foreign-born population - Poland (%)
Place of birth for the foreign-born population - Romania (%)
Place of birth for the foreign-born population - Russia (%)
Place of birth for the foreign-born population - Serbia (%)
Place of birth for the foreign-born population - Ukraine (%)
Place of birth for the foreign-born population - Other Eastern Europe (%)
Place of birth for the foreign-born population - China (%)
Place of birth for the foreign-born population - Hong Kong (%)
Place of birth for the foreign-born population - Taiwan (%)
Place of birth for the foreign-born population - Japan (%)
Place of birth for the foreign-born population - Korea (%)
Place of birth for the foreign-born population - Other Eastern Asia (%)
Place of birth for the foreign-born population - Afghanistan (%)
Place of birth for the foreign-born population - Bangladesh (%)
Place of birth for the foreign-born population - India (%)
Place of birth for the foreign-born population - Iran (%)
Place of birth for the foreign-born population - Kazakhstan (%)
Place of birth for the foreign-born population - Nepal (%)
Place of birth for the foreign-born population - Pakistan (%)
Place of birth for the foreign-born population - Sri Lanka (%)
Place of birth for the foreign-born population - Uzbekistan (%)
Place of birth for the foreign-born population - Other South Central Asia (%)
Place of birth for the foreign-born population - Burma (%)
Place of birth for the foreign-born population - Cambodia (%)
Place of birth for the foreign-born population - Indonesia (%)
Place of birth for the foreign-born population - Laos (%)
Place of birth for the foreign-born population - Malaysia (%)
Place of birth for the foreign-born population - Philippines (%)
Place of birth for the foreign-born population - Singapore (%)
Place of birth for the foreign-born population - Thailand (%)
Place of birth for the foreign-born population - Vietnam (%)
Place of birth for the foreign-born population - Other South Eastern Asia (%)
Place of birth for the foreign-born population - Armenia (%)
Place of birth for the foreign-born population - Iraq (%)
Place of birth for the foreign-born population - Israel (%)
Place of birth for the foreign-born population - Jordan (%)
Place of birth for the foreign-born population - Kuwait (%)
Place of birth for the foreign-born population - Lebanon (%)
Place of birth for the foreign-born population - Saudi Arabia (%)
Place of birth for the foreign-born population - Syria (%)
Place of birth for the foreign-born population - Turkey (%)
Place of birth for the foreign-born population - Yemen (%)
Place of birth for the foreign-born population - Other Western Asia (%)
Place of birth for the foreign-born population - Eritrea (%)
Place of birth for the foreign-born population - Ethiopia (%)
Place of birth for the foreign-born population - Kenya (%)
Place of birth for the foreign-born population - Somalia (%)
Place of birth for the foreign-born population - Uganda (%)
Place of birth for the foreign-born population - Zimbabwe (%)
Place of birth for the foreign-born population - Other Eastern Africa (%)
Place of birth for the foreign-born population - Cameroon (%)
Place of birth for the foreign-born population - Congo (%)
Place of birth for the foreign-born population - Democratic Republic of Congo (Zaire) (%)
Place of birth for the foreign-born population - Other Middle Africa (%)
Place of birth for the foreign-born population - Egypt (%)
Place of birth for the foreign-born population - Morocco (%)
Place of birth for the foreign-born population - Sudan (%)
Place of birth for the foreign-born population - Other Northern Africa (%)
Place of birth for the foreign-born population - South Africa (%)
Place of birth for the foreign-born population - Other Southern Africa (%)
Place of birth for the foreign-born population - Cabo Verde (%)
Place of birth for the foreign-born population - Ghana (%)
Place of birth for the foreign-born population - Liberia (%)
Place of birth for the foreign-born population - Nigeria (%)
Place of birth for the foreign-born population - Senegal (%)
Place of birth for the foreign-born population - Sierra Leone (%)
Place of birth for the foreign-born population - Other Western Africa (%)
Place of birth for the foreign-born population - Australia (%)
Place of birth for the foreign-born population - New Zealand (%)
Place of birth for the foreign-born population - Fiji (%)
Place of birth for the foreign-born population - Micronesia (%)
Place of birth for the foreign-born population - Bahamas (%)
Place of birth for the foreign-born population - Barbados (%)
Place of birth for the foreign-born population - Cuba (%)
Place of birth for the foreign-born population - Dominica (%)
Place of birth for the foreign-born population - Dominican Republic (%)
Place of birth for the foreign-born population - Grenada (%)
Place of birth for the foreign-born population - Haiti (%)
Place of birth for the foreign-born population - Jamaica (%)
Place of birth for the foreign-born population - St. Vincent and the Grenadines (%)
Place of birth for the foreign-born population - Trinidad and Tobago (%)
Place of birth for the foreign-born population - West Indies (%)
Place of birth for the foreign-born population - Other Caribbean (%)
Place of birth for the foreign-born population - Belize (%)
Place of birth for the foreign-born population - Costa Rica (%)
Place of birth for the foreign-born population - El Salvador (%)
Place of birth for the foreign-born population - Guatemala (%)
Place of birth for the foreign-born population - Honduras (%)
Place of birth for the foreign-born population - Mexico (%)
Place of birth for the foreign-born population - Nicaragua (%)
Place of birth for the foreign-born population - Panama (%)
Place of birth for the foreign-born population - Other Central America (%)
Place of birth for the foreign-born population - Argentina (%)
Place of birth for the foreign-born population - Bolivia (%)
Place of birth for the foreign-born population - Brazil (%)
Place of birth for the foreign-born population - Chile (%)
Place of birth for the foreign-born population - Colombia (%)
Place of birth for the foreign-born population - Ecuador (%)
Place of birth for the foreign-born population - Guyana (%)
Place of birth for the foreign-born population - Peru (%)
Place of birth for the foreign-born population - Uruguay (%)
Place of birth for the foreign-born population - Venezuela (%)
Place of birth for the foreign-born population - Other South America (%)
Place of birth for the foreign-born population - Canada (%)
Place of birth for the foreign-born population - Other Northern America (%)
Place of birth for the foreign-born population - Other (%)
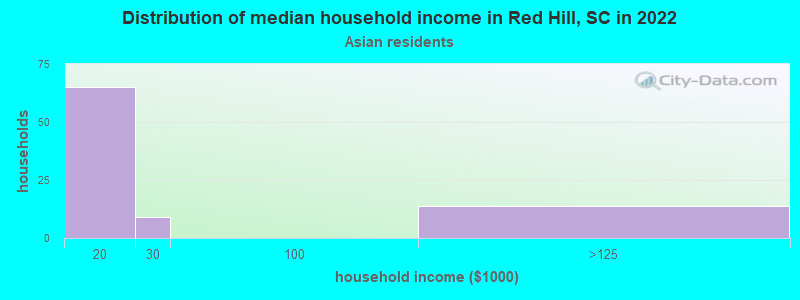
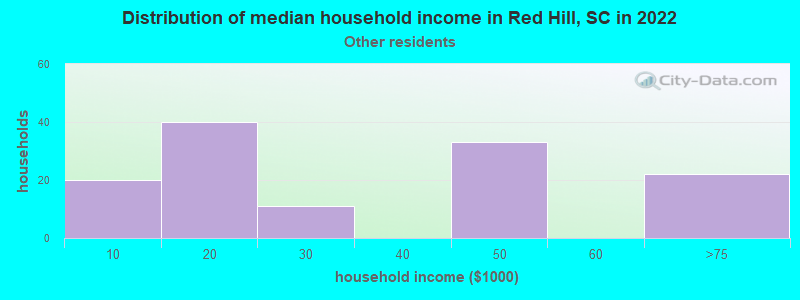
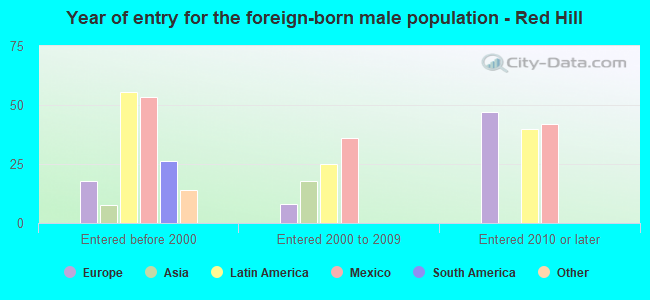
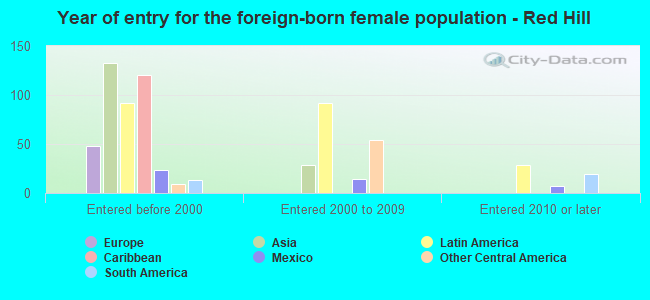
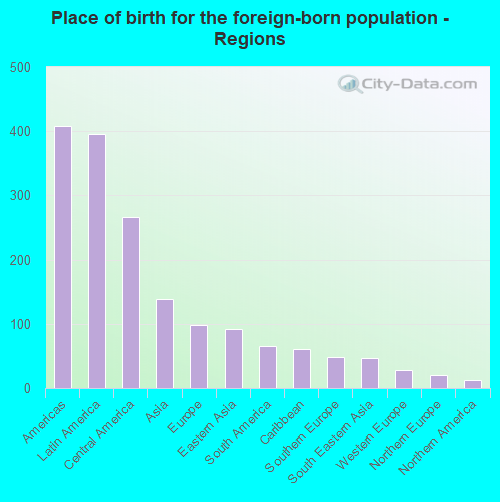
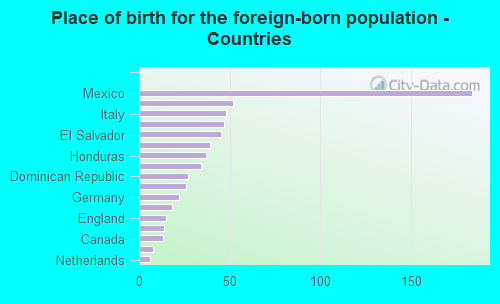
According to 2022 data, the most numerous races in Red Hill, SC are White alone (11,737 residents), Black alone (1,837 residents), and Hispanic (1,779 residents). 89.2% of Red Hill residents speak English at home. 3.9% of Red Hill, SC residents are foreign-born (2.5% born in Latin America, 0.9% born in Asia, 0.6% born in Europe), which is 29.6% less than the foreign-born rate of 5.0% across the entire state of South Carolina.
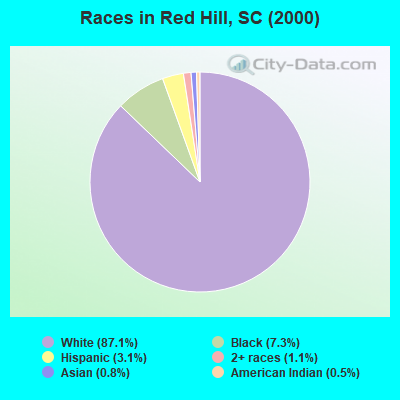
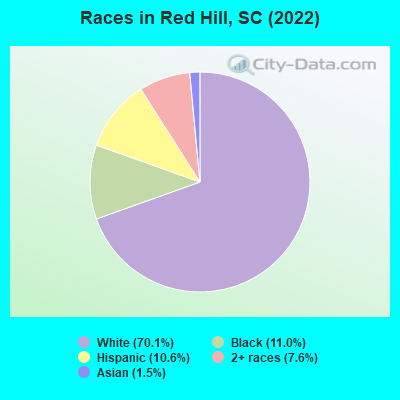
Race distribution in Red Hill
2000 2022
2,652,291 66.1% White alone 1,178,486 29.4% Black alone 95,076 2.4% Hispanic 35,568 0.9% Asian alone 33,290 0.8% Two or more races 12,765 0.3% American Indian alone 3,266 0.08% Other race alone 1,270 0.03% Native Hawaiian and Other
3,301,739 62.5% White alone 1,313,290 24.9% Black alone 343,783 6.5% Hispanic 190,508 3.6% Two or more races 89,888 1.7% Asian alone 29,390 0.6% Other race alone 12,112 0.2% American Indian alone 1,924 0.04% Native Hawaiian and Other
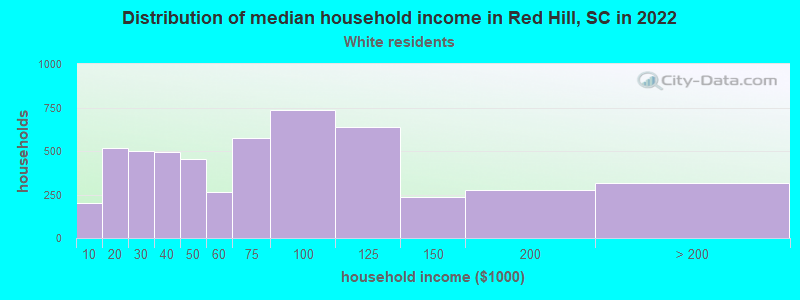
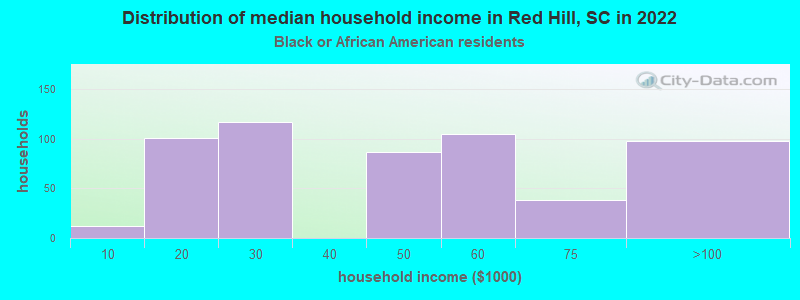
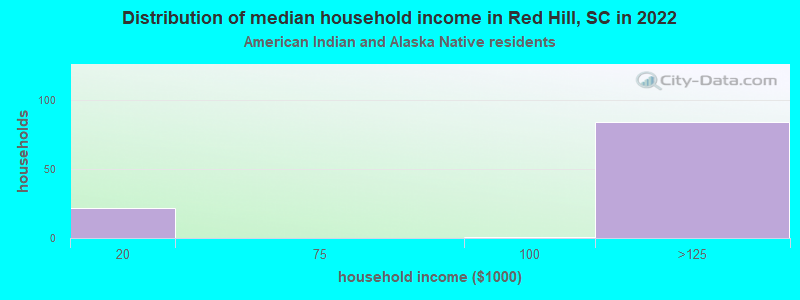
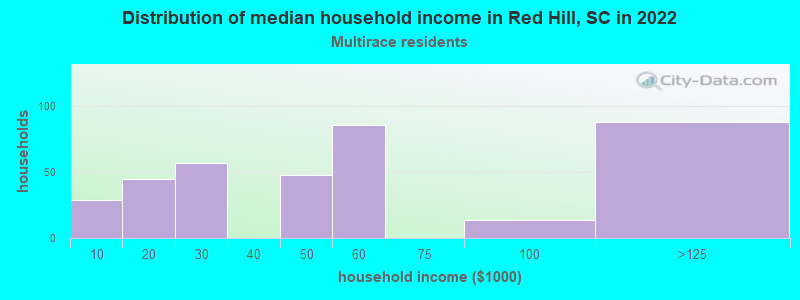
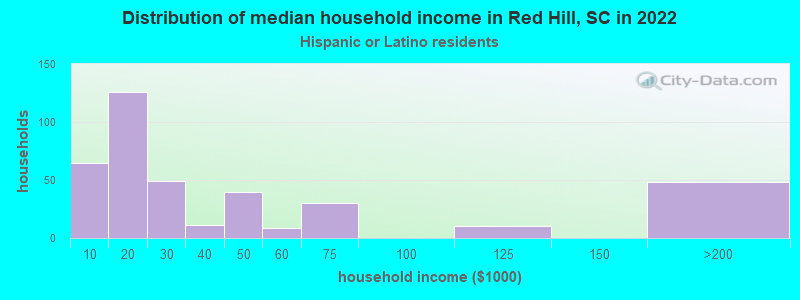
Income and house value in Red Hill Median household income in 2022 $62,486 White non-Hispanic householders$51,684 Black householders$122,564 American Indian and Alaska Native householders$53,452 Two or more races householdersMedian 2022 house value $296,691 White Non-Hispanic householders$189,414 Black or African American householders$142,372 American Indian or Alaska Native householders$466,691 Two or more races householders$799,971 Hispanic or Latino householders
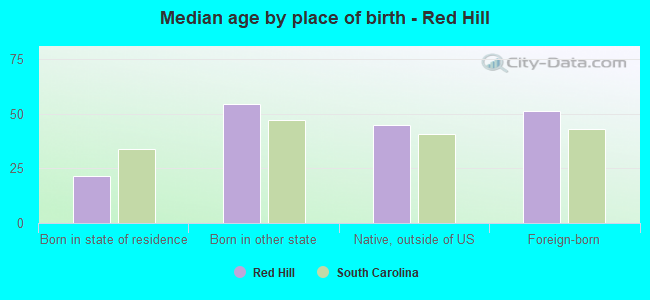
Median age by race in Red Hill
51.1 Median age for White residents50.8 51.4 28.3 Median age for Black or African American residents19.5 30.4 40.7 Median age for American Indian / Alaska Native residents24.8 -1,524,366,470.2 49.4 Median age for Asian residents42.2 51.7 -698,412,697.7 Median age for Native Hawaiian / Pacific Islander residents-666,666,666.0 -666,666,666.0 13.7 Median age for Other race residents13.3 25.6 19.3 Median age for Two or more races residents14.3 19.1 52.7 Median age for White alone residents51.0 55.2 30.7 Median age for Hispanic or Latino residents30.6 24.0
Owner/renter occupied households by race in Red Hill
House owners and renters - White residents 4,227 81.0% Owner occupied991 19.0% Renter occupiedHouse owners and renters - Black or African American residents 170 29.6% Owner occupied405 70.4% Renter occupiedHouse owners and renters - American Indian / Alaska Native residents 68 93.2% Owner occupied5 6.8% Renter occupiedHouse owners and renters - Asian residents 85 92.5% Owner occupied7 7.5% Renter occupiedHouse owners and renters - Other race residents 127 71.2% Owner occupied52 28.8% Renter occupiedHouse owners and renters - Two or more races residents 234 69.1% Owner occupied105 30.9% Renter occupiedHouse owners and renters - White alone residents 4,096 81.8% Owner occupied911 18.2% Renter occupiedHouse owners and renters - Hispanic or Latino residents 307 62.0% Owner occupied188 38.0% Renter occupied
Language usage in Red Hill
English speakers - Total 89.2% of residents of Red Hill speak English at home.
7.0% of residents speak Spanish at home 733 66.6% Speak English very well367 33.4% Speak English less than very well3.0% of residents speak other language at home 391 82.7% Speak English very well82 17.3% Speak English less than very well
English speakers - Born in the United States 93.5% of residents of Red Hill speak English at home.
4.1% of residents speak Spanish at home 327 80.1% Speak English very well81 19.9% Speak English less than very well1.7% of residents speak other language at home 171 100.0% Speak English very well
English speakers - Native, born elsewhere 41.9% of residents of Red Hill speak English at home.
56.5% of residents speak Spanish at home 140 100.0% Speak English very well
English speakers - Foreign-born 8.7% of residents of Red Hill speak English at home.
46.8% of residents speak Spanish at home 142 41.9% Speak English very well197 58.1% Speak English less than very well37.4% of residents speak other language at home 202 74.5% Speak English very well69 25.5% Speak English less than very well
White (Caucasian) - Speak only English Native:
93.6% (11,034)Foreign-born:
17.4% (38)
White (Caucasian) - Speak another language Native:
5.0% (585)Foreign-born:
64.6% (140)
American Indian / Alaska Native - Speak only English Native:
79.3% (64)Foreign-born:
29.7% (9)
American Indian / Alaska Native - Speak another language Native:
21.3% (17)Foreign-born:
65.7% (20)
Asian - Speak only English Native:
54.3% (32)Foreign-born:
16.4% (31)
Asian - Speak another language Native:
46.0% (27)Foreign-born:
66.9% (127)
Other race - Speak another language Native:
68.1% (291)Foreign-born:
98.5% (157)
Two or more races - Speak another language Native:
1.3% (17)Foreign-born:
100.0% (49)
White alone - Speak only English Native:
98.4% (10,977)Foreign-born:
31.0% (40)
White alone - Speak another language Native:
1.5% (169)Foreign-born:
63.8% (83)
Hispanic or Latino - Speak only English Native:
26.1% (347)Foreign-born:
1.6% (5)
Hispanic or Latino - Speak another language Native:
66.1% (877)Foreign-born:
98.6% (310)
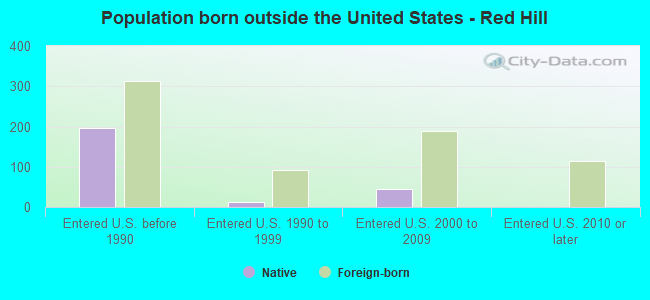
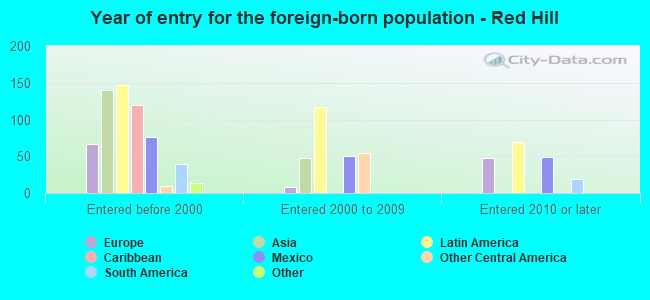
Foreign-born residents in Red Hill 646 residents are foreign born (2.5% Latin America , 0.9% Asia , 0.6% Europe ).
This city:
3.9%South Carolina:
5.3%
Marital status for residents in Red Hill Marital status - White (Caucasian) population 15 years and over
Males 40.4% Never married46.5% Now married1.4% Separated6.0% Widowed5.7% DivorcedFemales 23.8% Never married43.9% Now married10.5% Separated10.3% Widowed11.5% DivorcedWomen who gave birth in the past 12 months Now married:
100.0% (108)Unmarried:
0.0% (0)
Women who did not give birth in the past 12 months Now married:
48.1% (1,209)Unmarried:
51.9% (1,302)
Marital status - Black or African American population 15 years and over
Males 54.9% Never married40.8% Now married0.0% Separated2.4% Widowed1.8% DivorcedFemales 64.9% Never married25.1% Now married5.4% Separated0.0% Widowed4.6% DivorcedWomen who did not give birth in the past 12 months Now married:
21.2% (121)Unmarried:
78.8% (451)
Marital status - American Indian / Alaska Native population 15 years and over
Males 86.7% Never married13.3% Now married0.0% Separated0.0% Widowed0.0% DivorcedFemales 0.0% Never married100.0% Now married0.0% Separated0.0% Widowed0.0% DivorcedMarital status - Asian population 15 years and over
Males 34.6% Never married21.8% Now married0.0% Separated20.5% Widowed23.1% DivorcedFemales 0.0% Never married67.8% Now married32.2% Separated0.0% Widowed0.0% DivorcedWomen who did not give birth in the past 12 months Now married:
100.0% (16)Unmarried:
0.0% (0)
Marital status - Other race population 15 years and over
Males 41.8% Never married58.2% Now married0.0% Separated0.0% Widowed0.0% DivorcedFemales 41.1% Never married44.9% Now married0.0% Separated0.0% Widowed13.9% DivorcedWomen who gave birth in the past 12 months Now married:
49.3% (49)Unmarried:
50.7% (50)
Women who did not give birth in the past 12 months Now married:
22.2% (11)Unmarried:
77.8% (38)
Marital status - Two or more races population 15 years and over
Males 50.4% Never married37.0% Now married0.0% Separated12.6% Widowed0.0% DivorcedFemales 35.9% Never married23.3% Now married20.8% Separated0.0% Widowed20.0% DivorcedWomen who did not give birth in the past 12 months Now married:
37.7% (106)Unmarried:
62.3% (175)
Marital status - White alone, not Hispanic / Latino population 15 years and over
Males 41.2% Never married45.2% Now married1.4% Separated6.2% Widowed5.9% DivorcedFemales 23.7% Never married46.0% Now married6.5% Separated11.5% Widowed12.4% DivorcedWomen who gave birth in the past 12 months Now married:
100.0% (112)Unmarried:
0.0% (0)
Women who did not give birth in the past 12 months Now married:
42.8% (891)Unmarried:
57.2% (1,193)
Marital status - Hispanic or Latino population 15 years and over
Males 34.9% Never married62.0% Now married0.0% Separated0.0% Widowed3.0% DivorcedFemales 35.8% Never married26.9% Now married32.8% Separated0.0% Widowed4.4% DivorcedWomen who gave birth in the past 12 months Now married:
49.3% (40)Unmarried:
50.7% (41)
Women who did not give birth in the past 12 months Now married:
57.8% (409)Unmarried:
42.2% (298)
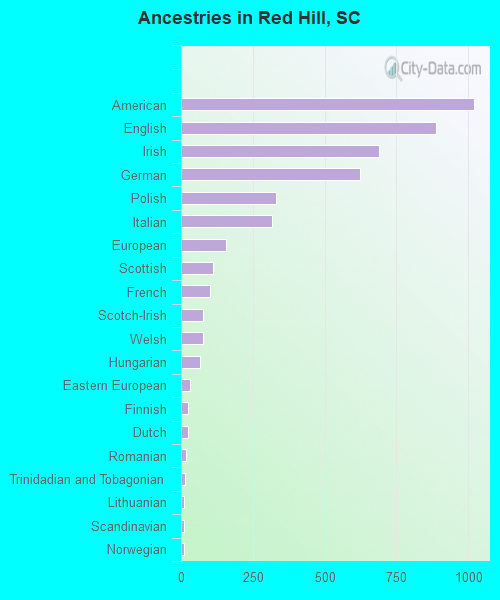
Ancestries in Red Hill
1,022 11.5% American888 10.0% English689 7.7% Irish622 7.0% German331 3.7% Polish317 3.6% Italian157 1.8% European112 1.3% Scottish100 1.1% French78 0.9% Scotch-Irish77 0.9% Welsh66 0.7% Hungarian30 0.3% Eastern European26 0.3% Finnish24 0.3% Dutch18 0.2% Romanian14 0.2% Trinidadian and Tobagonian11 0.1% Lithuanian11 0.1% Scandinavian10 0.1% Norwegian9 0.1% Russian4 0.04% Slovak
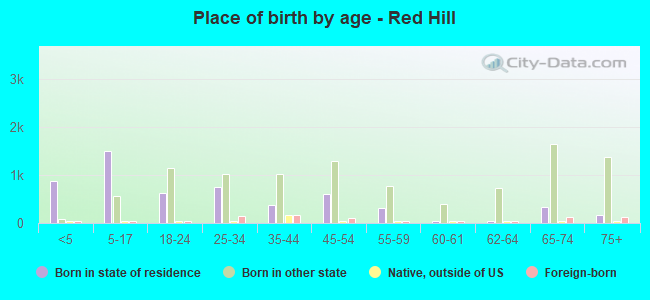
Children Nativity (place of birth) in Red Hill
Children under 6 years - Living with two parents Both parents native 498 100.0% NativeBoth parents foreign-born 8 100.0% NativeOne native, one foreign-born parent 83 100.0% NativeChildren under 6 years - Living with one parent Native parent 276 100.0% NativeForeign-born parent 129 100.0% NativeChildren 6 to 17 years - Living with two parents Both parents native 832 100.0% NativeBoth parents foreign-born 32 100.0% NativeOne native, one foreign-born parent 129 100.0% NativeChildren 6 to 17 years - Living with one parent Native parent 821 100.0% NativeForeign-born parent 102 47.1% Native115 52.9% Foreign-born
Grandparents responsible for own grandchildren in Red Hill
Grandparents (30 to 59 years) White / Caucasian 22 59.6% Responsible for grandchildren15 40.4% Not responsible for grandchildrenBlack or African American 32 100.0% Not responsible for grandchildrenTwo or more races 22 100.0% Responsible for grandchildrenWhite alone, not Hispanic / Latino 22 60.2% Responsible for grandchildren15 39.8% Not responsible for grandchildren
Grandparents (60 years and over) White / Caucasian 38 100.0% Responsible for grandchildrenWhite alone, not Hispanic / Latino 39 100.0% Responsible for grandchildren