Puyallup, WA (Washington) Houses and Residents
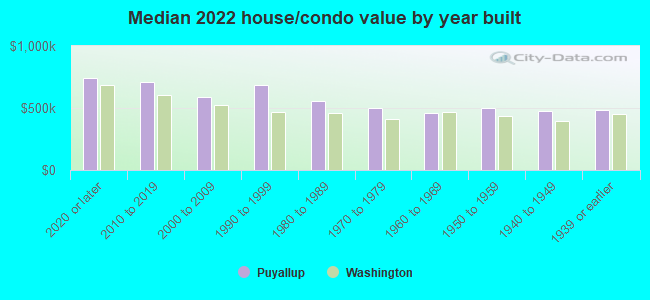
| Puyallup: | $565,631 |
| Washington: | $569,500 |
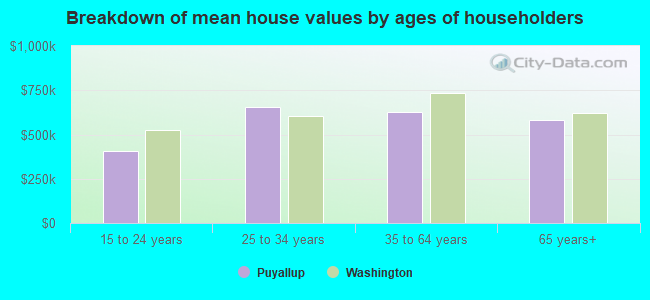
Mean price in 2022:
Detached houses: $550,595
Here: $550,595 State: $734,307 Townhouses or other attached units: $323,117
Here: $323,117 State: $657,697 In 2-unit structures: $153,424
Here: $153,424 State: $534,634 In 3-to-4-unit structures: $233,003
Here: $233,003 State: $510,239 In 5-or-more-unit structures: $268,106
Here: $268,106 State: $503,183 Mobile homes: $312,004
Here: $312,004 State: $218,362 Occupied boats, RVs, vans, etc.: $84,211
Here: $84,211 State: $159,523
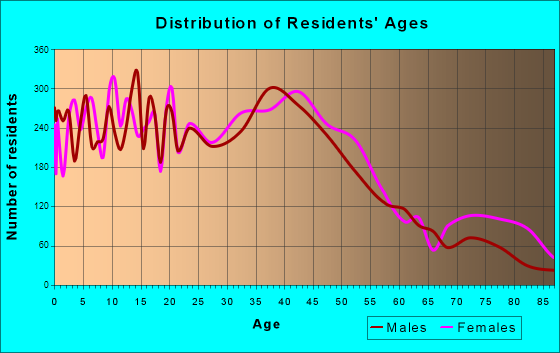
Total population: 39,105 (Urban population: 32,682, Rural population: 0)
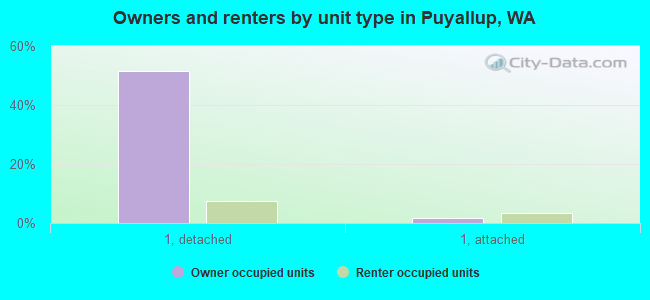
Houses: 17,962 (17,057 occupied: 8,753 owner occupied, 8,308 renter occupied)
| % of renters here: | 49% |
| State: | 36% |
Housing density: 1,480 houses/condos per square mile
Median price asked for vacant for-sale houses and condos in 2022: $461,003.
Median contract rent in 2022: $1,654 (lower quartile is $1,296, upper quartile is $1,915)
Median rent asked for vacant for-rent units in 2022: $2,302
Median gross rent in Puyallup, WA in 2022: $1,753
Housing units in Puyallup with a mortgage: 6,047 (734 second mortgage, 0 home equity loan, 704 both second mortgage and home equity loan)
Houses without a mortgage: 68
Median household income for houses/condos with a mortgage: $134,710
Median household income for apartments without a mortgage: $93,947
Median monthly housing costs: $1,724
Compare current foreclosures in Puyallup, WA:
| Photo | Address | Area | Beds / Baths | Price | Details |
|---|---|---|---|---|---|

|
#1
28th St NW
Puyallup, WA 98371
|
- sq. feet
|
3 baths 5 beds |
show details | |

|
#2
19th Street Ct E
Puyallup, WA 98372
|
960 sq. feet
|
1 baths 3 beds |
show details | |

|
#3
55th Ave E
Puyallup, WA 98373
|
1,682 sq. feet
|
2 baths 3 beds |
show details | |

|
#4
Summerwood Drive East
Puyallup, WA 98373
|
2,628 sq. feet
|
3 baths 5 beds |
show details | |

|
#5
119th Ave E
Puyallup, WA 98374
|
1,512 sq. feet
|
2 baths 3 beds |
show details | |

|
#6
108th Ave E
Puyallup, WA 98374
|
- sq. feet
|
2 baths 5 beds |
show details | |

|
#7
183rd St E
Puyallup, WA 98374
|
2,140 sq. feet
|
2 baths 3 beds |
show details | |

|
#8
14th St SW
Puyallup, WA 98371
|
1,920 sq. feet
|
1 baths 3 beds |
show details | |

|
#9
9th Avenue Ct SE
Puyallup, WA 98372
|
1,262 sq. feet
|
1 baths 3 beds |
show details | |

|
#10
74th Ave E
Puyallup, WA 98373
|
1,836 sq. feet
|
1 baths 3 beds |
show details |
| Photo | Address | Area | Beds / Baths | Price | Details |
|---|---|---|---|---|---|

|
#11
90th Ave E
Puyallup, WA 98375
|
1,818 sq. feet
|
2 baths 4 beds |
show details | |

|
#12
124th Avenue Ct E
Puyallup, WA 98374
|
924 sq. feet
|
3 baths 5 beds |
show details | |

|
#13
34th St E
Puyallup, WA 98371
|
6,331 sq. feet
|
4 baths 5 beds |
show details | |

|
#14
16th Avenue Ct SE
Puyallup, WA 98372
|
2,439 sq. feet
|
3 baths 4 beds |
show details | |

|
#15
10th Ave NW
Puyallup, WA 98371
|
1,889 sq. feet
|
2 baths 3 beds |
show details | |

|
#16
52nd Street Ct E # 93
Puyallup, WA 98371
|
576 sq. feet
|
1 baths 2 beds |
show details | |

|
#17
154th Street Ct E
Puyallup, WA 98375
|
2,302 sq. feet
|
2 baths 3 beds |
show details | |

|
#18
79th Street Ct E # 6
Puyallup, WA 98371
|
1,080 sq. feet
|
2 baths 2 beds |
show details | |

|
#19
36th Pl SE
Puyallup, WA 98374
|
2,888 sq. feet
|
3 baths 4 beds |
show details | |

|
#20
97th Avenue Ct E
Puyallup, WA 98375
|
2,925 sq. feet
|
2 baths 4 beds |
show details |
| Photo | Address | Area | Beds / Baths | Price | Details |
|---|---|---|---|---|---|

|
#21
118th Avenue Ct E
Puyallup, WA 98374
|
1,540 sq. feet
|
2 baths 3 beds |
show details | |

|
#22
17th Ave SW
Puyallup, WA 98371
|
1,480 sq. feet
|
1 baths 2 beds |
show details | |

|
#23
121st St E
Puyallup, WA 98373
|
2,300 sq. feet
|
2 baths 3 beds |
show details | |

|
#24
29th Street Ct E
Puyallup, WA 98371
|
1,850 sq. feet
|
2 baths 3 beds |
show details | |

|
#25
160th St E
Puyallup, WA 98374
|
2,231 sq. feet
|
2 baths 4 beds |
show details | |

|
#26
9th St SW
Puyallup, WA 98371
|
2,150 sq. feet
|
1 baths 4 beds |
show details | |

|
#27
146th St E
Puyallup, WA 98374
|
1,128 sq. feet
|
1 baths 3 beds |
show details | |

|
#28
83rd St E
Puyallup, WA 98371
|
3,095 sq. feet
|
3 baths 4 beds |
show details | |

|
#29
114th Ave E
Puyallup, WA 98374
|
1,984 sq. feet
|
2 baths 3 beds |
show details | |

|
#30
66th Avenue Ct E
Puyallup, WA 98375
|
2,062 sq. feet
|
2 baths 3 beds |
show details |
| Photo | Address | Area | Beds / Baths | Price | Details |
|---|---|---|---|---|---|

|
#31
97th Ln E
Puyallup, WA 98375
|
2,440 sq. feet
|
2 baths 4 beds |
show details | |

|
#32
66th Avenue Ct E
Puyallup, WA 98373
|
1,428 sq. feet
|
2 baths 4 beds |
show details | |

|
#33
2nd St NW
Puyallup, WA 98371
|
864 sq. feet
|
1 baths 2 beds |
show details | |

|
#34
12th St SW
Puyallup, WA 98371
|
768 sq. feet
|
1 baths 2 beds |
show details | |

|
#35
125th St E
Puyallup, WA 98374
|
1,786 sq. feet
|
2 baths 3 beds |
show details | |

|
#36
187th Street Ct E
Puyallup, WA 98375
|
2,304 sq. feet
|
3 baths 4 beds |
show details | |

|
#37
7th St SE
Puyallup, WA 98372
|
1,416 sq. feet
|
1 baths 3 beds |
show details | |

|
#38
28th St E
Puyallup, WA 98372
|
1,756 sq. feet
|
2 baths 3 beds |
show details | |

|
#39
122nd Ave E
Puyallup, WA 98374
|
1,965 sq. feet
|
2 baths 3 beds |
show details | |

|
#40
82nd Avenue Ct E
Puyallup, WA 98375
|
1,404 sq. feet
|
2 baths 3 beds |
show details |
| Photo | Address | Area | Beds / Baths | Price | Details |
|---|---|---|---|---|---|

|
#41
97th Avenue Ct E
Puyallup, WA 98375
|
1,888 sq. feet
|
2 baths 4 beds |
show details | |

|
#42
61st St E
Puyallup, WA 98372
|
936 sq. feet
|
1 baths 3 beds |
show details | |

|
#43
187th Street Ct E
Puyallup, WA 98375
|
1,680 sq. feet
|
2 baths 3 beds |
show details | |

|
#44
134th St E
Puyallup, WA 98374
|
2,040 sq. feet
|
2 baths 3 beds |
show details | |

|
#45
133rd St E
Puyallup, WA 98374
|
2,288 sq. feet
|
2 baths 4 beds |
show details | |

|
#46
152nd St E
Puyallup, WA 98374
|
1,573 sq. feet
|
2 baths 3 beds |
show details | |

|
#47
29th Street Ct SE
Puyallup, WA 98374
|
2,147 sq. feet
|
3 baths 5 beds |
show details | |

|
#48
72nd Ave E
Puyallup, WA 98375
|
2,297 sq. feet
|
2 baths 4 beds |
show details | |

|
#49
123rd St E
Puyallup, WA 98373
|
1,768 sq. feet
|
1 baths 3 beds |
show details | |

|
Check over 1 million property listings on Foreclosure.com!
|
browse all offers | |||

Latest news about housing in Puyallup, WA collected exclusively by city-data.com from local newspapers, TV, and radio stations

 | Puyallup versus Olympia - Investment on RENTAL homes (0 replies) |
| How to find basements/apartments for rent? (5 replies) |
| University Place or Puyallup? (2 replies) |
| Homes - days on market (14 replies) |
| Apartments that allow large dogs (4 replies) |
| Some tribal casinos reopen amid coronavirus pandemic, despite Washington state’s stay-home order (17 replies) |
Median year apartment built: 1991
Household type by relationship:
Households: 42,998- Male householders: 7,937 (1,590 living alone), Female householders: 8,796 (2,812 living alone)
7,675 spouses (7,642 opposite-sex spouses), 1,955 unmarried partners, (1,885 opposite-sex unmarried partners), 11,363 children (10,634 natural, 177 adopted, 551 stepchildren), 530 grandchildren, 478 brothers or sisters, 614 parents, 39 foster children, 502 other relatives, 2,136 non-relatives
- In group quarters: 967
Size of family households: 4,636 2-persons, 2,340 3-persons, 1,974 4-persons, 1,094 5-persons, 184 6-persons, 256 7-or-more-persons.
Size of nonfamily households: 4,482 1-person, 1,822 2-persons, 257 3-persons, 18 4-persons, 14 5-persons.
5,778 married couples with children.
2,700 single-parent households (1,030 men, 1,670 women).
86.2% of residents of Puyallup speak English at home.
3.4% of residents speak Spanish at home (75% speak English very well, 11% speak English well, 13% speak English not well, 1% don't speak English at all).
3.3% of residents speak other Indo-European language at home (68% speak English very well, 16% speak English well, 10% speak English not well, 6% don't speak English at all).
5.3% of residents speak Asian or Pacific Island language at home (66% speak English very well, 19% speak English well, 12% speak English not well, 3% don't speak English at all).
1.7% of residents speak other language at home (85% speak English very well, 9% speak English well, 6% speak English not well).
Foreign born population: 4,157 (9.7%)
(54.4% of them are naturalized citizens)
| Here: | 6.8 |
| State: | 6.5 |
| Here: | 3.9 |
| State: | 3.9 |
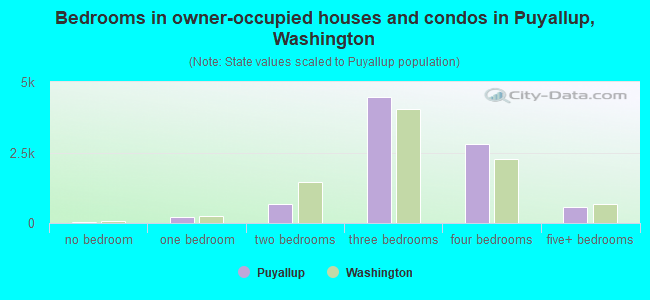
- Bedrooms in owner-occupied houses and condos in Puyallup, Washington
- 23no bedroom
- 2271 bedroom
- 6622 bedrooms
- 4,4833 bedrooms
- 2,8004 bedrooms
- 5605+ bedrooms
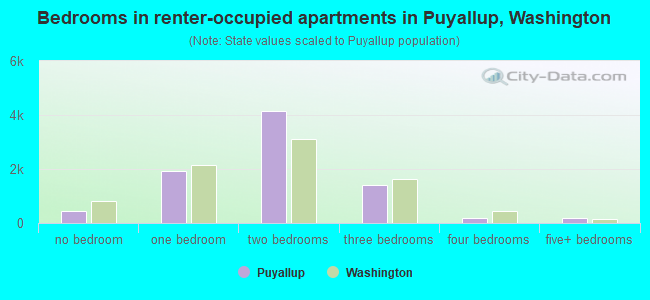
- Bedrooms in renter-occupied apartments in Puyallup, Washington
- 436no bedroom
- 1,9101 bedroom
- 4,1492 bedrooms
- 1,4213 bedrooms
- 1984 bedrooms
- 1945+ bedrooms
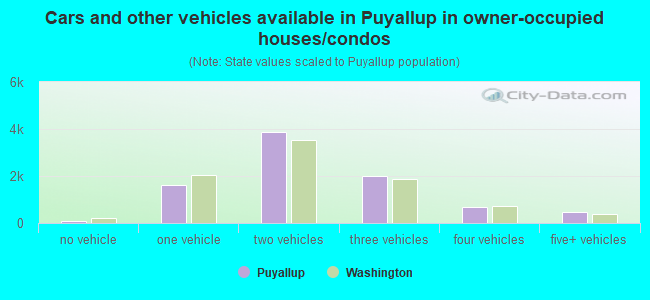
- Cars and other vehicles available in Puyallup in owner-occupied houses/condos
- 97no vehicle
- 1,6061 vehicle
- 3,8722 vehicles
- 2,0083 vehicles
- 6914 vehicles
- 4795+ vehicles
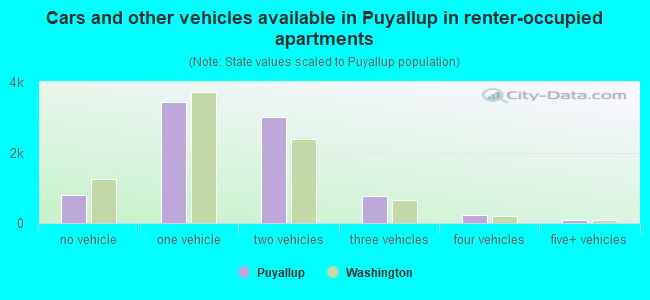
- Cars and other vehicles available in Puyallup in renter-occupied apartments
- 783no vehicle
- 3,4411 vehicle
- 3,0152 vehicles
- 7623 vehicles
- 2214 vehicles
- 865+ vehicles
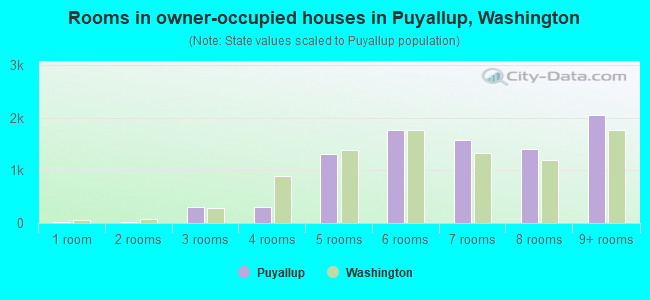
- Rooms in owner-occupied houses in Puyallup, Washington
- 151 room
- 242 rooms
- 3023 rooms
- 3044 rooms
- 1,3145 rooms
- 1,7746 rooms
- 1,5677 rooms
- 1,4028 rooms
- 2,0529+ rooms
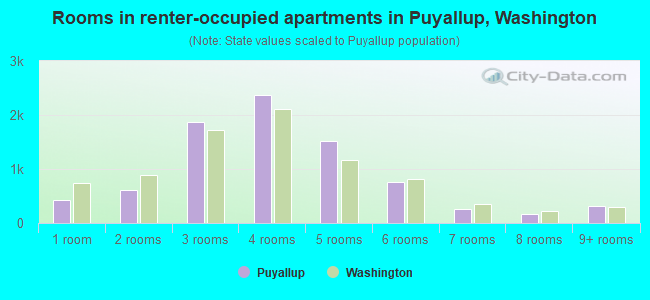
- Rooms in renter-occupied apartments in Puyallup, Washington
- 4231 room
- 6182 rooms
- 1,8663 rooms
- 2,3674 rooms
- 1,5255 rooms
- 7616 rooms
- 2637 rooms
- 1738 rooms
- 3119+ rooms
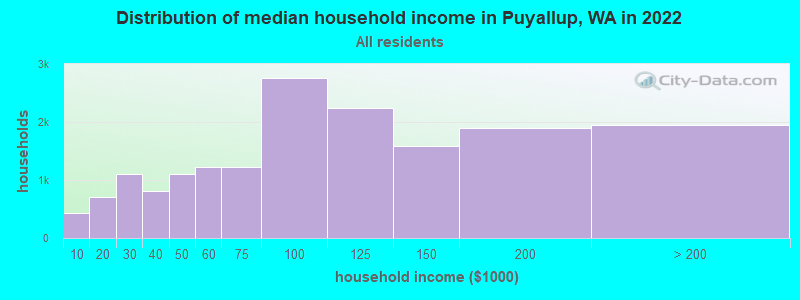
Puyallup, WA household income distribution

- 424Less than $10,000
- 712$10,000 to $19,999
- 1,096$20,000 to $29,999
- 817$30,000 to $39,999
- 1,105$40,000 to $49,999
- 1,219$50,000 to $59,999
- 1,226$60,000 to $74,999
- 2,754$75,000 to $99,999
- 2,233$100,000 to $124,999
- 1,585$125,000 to $149,999
- 1,902$150,000 to $199,999
- 1,954$200,000 or more
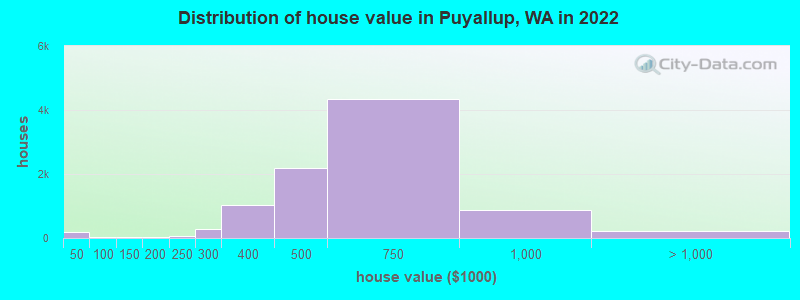
Home value of owner - occupied houses in 2022 in Puyallup, WA
-
- 49Less than $10,000
- 8$10,000 to $14,999
- 25$20,000 to $24,999
- 38$25,000 to $29,999
- 49$30,000 to $34,999
- 25$40,000 to $49,999
- 9$50,000 to $59,999
- 8$100,000 to $124,999
- 17$125,000 to $149,999
- 1$150,000 to $174,999
- 22$175,000 to $199,999
- 77$200,000 to $249,999
- 267$250,000 to $299,999
- 1,040$300,000 to $399,999
- 2,193$400,000 to $499,999
- 4,353$500,000 to $749,999
- 866$750,000 to $999,999
- 173$1,000,000 to $1,499,999
- 42$1,500,000 to $1,999,999
- 9$2,000,000 or more
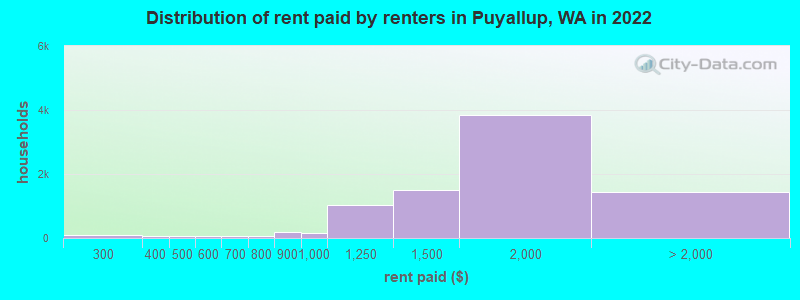
Rent paid by renters in 2022 in Puyallup, WA
-
- 6Less than $100
- 11$150 to $199
- 52$200 to $249
- 36$250 to $299
- 49$300 to $349
- 23$350 to $399
- 57$400 to $449
- 20$500 to $549
- 33$550 to $599
- 46$600 to $649
- 26$650 to $699
- 35$700 to $749
- 26$750 to $799
- 194$800 to $899
- 171$900 to $999
- 1,019$1,000 to $1,249
- 1,504$1,250 to $1,499
- 3,841$1,500 to $1,999
- 666$2,000 to $2,499
- 352$2,500 to $2,999
- 109$3,000 to $3,499
- 94$3,500 or more
- 229No cash rent
Percentage of workers working in this county: 72.3%
Number of people working at home: 2,534 (12.0% of all workers)
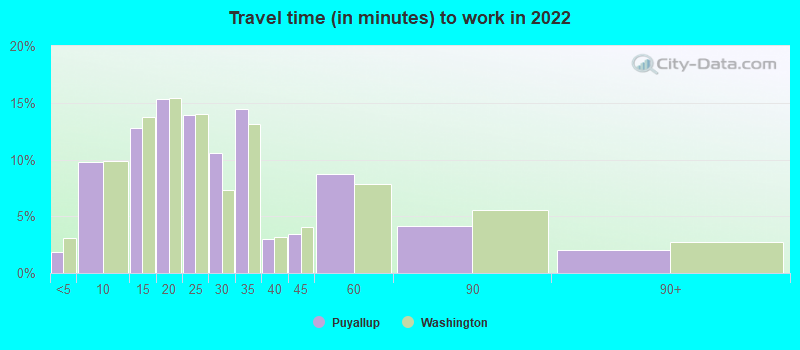
Travel time to work (commute)
- Less than 5 minutes: 361
- 5 to 9 minutes: 2,117
- 10 to 14 minutes: 2,100
- 15 to 19 minutes: 2,541
- 20 to 24 minutes: 1,775
- 25 to 29 minutes: 1,411
- 30 to 34 minutes: 2,859
- 35 to 39 minutes: 687
- 40 to 44 minutes: 678
- 45 to 59 minutes: 1,626
- 60 to 89 minutes: 1,334
- 90 or more minutes: 814
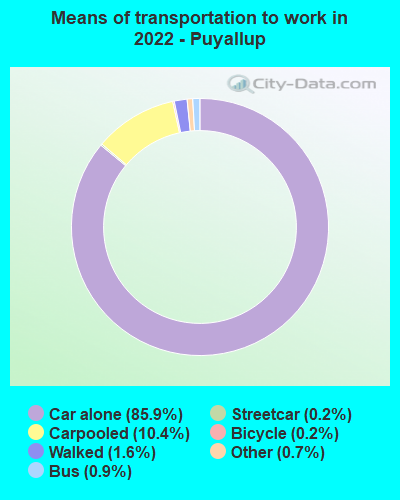
Means of transportation to work:
- Drove a car alone: 24,259 (75.9%)
- Carpooled: 3,059 (9.6%)
- Bus: 239 (0.7%)
- Subway or elevated rail: 49 (0.2%)
- Taxi: 197 (0.6%)
- Bicycle: 98 (0.3%)
- Walked: 565 (1.8%)
- Worked at home: 2,534 (7.9%)
- Unemployment by race in 2022
- Unemployment rate for White non-Hispanic residents
- 4.3%Males
- 5.8%Females
- Unemployment rate for Black residents
- 18.4%Males
- 2.6%Females
- Unemployment rate for Asian residents
- 10.3%Males
- 1.1%Females
- Unemployment rate for two or more race residents
- 2.8%Males
- Unemployment rate for Hispanic or Latino residents
- 10.3%Males
- 7.8%Females
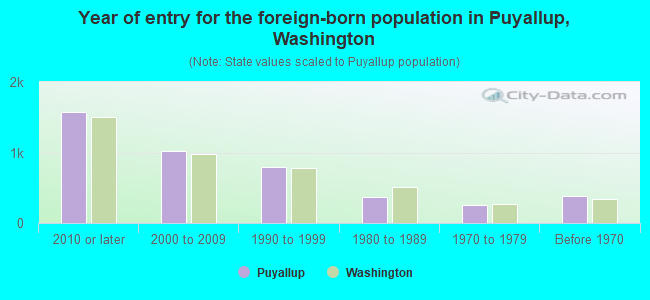
- Year of entry for the foreign-born population in Puyallup, Washington
- 1,5792010 or later
- 1,0212000 to 2009
- 7961990 to 1999
- 3631980 to 1989
- 2501970 to 1979
- 380Before 1970
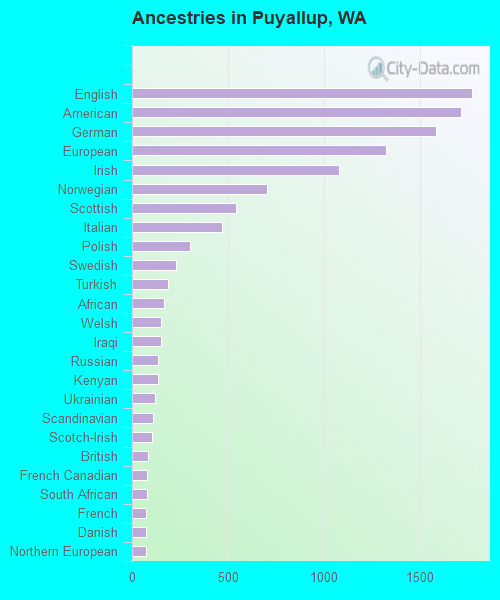
First ancestries reported:
- English: 1,773 (9.6%)
- American: 1,718 (9.3%)
- German: 1,583 (8.6%)
- European: 1,326 (7.2%)
- Irish: 1,078 (5.9%)
- Norwegian: 703 (3.8%)
- Scottish: 543 (2.9%)
- Italian: 467 (2.5%)
- Polish: 304 (1.7%)
- Swedish: 229 (1.2%)
- Turkish: 186 (1.0%)
- African: 167 (0.9%)
- Welsh: 153 (0.8%)
- Iraqi: 150 (0.8%)
- Russian: 136 (0.7%)
- Kenyan: 135 (0.7%)
- Ukrainian: 118 (0.6%)
- Scandinavian: 111 (0.6%)
- Scotch-Irish: 105 (0.6%)
- British: 86 (0.5%)
- French Canadian: 79 (0.4%)
- South African: 76 (0.4%)
- French: 73 (0.4%)
- Danish: 73 (0.4%)
- Northern European: 71 (0.4%)
- Dutch: 68 (0.4%)
- Finnish: 66 (0.4%)
- Croatian: 61 (0.3%)
- Nigerian: 52 (0.3%)
- Czech: 50 (0.3%)
- Austrian: 50 (0.3%)
- Swiss: 47 (0.3%)
- Alsatian: 42 (0.2%)
- Jamaican: 39 (0.2%)
- Ethiopian: 37 (0.2%)
- Hungarian: 35 (0.2%)
- Canadian: 34 (0.2%)
- Albanian: 15 (0.08%)
- Moroccan: 15 (0.08%)
- Australian: 13 (0.07%)
- Arab: 7 (0.04%)
- Slavic: 7 (0.04%)
- Portuguese: 6 (0.03%)
- Greek: 3 (0.02%)
- Eastern European: 2 (0.01%)
Most common places of birth for foreign-born residents (%):
| Puyallup: | 18.0% (728) |
| Washington: | 6.3% (71,661) |
| Puyallup: | 9.2% (371) |
| Washington: | 21.1% (241,655) |
| Puyallup: | 9.0% (362) |
| Washington: | 8.9% (101,353) |
| Puyallup: | 7.7% (311) |
| Washington: | 1.1% (12,735) |
| Puyallup: | 7.5% (304) |
| Washington: | 5.4% (62,003) |
| Puyallup: | 6.0% (241) |
| Washington: | 0.4% (4,963) |
| Puyallup: | 4.8% (192) |
| Washington: | 4.3% (48,886) |
| Puyallup: | 4.0% (161) |
| Washington: | 0.5% (6,259) |
| Puyallup: | 3.1% (126) |
| Washington: | 3.1% (35,872) |
| Puyallup: | 3.1% (126) |
| Washington: | 0.3% (2,970) |
| Puyallup: | 2.9% (119) |
| Washington: | 4.1% (47,238) |
| Puyallup: | 2.5% (99) |
| Washington: | 0.7% (8,049) |
| Puyallup: | 2.4% (97) |
| Washington: | 0.9% (9,937) |
| Puyallup: | 1.9% (75) |
| Washington: | 1.6% (17,761) |
| Puyallup: | 1.6% (66) |
| Washington: | 1.5% (17,453) |
Place of birth for U.S.-born residents:
- This state: 23,714
- Other state: 14,417
- Northeast: 1,488
- Midwest: 2,777
- South: 3,018
- West: 7,089
82.0% of Puyallup residents lived in the same house 1 years ago.
Out of people who lived in different houses, 36.9% lived in this county.
Out of people who lived in different counties, 67.9% lived in Washington.
| Puyallup: | 82.0% |
| State average: | 85.2% |
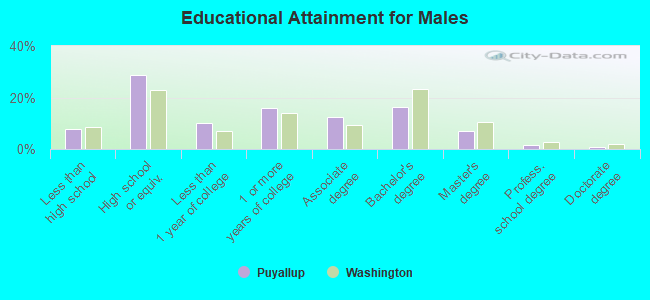
Education attainment for males 25 years and older:
- No schooling: 217
- Nursery to 4th grade: 30
- 5th and 6th grade: 59
- 7th and 8th grade: 136
- 9th grade: 55
- 10th grade: 102
- 11th grade: 261
- 12th grade, no diploma: 247
- High school graduate (or equivalency): 4,152
- Less than 1 year of college: 1,468
- Some college more than 1 year, no degree: 2,294
- Associate degree: 1,783
- Bachelor's degree: 2,380
- Master's degree: 1,001
- Professional school degree: 198
- Doctorate degree: 139
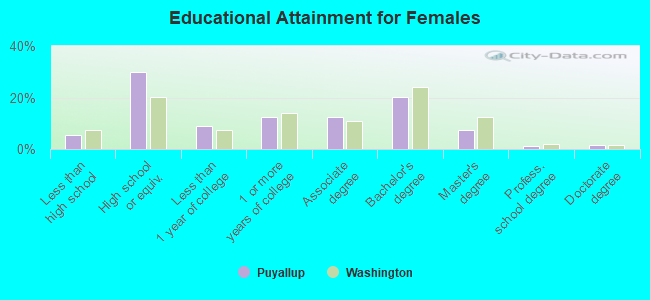
Education attainment for females 25 years and older:
- No schooling: 175
- Nursery to 4th grade: 9
- 5th and 6th grade: 149
- 7th and 8th grade: 58
- 9th grade: 64
- 10th grade: 86
- 11th grade: 170
- 12th grade, no diploma: 168
- High school graduate (or equivalency): 4,731
- Less than 1 year of college: 1,398
- Some college more than 1 year, no degree: 1,966
- Associate degree: 1,967
- Bachelor's degree: 3,202
- Master's degree: 1,153
- Professional school degree: 192
- Doctorate degree: 253
Housing units in structures:
- One, detached: 9,962
- One, attached: 449
- Two: 787
- 3 or 4: 1,296
- 5 to 9: 1,345
- 10 to 19: 1,671
- 20 to 49: 808
- 50 or more: 1,434
- Mobile homes: 178
- Boats, RVs, vans, etc.: 26
Median worth of mobile homes: $33,460
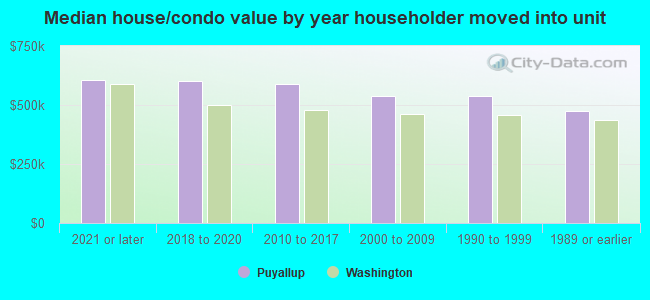
House/condo owner moved in on average 9 years ago
Renter moved in on average 3 years ago
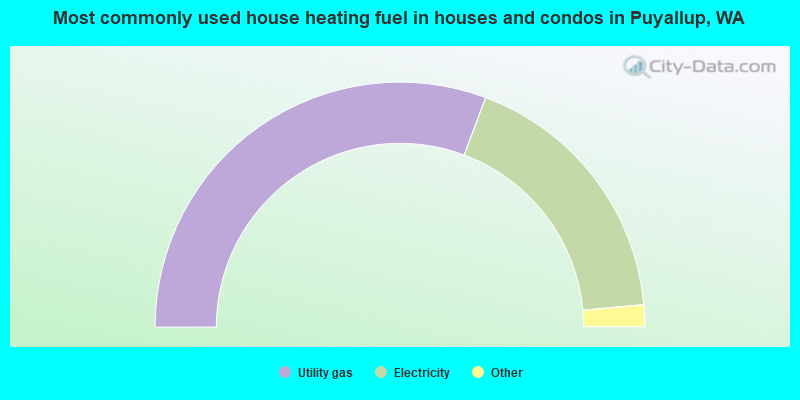
- 61.4%Utility gas
- 35.7%Electricity
- 1.1%Fuel oil, kerosene, etc.
- 0.9%Wood
- 0.8%Bottled, tank, or LP gas
- 0.1%Other fuel
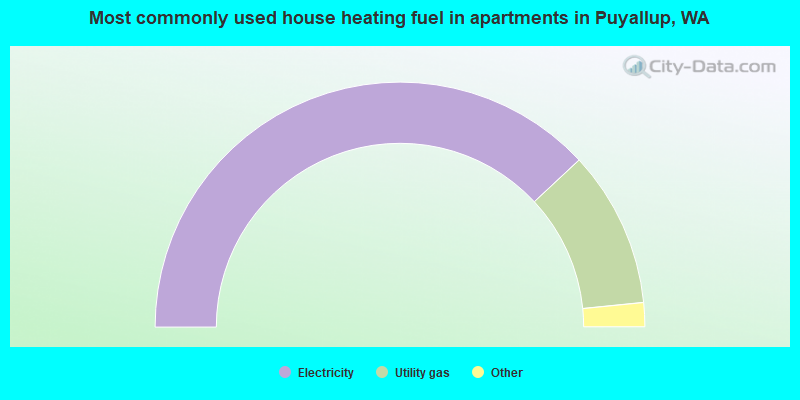
- 76.2%Electricity
- 20.7%Utility gas
- 1.3%Fuel oil, kerosene, etc.
- 0.8%No fuel used
- 0.4%Other fuel
- 0.3%Wood
- 0.3%Bottled, tank, or LP gas
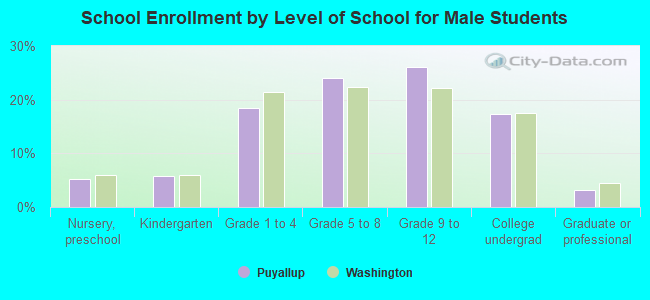
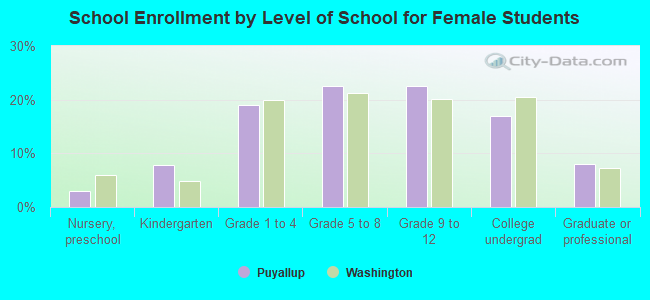
Private vs. public school enrollment:
| Here: | 6.5% |
| Washington: | 12.4% |
| Here: | 6.9% |
| Washington: | 9.2% |
| Here: | 10.1% |
| Washington: | 16.5% |