Races in Puyallup, Washington (WA) Detailed Stats
Data:
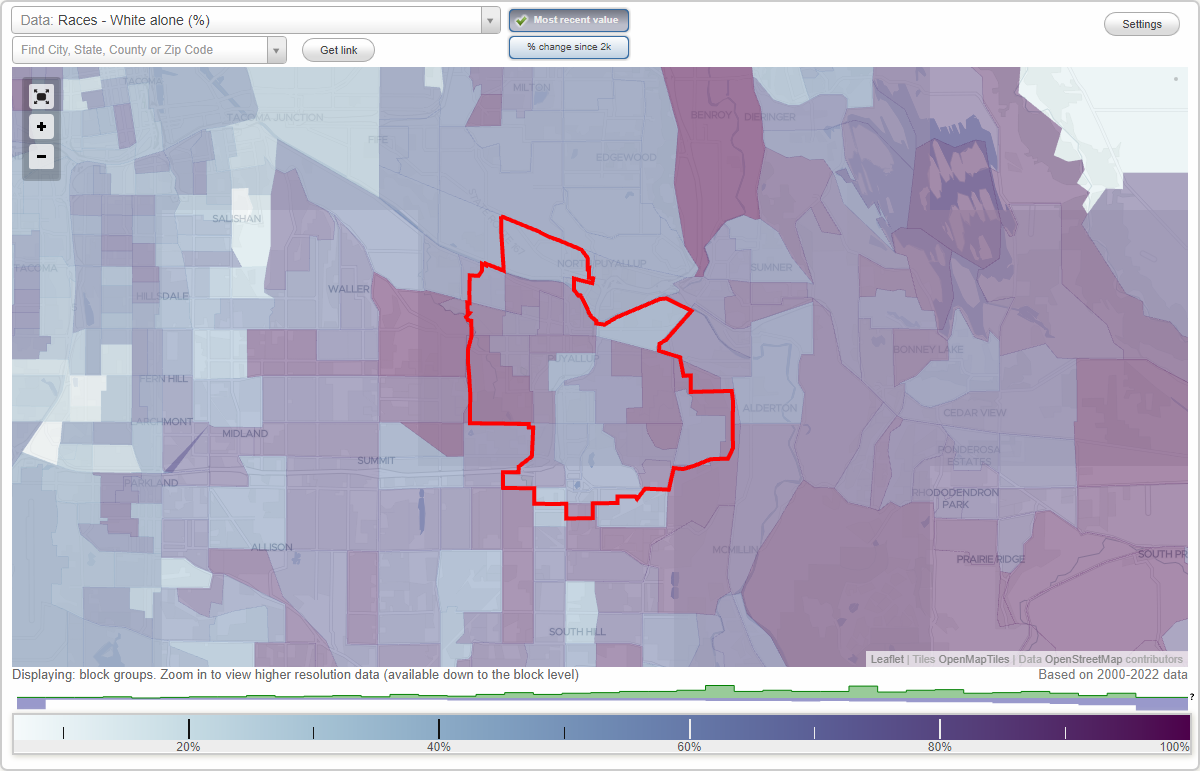
Races - White alone (%)
Races - White alone (% change since 2000)
Races - Black alone (%)
Races - Black alone (% change since 2000)
Races - American Indian alone (%)
Races - American Indian alone (% change since 2000)
Races - Asian alone (%)
Races - Asian alone (% change since 2000)
Races - Hispanic (%)
Races - Hispanic (% change since 2000)
Races - Native Hawaiian and Other Pacific Islander alone (%)
Races - Native Hawaiian and Other Pacific Islander alone (% change since 2000)
Races - Two or more races(%)
Races - Two or more races(% change since 2000)
Races - Other race alone (%)
Races - Other race alone (% change since 2000)
Racial diversity
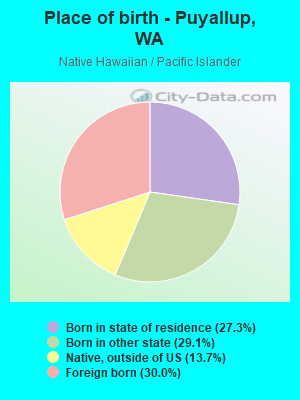
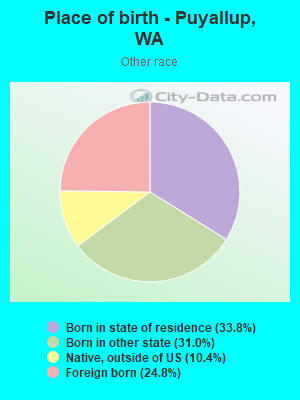
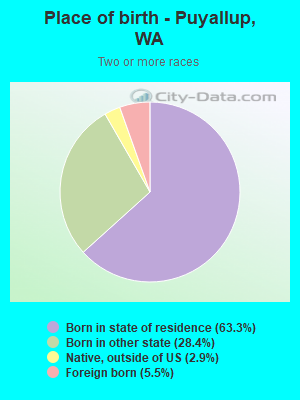
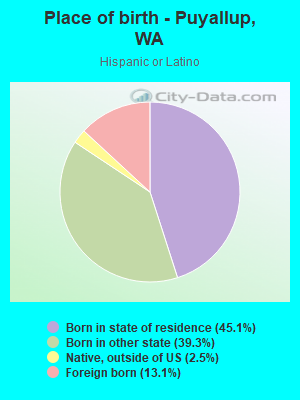
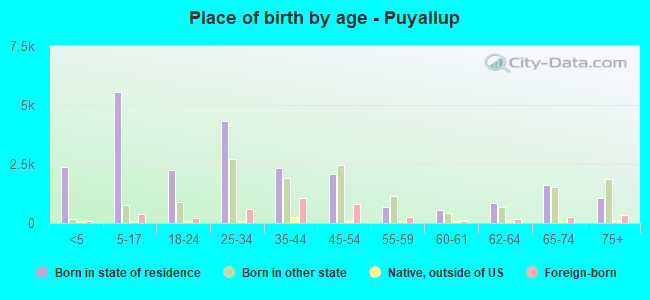
Place of birth - Born in state of residence (%)
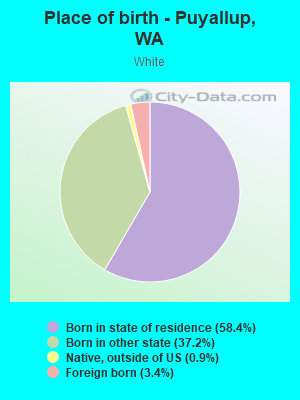
Place of birth - Born in state of residence (%) - White
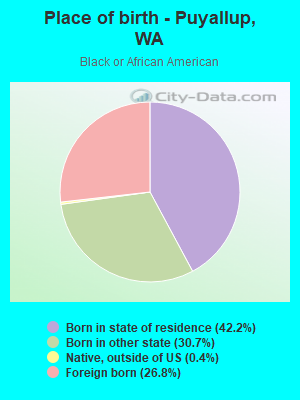
Place of birth - Born in state of residence (%) - Black or African American
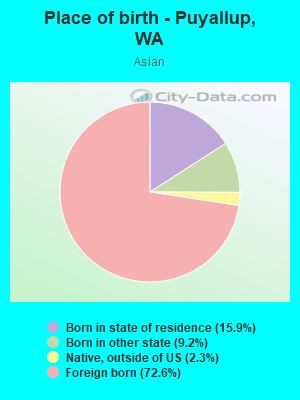
Place of birth - Born in state of residence (%) - Asian
Place of birth - Born in state of residence (%) - Hispanic or Latino
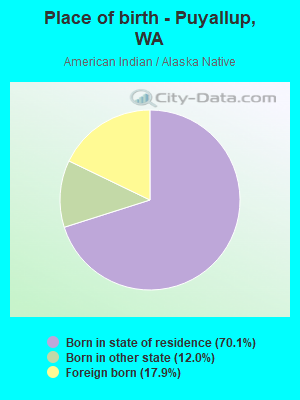
Place of birth - Born in state of residence (%) - American Indian and Alaska Native
Place of birth - Born in state of residence (%) - Multirace
Place of birth - Born in state of residence (%) - Other Race
Place of birth - Born in other state (%)
Place of birth - Born in other state (%) - White
Place of birth - Born in other state (%) - Black or African American
Place of birth - Born in other state (%) - Asian
Place of birth - Born in other state (%) - Hispanic or Latino
Place of birth - Born in other state (%) - American Indian and Alaska Native
Place of birth - Born in other state (%) - Multirace
Place of birth - Born in other state (%) - Other Race
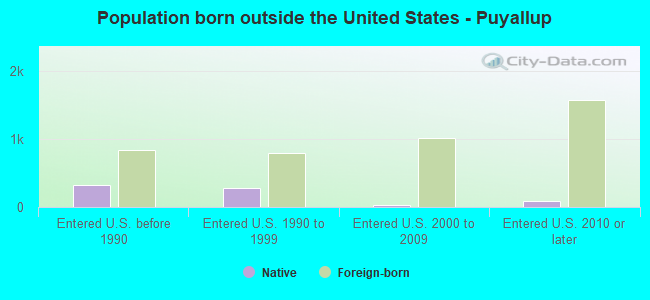
Place of birth - Native, outside of US (%)
Place of birth - Native, outside of US (%) - White
Place of birth - Native, outside of US (%) - Black or African American
Place of birth - Native, outside of US (%) - Asian
Place of birth - Native, outside of US (%) - Hispanic or Latino
Place of birth - Native, outside of US (%) - American Indian and Alaska Native
Place of birth - Native, outside of US (%) - Multirace
Place of birth - Native, outside of US (%) - Other Race
Place of birth - Foreign born (%)
Place of birth - Foreign born (%) - White
Place of birth - Foreign born (%) - Black or African American
Place of birth - Foreign born (%) - Asian
Place of birth - Foreign born (%) - Hispanic or Latino
Place of birth - Foreign born (%) - American Indian and Alaska Native
Place of birth - Foreign born (%) - Multirace
Place of birth - Foreign born (%) - Other Race
Residents speaking English at home (%)
Residents speaking English at home - Born in the United States (%)
Residents speaking English at home - Native, born elsewhere (%)
Residents speaking English at home - Foreign born (%)
Residents speaking Spanish at home (%)
Residents speaking Spanish at home - Born in the United States (%)
Residents speaking Spanish at home - Native, born elsewhere (%)
Residents speaking Spanish at home - Foreign born (%)
Residents speaking other language at home (%)
Residents speaking other language at home - Born in the United States (%)
Residents speaking other language at home - Native, born elsewhere (%)
Residents speaking other language at home - Foreign born (%)
Marital status - Never married (%)
Marital status - Now married (%)
Marital status - Separated (%)
Marital status - Widowed (%)
Marital status - Divorced (%)
Ancestries Reported - Arab (%)
Ancestries Reported - Czech (%)
Ancestries Reported - Danish (%)
Ancestries Reported - Dutch (%)
Ancestries Reported - English (%)
Ancestries Reported - French (%)
Ancestries Reported - French Canadian (%)
Ancestries Reported - German (%)
Ancestries Reported - Greek (%)
Ancestries Reported - Hungarian (%)
Ancestries Reported - Irish (%)
Ancestries Reported - Italian (%)
Ancestries Reported - Lithuanian (%)
Ancestries Reported - Norwegian (%)
Ancestries Reported - Polish (%)
Ancestries Reported - Portuguese (%)
Ancestries Reported - Russian (%)
Ancestries Reported - Scotch-Irish (%)
Ancestries Reported - Scottish (%)
Ancestries Reported - Slovak (%)
Ancestries Reported - Subsaharan African (%)
Ancestries Reported - Swedish (%)
Ancestries Reported - Swiss (%)
Ancestries Reported - Ukrainian (%)
Ancestries Reported - United States (%)
Ancestries Reported - Welsh (%)
Ancestries Reported - West Indian (%)
Ancestries Reported - Other (%)
Geographical mobility - Same house 1 year ago (%)
Geographical mobility - Same house 1 year ago (%) - White
Geographical mobility - Same house 1 year ago (%) - Black or African American
Geographical mobility - Same house 1 year ago (%) - Asian
Geographical mobility - Same house 1 year ago (%) - Hispanic or Latino
Geographical mobility - Same house 1 year ago (%) - American Indian and Alaska Native
Geographical mobility - Same house 1 year ago (%) - Multirace
Geographical mobility - Same house 1 year ago (%) - Other Race
Geographical mobility - Moved within same county (%)
Geographical mobility - Moved within same county (%) - White
Geographical mobility - Moved within same county (%) - Black or African American
Geographical mobility - Moved within same county (%) - Asian
Geographical mobility - Moved within same county (%) - Hispanic or Latino
Geographical mobility - Moved within same county (%) - American Indian and Alaska Native
Geographical mobility - Moved within same county (%) - Multirace
Geographical mobility - Moved within same county (%) - Other Race
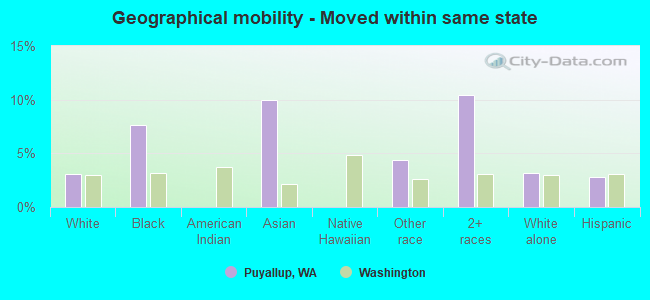
Geographical mobility - Moved from different county within same state (%)
Geographical mobility - Moved from different county within same state (%) - White
Geographical mobility - Moved from different county within same state (%) - Black or African American
Geographical mobility - Moved from different county within same state (%) - Asian
Geographical mobility - Moved from different county within same state (%) - Hispanic or Latino
Geographical mobility - Moved from different county within same state (%) - American Indian and Alaska Native
Geographical mobility - Moved from different county within same state (%) - Multirace
Geographical mobility - Moved from different county within same state (%) - Other Race
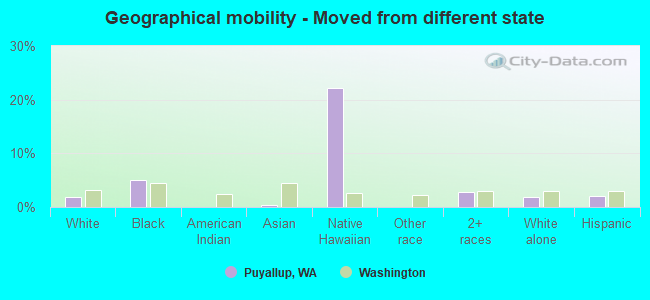
Geographical mobility - Moved from different state (%)
Geographical mobility - Moved from different state (%) - White
Geographical mobility - Moved from different state (%) - Black or African American
Geographical mobility - Moved from different state (%) - Asian
Geographical mobility - Moved from different state (%) - Hispanic or Latino
Geographical mobility - Moved from different state (%) - American Indian and Alaska Native
Geographical mobility - Moved from different state (%) - Multirace
Geographical mobility - Moved from different state (%) - Other Race
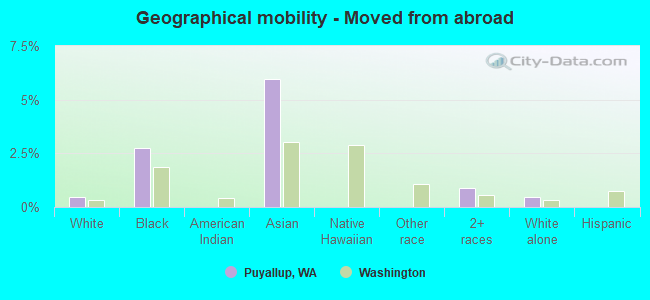
Geographical mobility - Moved from abroad (%)
Geographical mobility - Moved from abroad (%) - White
Geographical mobility - Moved from abroad (%) - Black or African American
Geographical mobility - Moved from abroad (%) - Asian
Geographical mobility - Moved from abroad (%) - Hispanic or Latino
Geographical mobility - Moved from abroad (%) - American Indian and Alaska Native
Geographical mobility - Moved from abroad (%) - Multirace
Geographical mobility - Moved from abroad (%) - Other Race
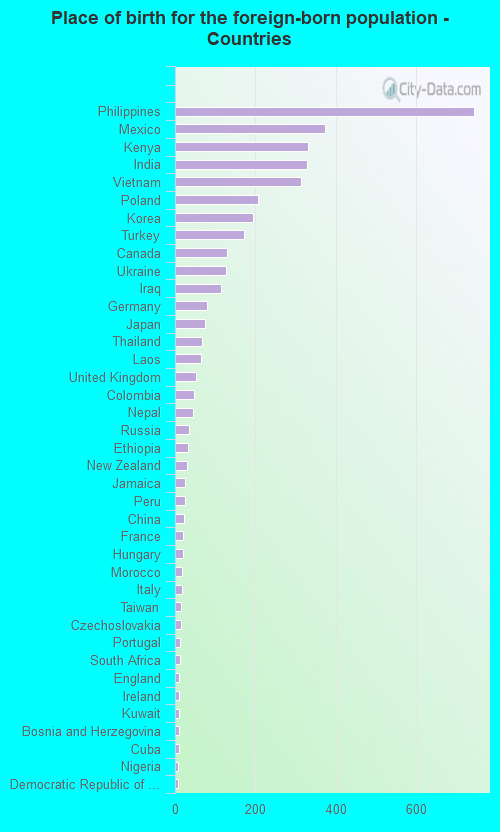
Place of birth for the foreign-born population - Ireland (%)
Place of birth for the foreign-born population - Denmark (%)
Place of birth for the foreign-born population - Norway (%)
Place of birth for the foreign-born population - Sweden (%)
Place of birth for the foreign-born population - United Kingdom (%)
Place of birth for the foreign-born population - England (%)
Place of birth for the foreign-born population - Scotland (%)
Place of birth for the foreign-born population - Other Northern Europe (%)
Place of birth for the foreign-born population - Austria (%)
Place of birth for the foreign-born population - Belgium (%)
Place of birth for the foreign-born population - France (%)
Place of birth for the foreign-born population - Germany (%)
Place of birth for the foreign-born population - Netherlands (%)
Place of birth for the foreign-born population - Switzerland (%)
Place of birth for the foreign-born population - Other Western Europe (%)
Place of birth for the foreign-born population - Greece (%)
Place of birth for the foreign-born population - Italy (%)
Place of birth for the foreign-born population - Portugal (%)
Place of birth for the foreign-born population - Spain (%)
Place of birth for the foreign-born population - Other Southern Europe (%)
Place of birth for the foreign-born population - Albania (%)
Place of birth for the foreign-born population - Belarus (%)
Place of birth for the foreign-born population - Bosnia and Herzegovina (%)
Place of birth for the foreign-born population - Bulgaria (%)
Place of birth for the foreign-born population - Croatia (%)
Place of birth for the foreign-born population - Czechoslovakia (%)
Place of birth for the foreign-born population - Hungary (%)
Place of birth for the foreign-born population - Latvia (%)
Place of birth for the foreign-born population - Lithuania (%)
Place of birth for the foreign-born population - North Macedonia (Macedonia) (%)
Place of birth for the foreign-born population - Moldova (%)
Place of birth for the foreign-born population - Poland (%)
Place of birth for the foreign-born population - Romania (%)
Place of birth for the foreign-born population - Russia (%)
Place of birth for the foreign-born population - Serbia (%)
Place of birth for the foreign-born population - Ukraine (%)
Place of birth for the foreign-born population - Other Eastern Europe (%)
Place of birth for the foreign-born population - China (%)
Place of birth for the foreign-born population - Hong Kong (%)
Place of birth for the foreign-born population - Taiwan (%)
Place of birth for the foreign-born population - Japan (%)
Place of birth for the foreign-born population - Korea (%)
Place of birth for the foreign-born population - Other Eastern Asia (%)
Place of birth for the foreign-born population - Afghanistan (%)
Place of birth for the foreign-born population - Bangladesh (%)
Place of birth for the foreign-born population - India (%)
Place of birth for the foreign-born population - Iran (%)
Place of birth for the foreign-born population - Kazakhstan (%)
Place of birth for the foreign-born population - Nepal (%)
Place of birth for the foreign-born population - Pakistan (%)
Place of birth for the foreign-born population - Sri Lanka (%)
Place of birth for the foreign-born population - Uzbekistan (%)
Place of birth for the foreign-born population - Other South Central Asia (%)
Place of birth for the foreign-born population - Burma (%)
Place of birth for the foreign-born population - Cambodia (%)
Place of birth for the foreign-born population - Indonesia (%)
Place of birth for the foreign-born population - Laos (%)
Place of birth for the foreign-born population - Malaysia (%)
Place of birth for the foreign-born population - Philippines (%)
Place of birth for the foreign-born population - Singapore (%)
Place of birth for the foreign-born population - Thailand (%)
Place of birth for the foreign-born population - Vietnam (%)
Place of birth for the foreign-born population - Other South Eastern Asia (%)
Place of birth for the foreign-born population - Armenia (%)
Place of birth for the foreign-born population - Iraq (%)
Place of birth for the foreign-born population - Israel (%)
Place of birth for the foreign-born population - Jordan (%)
Place of birth for the foreign-born population - Kuwait (%)
Place of birth for the foreign-born population - Lebanon (%)
Place of birth for the foreign-born population - Saudi Arabia (%)
Place of birth for the foreign-born population - Syria (%)
Place of birth for the foreign-born population - Turkey (%)
Place of birth for the foreign-born population - Yemen (%)
Place of birth for the foreign-born population - Other Western Asia (%)
Place of birth for the foreign-born population - Eritrea (%)
Place of birth for the foreign-born population - Ethiopia (%)
Place of birth for the foreign-born population - Kenya (%)
Place of birth for the foreign-born population - Somalia (%)
Place of birth for the foreign-born population - Uganda (%)
Place of birth for the foreign-born population - Zimbabwe (%)
Place of birth for the foreign-born population - Other Eastern Africa (%)
Place of birth for the foreign-born population - Cameroon (%)
Place of birth for the foreign-born population - Congo (%)
Place of birth for the foreign-born population - Democratic Republic of Congo (Zaire) (%)
Place of birth for the foreign-born population - Other Middle Africa (%)
Place of birth for the foreign-born population - Egypt (%)
Place of birth for the foreign-born population - Morocco (%)
Place of birth for the foreign-born population - Sudan (%)
Place of birth for the foreign-born population - Other Northern Africa (%)
Place of birth for the foreign-born population - South Africa (%)
Place of birth for the foreign-born population - Other Southern Africa (%)
Place of birth for the foreign-born population - Cabo Verde (%)
Place of birth for the foreign-born population - Ghana (%)
Place of birth for the foreign-born population - Liberia (%)
Place of birth for the foreign-born population - Nigeria (%)
Place of birth for the foreign-born population - Senegal (%)
Place of birth for the foreign-born population - Sierra Leone (%)
Place of birth for the foreign-born population - Other Western Africa (%)
Place of birth for the foreign-born population - Australia (%)
Place of birth for the foreign-born population - New Zealand (%)
Place of birth for the foreign-born population - Fiji (%)
Place of birth for the foreign-born population - Micronesia (%)
Place of birth for the foreign-born population - Bahamas (%)
Place of birth for the foreign-born population - Barbados (%)
Place of birth for the foreign-born population - Cuba (%)
Place of birth for the foreign-born population - Dominica (%)
Place of birth for the foreign-born population - Dominican Republic (%)
Place of birth for the foreign-born population - Grenada (%)
Place of birth for the foreign-born population - Haiti (%)
Place of birth for the foreign-born population - Jamaica (%)
Place of birth for the foreign-born population - St. Vincent and the Grenadines (%)
Place of birth for the foreign-born population - Trinidad and Tobago (%)
Place of birth for the foreign-born population - West Indies (%)
Place of birth for the foreign-born population - Other Caribbean (%)
Place of birth for the foreign-born population - Belize (%)
Place of birth for the foreign-born population - Costa Rica (%)
Place of birth for the foreign-born population - El Salvador (%)
Place of birth for the foreign-born population - Guatemala (%)
Place of birth for the foreign-born population - Honduras (%)
Place of birth for the foreign-born population - Mexico (%)
Place of birth for the foreign-born population - Nicaragua (%)
Place of birth for the foreign-born population - Panama (%)
Place of birth for the foreign-born population - Other Central America (%)
Place of birth for the foreign-born population - Argentina (%)
Place of birth for the foreign-born population - Bolivia (%)
Place of birth for the foreign-born population - Brazil (%)
Place of birth for the foreign-born population - Chile (%)
Place of birth for the foreign-born population - Colombia (%)
Place of birth for the foreign-born population - Ecuador (%)
Place of birth for the foreign-born population - Guyana (%)
Place of birth for the foreign-born population - Peru (%)
Place of birth for the foreign-born population - Uruguay (%)
Place of birth for the foreign-born population - Venezuela (%)
Place of birth for the foreign-born population - Other South America (%)
Place of birth for the foreign-born population - Canada (%)
Place of birth for the foreign-born population - Other Northern America (%)
Place of birth for the foreign-born population - Other (%)
Latest news about races in Puyallup, WA collected exclusively by city-data.com from local newspapers, TV, and radio stations
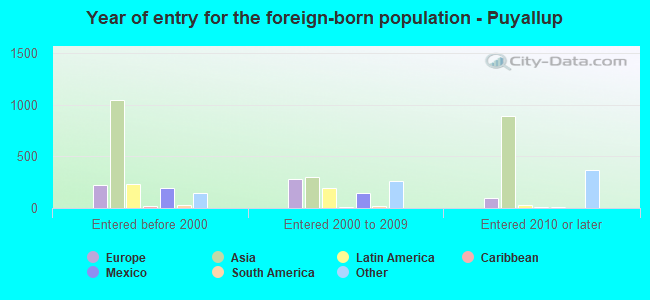
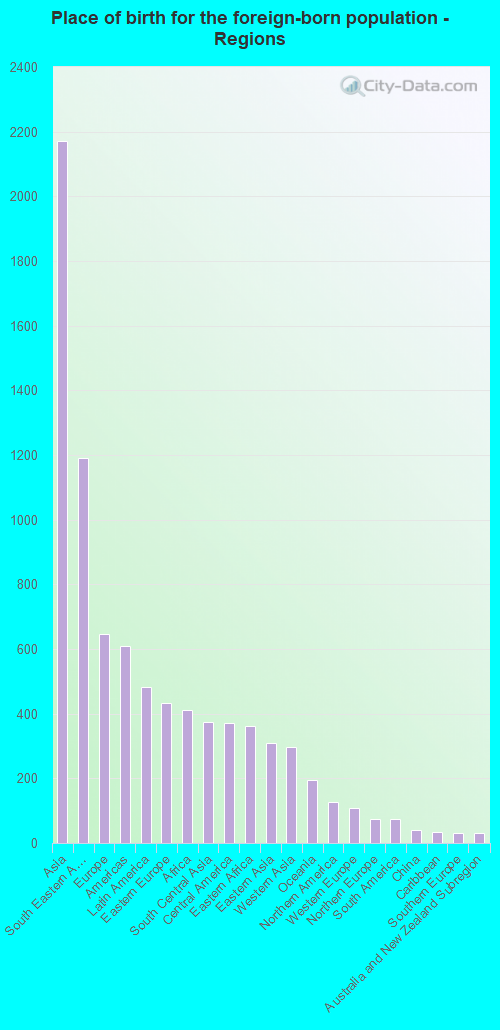
According to 2022 data, the most numerous races in Puyallup, WA are White alone (30,928 residents), Hispanic (3,561 residents), and Asian alone (2,567 residents). 86.2% of Puyallup residents speak English at home. 9.4% of Puyallup, WA residents are foreign-born (4.9% born in Asia, 1.5% born in Europe, 1.1% born in Latin America), which is 59.9% less than the foreign-born rate of 15.0% across the entire state of Washington.
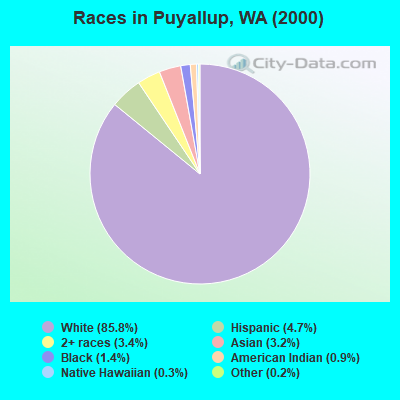
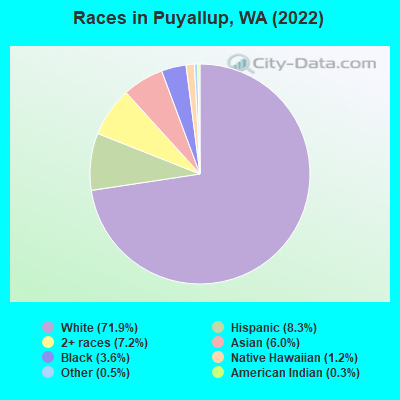
Race distribution in Puyallup
2000 2022
4,652,490 78.9% White alone 441,509 7.5% Hispanic 319,401 5.4% Asian alone 184,631 3.1% Black alone 175,926 3.0% Two or more races 85,396 1.4% American Indian alone 22,779 0.4% Native Hawaiian and Other 11,989 0.2% Other race alone
4,941,456 63.5% White alone 1,093,313 14.0% Hispanic 755,832 9.7% Asian alone 523,448 6.7% Two or more races 299,537 3.8% Black alone 69,024 0.9% American Indian alone 52,231 0.7% Native Hawaiian and Other 50,945 0.7% Other race alone
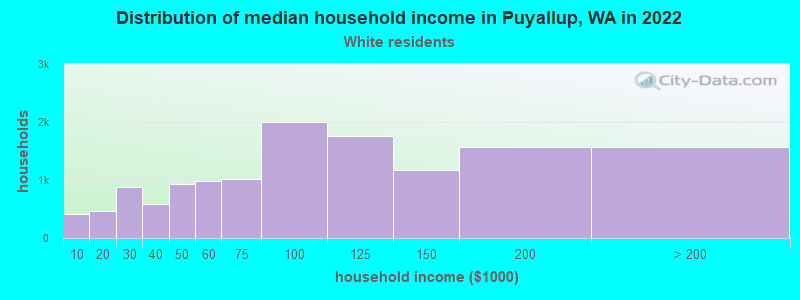
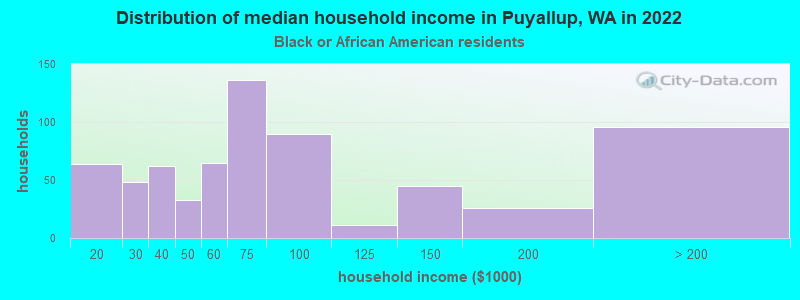
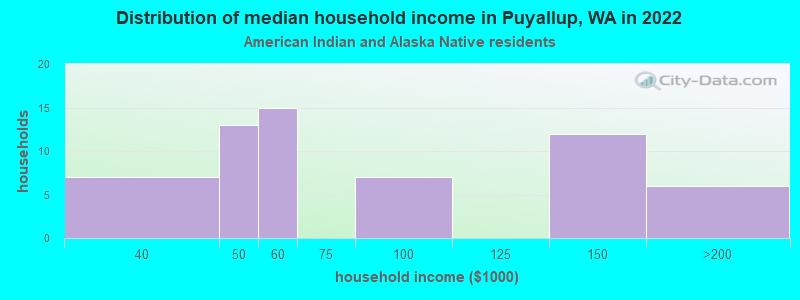
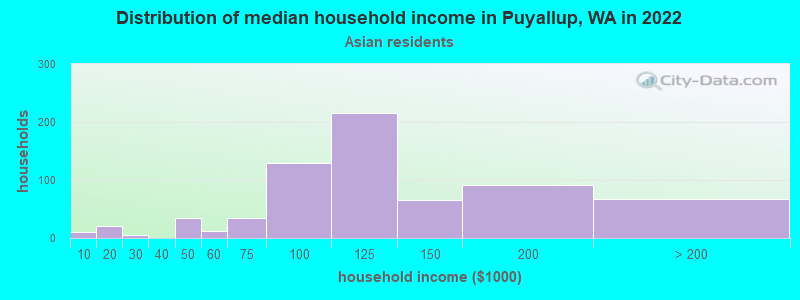
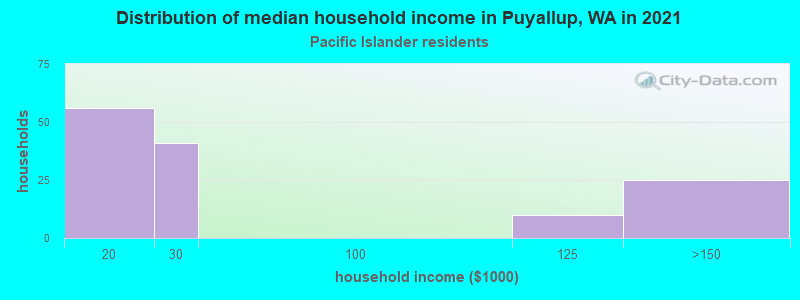
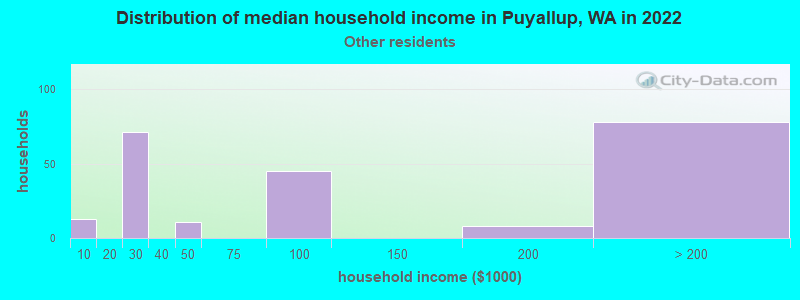
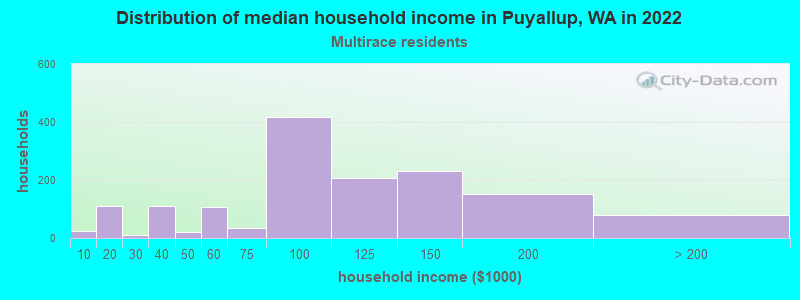
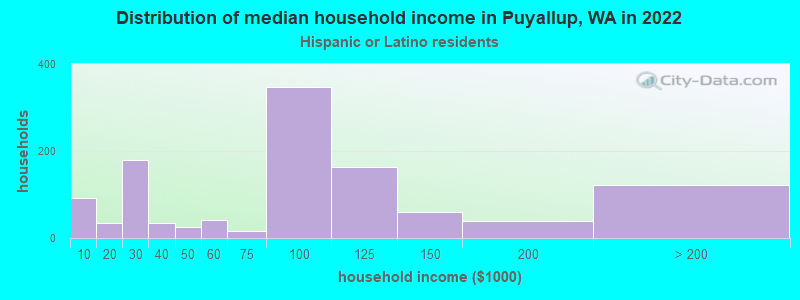
Income and house value in Puyallup Median household income in 2022 $92,323 White non-Hispanic householders$67,637 Black householders$74,392 American Indian and Alaska Native householders$113,081 Asian householders$75,388 Some other race householders$104,569 Two or more races householders$97,279 Hispanic or Latino race householdersMedian 2022 house value $571,484 White Non-Hispanic householders$539,654 Black or African American householders$594,534 American Indian or Alaska Native householders $487,701 Asian householders$594,534 Native Hawaiian and other Pacific Islander householders$511,116 Some other race householders$585,021 Two or more races householders$531,605 Hispanic or Latino householders
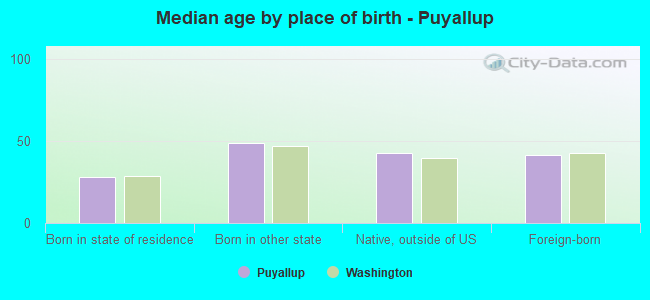
Median age by race in Puyallup
39.9 Median age for White residents39.3 40.9 35.9 Median age for Black or African American residents40.3 33.6 39.8 Median age for American Indian / Alaska Native residents41.5 39.3 42.2 Median age for Asian residents43.1 41.7 24.4 Median age for Native Hawaiian / Pacific Islander residents21.4 24.7 42.6 Median age for Other race residents39.4 53.2 26.7 Median age for Two or more races residents25.6 28.1 40.3 Median age for White alone residents39.5 41.4 27.9 Median age for Hispanic or Latino residents28.5 26.7
Owner/renter occupied households by race in Puyallup
House owners and renters - White residents 7,165 53.1% Owner occupied6,322 46.9% Renter occupiedHouse owners and renters - Black or African American residents 207 33.1% Owner occupied418 66.9% Renter occupiedHouse owners and renters - American Indian / Alaska Native residents 24 47.6% Owner occupied26 52.4% Renter occupiedHouse owners and renters - Asian residents 488 65.2% Owner occupied260 34.8% Renter occupiedHouse owners and renters - Native Hawaiian / Pacific Islander residents 235 100.0% Renter occupiedHouse owners and renters - Other race residents 153 60.9% Owner occupied98 39.1% Renter occupiedHouse owners and renters - Two or more races residents 507 34.2% Owner occupied974 65.8% Renter occupiedHouse owners and renters - White alone residents 7,005 53.4% Owner occupied6,120 46.6% Renter occupiedHouse owners and renters - Hispanic or Latino residents 509 42.5% Owner occupied690 57.5% Renter occupied
Language usage in Puyallup
English speakers - Total 86.2% of residents of Puyallup speak English at home.
3.3% of residents speak Spanish at home 980 72.5% Speak English very well371 27.5% Speak English less than very well10.5% of residents speak other language at home 2,815 66.1% Speak English very well1,442 33.9% Speak English less than very well
English speakers - Born in the United States 94.9% of residents of Puyallup speak English at home.
3.8% of residents speak Spanish at home 517 96.5% Speak English very well19 3.5% Speak English less than very well1.3% of residents speak other language at home 156 83.9% Speak English very well30 16.1% Speak English less than very well
English speakers - Native, born elsewhere 70.9% of residents of Puyallup speak English at home.
7.3% of residents speak Spanish at home 51 100.0% Speak English less than very well17.6% of residents speak other language at home 123 100.0% Speak English very well
English speakers - Foreign-born 15.7% of residents of Puyallup speak English at home.
9.5% of residents speak Spanish at home 197 51.0% Speak English very well189 49.0% Speak English less than very well76.5% of residents speak other language at home 1,829 59.0% Speak English very well1,272 41.0% Speak English less than very well
White (Caucasian) - Speak only English Native:
97.6% (28,359)Foreign-born:
24.4% (264)
White (Caucasian) - Speak another language Native:
2.5% (721)Foreign-born:
76.5% (828)
Black or African American - Speak only English Native:
99.0% (1,090)Foreign-born:
2.0% (9)
Black or African American - Speak another language Native:
0.7% (8)Foreign-born:
100.0% (458)
American Indian / Alaska Native - Speak another language Native:
3.7% (5)Foreign-born:
100.0% (37)
Asian - Speak only English Native:
47.6% (331)Foreign-born:
14.4% (256)
Asian - Speak another language Native:
50.1% (348)Foreign-born:
83.8% (1,494)
Native Hawaiian / Pacific Islander - Speak only English Native:
77.7% (197)Foreign-born:
56.3% (77)
Native Hawaiian / Pacific Islander - Speak another language Native:
20.6% (52)Foreign-born:
56.0% (77)
Other race - Speak only English Native:
64.5% (382)Foreign-born:
15.3% (28)
Other race - Speak another language Native:
36.1% (213)Foreign-born:
85.1% (153)
Two or more races - Speak only English Native:
84.2% (3,356)Foreign-born:
9.4% (26)
Two or more races - Speak another language Native:
15.8% (630)Foreign-born:
92.1% (251)
White alone - Speak only English Native:
98.1% (27,804)Foreign-born:
22.6% (257)
White alone - Speak another language Native:
1.9% (540)Foreign-born:
80.8% (919)
Hispanic or Latino - Speak only English Native:
67.1% (1,922)Foreign-born:
9.8% (46)
Hispanic or Latino - Speak another language Native:
33.1% (949)Foreign-born:
89.7% (420)
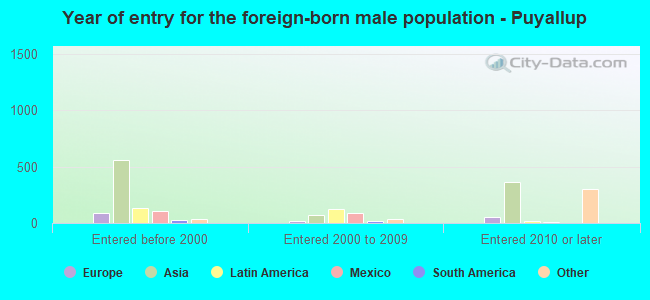
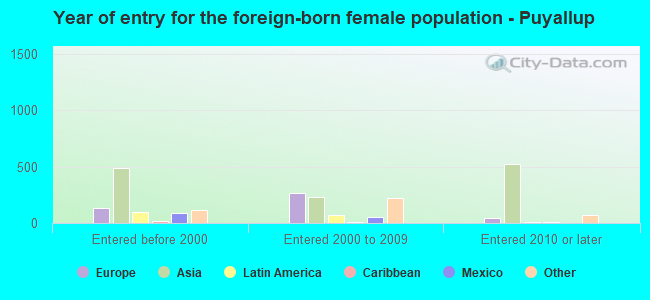
Foreign-born residents in Puyallup 4,034 residents are foreign born (4.9% Asia , 1.5% Europe , 1.1% Latin America ).
This city:
9.4%Washington:
14.9%
Marital status for residents in Puyallup Marital status - White (Caucasian) population 15 years and over
Males 34.7% Never married50.8% Now married0.8% Separated2.1% Widowed11.6% DivorcedFemales 28.0% Never married45.8% Now married0.6% Separated9.4% Widowed16.2% DivorcedWomen who gave birth in the past 12 months Now married:
50.6% (240)Unmarried:
49.4% (235)
Women who did not give birth in the past 12 months Now married:
45.3% (3,084)Unmarried:
54.7% (3,730)
Marital status - Black or African American population 15 years and over
Males 33.3% Never married44.1% Now married0.0% Separated1.0% Widowed21.6% DivorcedFemales 47.3% Never married26.4% Now married2.5% Separated12.8% Widowed10.9% DivorcedWomen who gave birth in the past 12 months Now married:
0.0% (0)Unmarried:
100.0% (52)
Women who did not give birth in the past 12 months Now married:
23.1% (103)Unmarried:
76.9% (343)
Marital status - American Indian / Alaska Native population 15 years and over
Males 54.1% Never married11.8% Now married0.0% Separated0.0% Widowed34.1% DivorcedFemales 36.3% Never married47.3% Now married0.0% Separated3.3% Widowed13.2% DivorcedWomen who did not give birth in the past 12 months Now married:
26.5% (13)Unmarried:
73.5% (35)
Marital status - Asian population 15 years and over
Males 39.6% Never married56.2% Now married0.0% Separated0.0% Widowed4.2% DivorcedFemales 31.5% Never married61.7% Now married0.0% Separated2.0% Widowed4.9% DivorcedWomen who gave birth in the past 12 months Now married:
100.0% (23)Unmarried:
0.0% (0)
Women who did not give birth in the past 12 months Now married:
51.6% (464)Unmarried:
48.4% (435)
Marital status - Native Hawaiian / Pacific Islander population 15 years and over
Males 51.7% Never married48.3% Now married0.0% Separated0.0% Widowed0.0% DivorcedFemales 48.7% Never married29.4% Now married0.0% Separated0.0% Widowed21.8% DivorcedWomen who gave birth in the past 12 months Now married:
28.3% (17)Unmarried:
71.7% (43)
Women who did not give birth in the past 12 months Now married:
30.9% (48)Unmarried:
69.1% (108)
Marital status - Other race population 15 years and over
Males 29.7% Never married67.9% Now married0.0% Separated0.0% Widowed2.4% DivorcedFemales 31.9% Never married39.6% Now married10.0% Separated0.0% Widowed18.5% DivorcedWomen who did not give birth in the past 12 months Now married:
36.5% (62)Unmarried:
63.5% (108)
Marital status - Two or more races population 15 years and over
Males 68.9% Never married26.4% Now married0.0% Separated1.0% Widowed3.7% DivorcedFemales 51.9% Never married29.9% Now married0.0% Separated1.4% Widowed16.7% DivorcedWomen who gave birth in the past 12 months Now married:
59.3% (21)Unmarried:
40.7% (14)
Women who did not give birth in the past 12 months Now married:
25.8% (372)Unmarried:
74.2% (1,074)
Marital status - White alone, not Hispanic / Latino population 15 years and over
Males 33.8% Never married51.4% Now married0.6% Separated2.2% Widowed12.1% DivorcedFemales 27.2% Never married45.9% Now married0.6% Separated9.7% Widowed16.5% DivorcedWomen who gave birth in the past 12 months Now married:
50.6% (247)Unmarried:
49.4% (241)
Women who did not give birth in the past 12 months Now married:
46.3% (3,123)Unmarried:
53.7% (3,619)
Marital status - Hispanic or Latino population 15 years and over
Males 51.6% Never married43.2% Now married2.9% Separated0.6% Widowed1.7% DivorcedFemales 49.1% Never married32.5% Now married2.1% Separated0.7% Widowed15.6% DivorcedWomen who did not give birth in the past 12 months Now married:
22.8% (232)Unmarried:
77.2% (786)
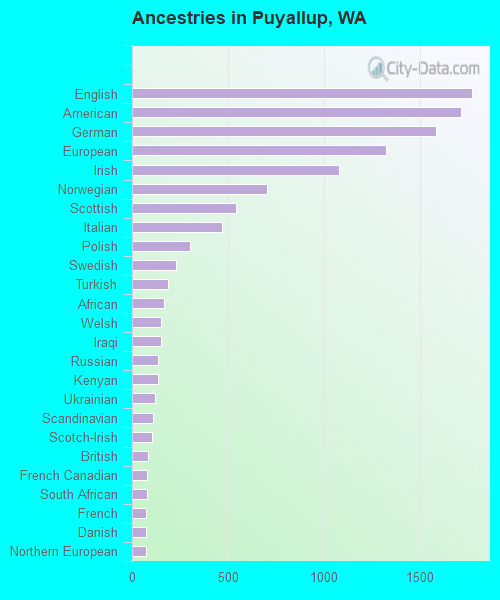
Ancestries in Puyallup
1,773 9.6% English1,718 9.3% American1,583 8.6% German1,326 7.2% European1,078 5.9% Irish703 3.8% Norwegian543 2.9% Scottish467 2.5% Italian304 1.7% Polish229 1.2% Swedish186 1.0% Turkish167 0.9% African153 0.8% Welsh150 0.8% Iraqi136 0.7% Russian135 0.7% Kenyan118 0.6% Ukrainian111 0.6% Scandinavian105 0.6% Scotch-Irish86 0.5% British79 0.4% French Canadian76 0.4% South African73 0.4% French73 0.4% Danish71 0.4% Northern European68 0.4% Dutch66 0.4% Finnish61 0.3% Croatian52 0.3% Nigerian50 0.3% Czech50 0.3% Austrian47 0.3% Swiss42 0.2% Alsatian39 0.2% Jamaican37 0.2% Ethiopian35 0.2% Hungarian34 0.2% Canadian15 0.08% Albanian15 0.08% Moroccan13 0.07% Australian7 0.04% Arab7 0.04% Slavic6 0.03% Portuguese3 0.02% Greek2 0.01% Eastern European
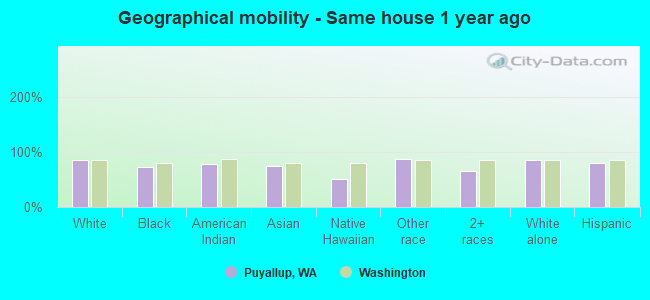
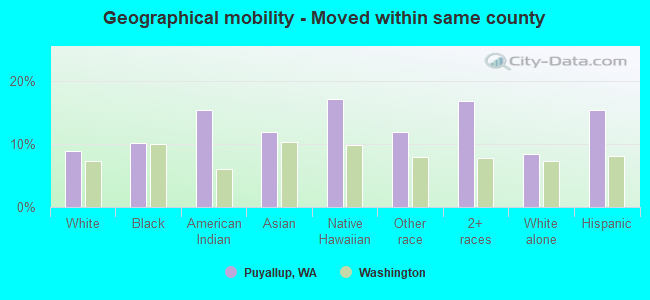
Geographical mobility in Puyallup Same house 1 year ago 26,706 85.3% White (Caucasian)1,198 72.3% Black or African American154 78.7% American Indian / Alaska Native1,930 75.3% Asian207 50.6% Native Hawaiian / Pacific Islander670 87.4% Other race3,275 65.8% Two or more races26,250 85.8% White alone, not Hispanic / Latino2,876 80.6% Hispanic or LatinoMoved within same county 2,787 8.9% White / Caucasian167 10.1% Black or African American30 15.4% American Indian / Alaska Native304 11.9% Asian70 17.0% Native Hawaiian / Pacific Islander91 11.9% Other race837 16.8% Two or more races2,586 8.4% White alone, not Hispanic / Latino550 15.4% Hispanic or LatinoMoved within same state 974 3.1% White / Caucasian127 7.7% Black or African American256 10.0% Asian34 4.4% Other race517 10.4% Two or more races959 3.1% White alone, not Hispanic / Latino100 2.8% Hispanic or LatinoMoved from different state 594 1.9% White / Caucasian83 5.0% Black or African American12 0.5% Asian91 22.2% Native Hawaiian / Pacific Islander135 2.7% Two or more races577 1.9% White alone, not Hispanic / Latino76 2.1% Hispanic or LatinoMoved from abroad 139 0.4% White45 2.7% Black or African American153 6.0% Asian43 0.9% Two or more races141 0.5% White alone, not Hispanic / Latino
Children Nativity (place of birth) in Puyallup
Children under 6 years - Living with two parents Both parents native 1,260 96.0% Native52 4.0% Foreign-bornBoth parents foreign-born 269 100.0% NativeOne native, one foreign-born parent 245 100.0% NativeChildren under 6 years - Living with one parent Native parent 875 100.0% NativeForeign-born parent 99 73.3% Native36 26.7% Foreign-bornChildren 6 to 17 years - Living with two parents Both parents native 2,474 100.0% Native0 0.0% Foreign-bornBoth parents foreign-born 653 69.9% Native281 30.1% Foreign-bornOne native, one foreign-born parent 662 100.0% NativeChildren 6 to 17 years - Living with one parent Native parent 1,785 100.0% NativeForeign-born parent 82 52.0% Native76 48.0% Foreign-born
Grandparents responsible for own grandchildren in Puyallup
Grandparents (30 to 59 years) White / Caucasian 82 40.9% Responsible for grandchildren118 59.1% Not responsible for grandchildrenBlack or African American 12 100.0% Not responsible for grandchildrenAmerican Indian / Alaska Native 7 100.0% Responsible for grandchildrenNative Hawaiian / Pacific Islander 21 100.0% Not responsible for grandchildrenTwo or more races 8 100.0% Not responsible for grandchildrenWhite alone, not Hispanic / Latino 48 28.2% Responsible for grandchildren122 71.8% Not responsible for grandchildrenHispanic or Latino 59 100.0% Responsible for grandchildrenGrandparents (60 years and over) White / Caucasian 21 9.6% Responsible for grandchildren194 90.4% Not responsible for grandchildrenBlack or African American 5 100.0% Not responsible for grandchildrenTwo or more races 40 100.0% Not responsible for grandchildrenWhite alone, not Hispanic / Latino 21 9.9% Responsible for grandchildren195 90.1% Not responsible for grandchildrenHispanic or Latino 11 100.0% Not responsible for grandchildren