Housing density: 141 houses/condos per square mile
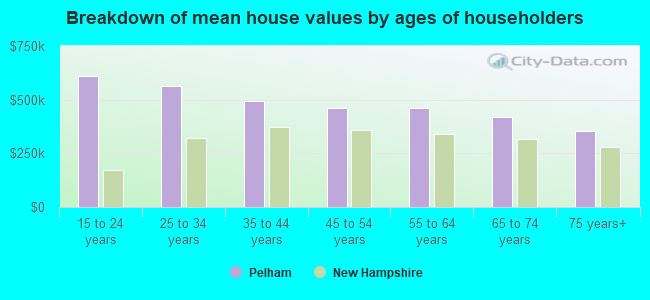
Median price asked for vacant for-sale houses and condos in 2022 in this county: $219,786.
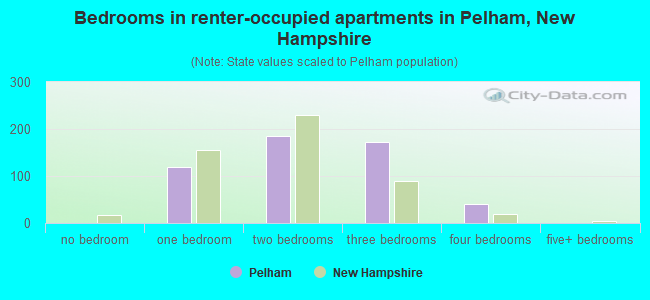
Median contract rent in 2022: $1,498 (lower quartile is $1,244, upper quartile is $1,880)
Median gross rent in Pelham, NH in 2022: $1,743
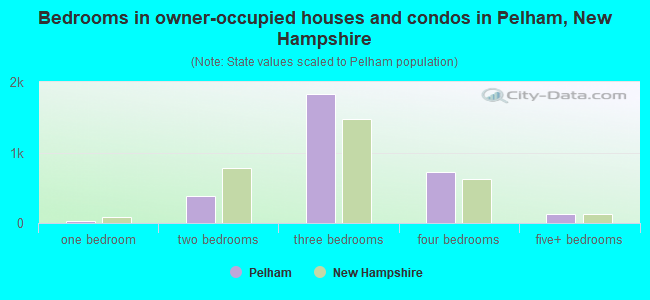
Housing units in Pelham with a mortgage: 2,233 (118 second mortgage, 281 home equity loan, 15 both second mortgage and home equity loan) Houses without a mortgage: 568
In family households: 326,724 (73,081 male householders, 30,878 female householders)
80,219 spouses, 116,046 children (108,604 natural, 2,355 adopted, 5,087 stepchildren), 5,202 grandchildren, 2,916 brothers or sisters, 3,400 parents, foster children, 2,901 other relatives, 9,588 non-relatives
In nonfamily households: 66,238 (25,502 male householders (18,551 living alone)), 26,005 female householders (20,836 living alone)), 14,731 nonrelatives
In group quarters: 7,759 (3,560 institutionalized population)
74,304 married couples with children.
19,641 single-parent households (5,030 men, 14,611 women).
92.5% of residents of Pelham speak English at home.
0.8% of residents speak Spanish at home (100% speak English very well).
6.2% of residents speak other Indo-European language at home (80% speak English very well, 14% speak English well, 5% speak English not well, 2% don't speak English at all).
0.3% of residents speak Asian or Pacific Island language at home (64% speak English very well, 24% speak English well, 12% don't speak English at all).
0.3% of residents speak other language at home (63% speak English very well, 37% speak English well).
Foreign born population: 622 (5.1%)
(90.2% of them are naturalized citizens)
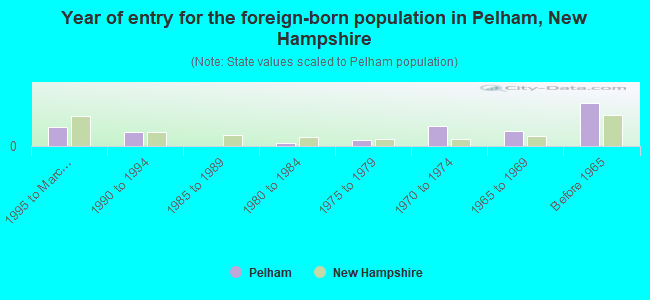
Year of entry for the foreign-born population in Pelham, New Hampshire
581995 to March 2000
431990 to 1994
01985 to 1989
81980 to 1984
201975 to 1979
611970 to 1974
471965 to 1969
133Before 1965
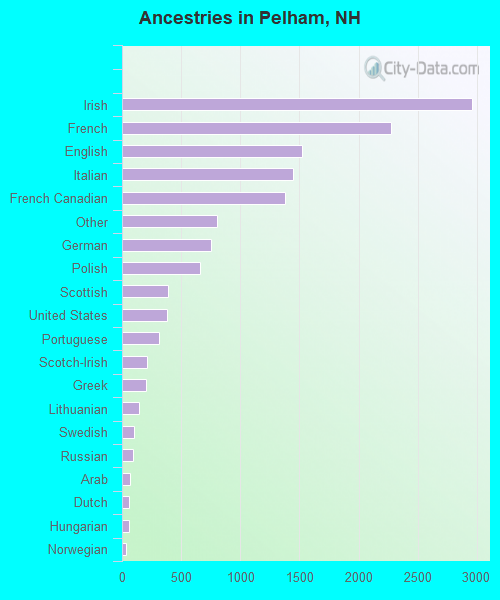
First ancestries reported:
Irish: 2,955 (21.2%)
French: 2,271 (16.3%)
English: 1,520 (10.9%)
Italian: 1,445 (10.4%)
French Canadian: 1,374 (9.9%)
Other: 807 (5.8%)
German: 750 (5.4%)
Polish: 662 (4.8%)
Scottish: 387 (2.8%)
United States: 380 (2.7%)
Portuguese: 309 (2.2%)
Scotch-Irish: 212 (1.5%)
Greek: 203 (1.5%)
Lithuanian: 144 (1.0%)
Swedish: 105 (0.8%)
Russian: 94 (0.7%)
Arab: 67 (0.5%)
Dutch: 57 (0.4%)
Hungarian: 57 (0.4%)
Norwegian: 38 (0.3%)
Welsh: 23 (0.2%)
Slovak: 21 (0.2%)
Ukrainian: 21 (0.2%)
Czech: 15 (0.1%)
Danish: 8 (0.06%)
West Indian: 7 (0.05%)
Swiss: 4 (0.03%)
Most common places of birth for foreign-born residents (%):
Canada
Pelham:
21.6% (80)
New Hampshire:
22.9% (12,397)
Germany
Pelham:
13.8% (51)
New Hampshire:
4.9% (2,670)
Brazil
Pelham:
9.7% (36)
New Hampshire:
2.0% (1,103)
Hungary
Pelham:
5.7% (21)
New Hampshire:
0.6% (307)
Netherlands
Pelham:
4.3% (16)
New Hampshire:
0.9% (471)
Italy
Pelham:
4.3% (16)
New Hampshire:
1.5% (813)
Portugal
Pelham:
4.3% (16)
New Hampshire:
1.5% (835)
Poland
Pelham:
3.8% (14)
New Hampshire:
1.7% (931)
Other Eastern Africa
Pelham:
3.8% (14)
New Hampshire:
0.9% (511)
France
Pelham:
3.5% (13)
New Hampshire:
0.7% (401)
Philippines
Pelham:
3.5% (13)
New Hampshire:
1.9% (1,031)
India
Pelham:
3.2% (12)
New Hampshire:
4.7% (2,530)
United Kingdom
Pelham:
3.0% (11)
New Hampshire:
8.1% (4,396)
Cuba
Pelham:
2.7% (10)
New Hampshire:
0.5% (252)
China, excluding Hong Kong and Taiwan
Pelham:
2.4% (9)
New Hampshire:
3.4% (1,828)
Thailand
Pelham:
2.2% (8)
New Hampshire:
0.6% (314)
El Salvador
Pelham:
2.2% (8)
New Hampshire:
0.3% (188)
Mexico
Pelham:
1.6% (6)
New Hampshire:
2.6% (1,419)
Place of birth for U.S.-born residents:
This state: 1,351
Other state: 9,178
Northeast: 8,621
Midwest: 224
South: 187
West: 146
68% of Pelham residents lived in the same house 5 years ago. Out of people who lived in different houses, 36% lived in this county. Out of people who lived in different counties, 24% lived in New Hampshire.
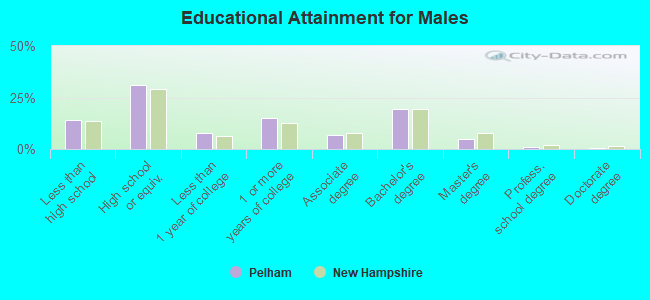
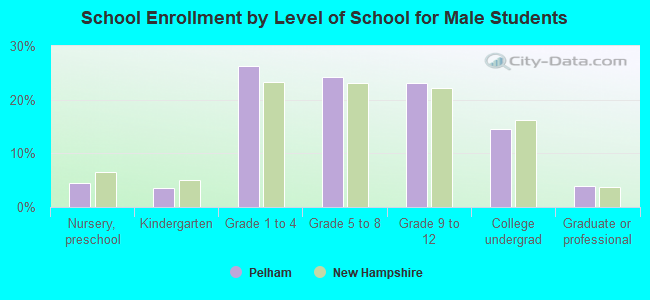
Education attainment for males 25 years and older:
No schooling: 6
Nursery to 4th grade: 5
5th and 6th grade: 12
7th and 8th grade: 70
9th grade: 68
10th grade: 69
11th grade: 115
12th grade, no diploma: 146
High school graduate (or equivalency): 1,087
Less than 1 year of college: 265
Some college more than 1 year, no degree: 522
Associate degree: 238
Bachelor's degree: 686
Master's degree: 166
Professional school degree: 38
Doctorate degree: 12
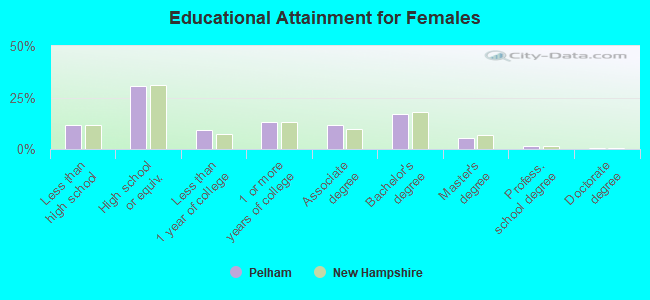
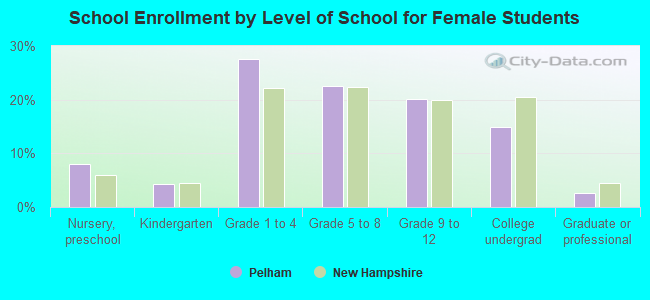
Education attainment for females 25 years and older:
No schooling: 11
Nursery to 4th grade: 6
5th and 6th grade: 19
7th and 8th grade: 75
9th grade: 41
10th grade: 86
11th grade: 60
12th grade, no diploma: 118
High school graduate (or equivalency): 1,097
Less than 1 year of college: 329
Some college more than 1 year, no degree: 475
Associate degree: 428
Bachelor's degree: 608
Master's degree: 192
Professional school degree: 44
Doctorate degree: 12
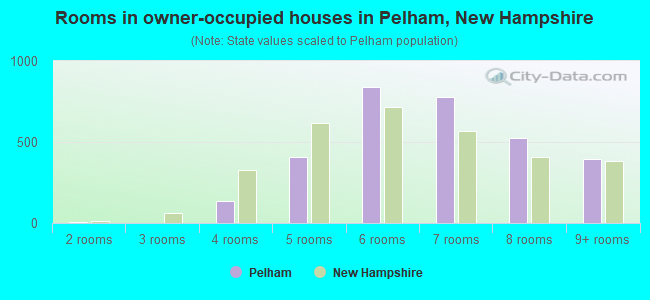
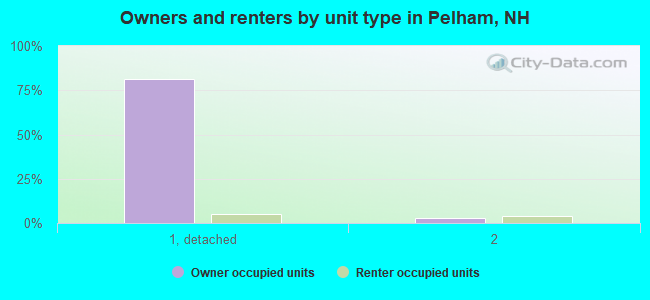
Housing units in structures:
One, detached: 3,214
One, attached: 85
Two: 235
3 or 4: 72
5 to 9: 27
10 to 19: 34
20 to 49: 46
50 or more: 7
Mobile homes: 20
Median worth of mobile homes: $323,341
Housing units lacking complete plumbing facilities: 0.1%
Housing units lacking complete kitchen facilities: 1.2%