Races in Pelham, New Hampshire (NH) Detailed Stats
Ancestries, Foreign-born residents, place of birth

Recent posts about races in Pelham, New Hampshire on our local forum with over 2,400,000 registered users:
 | Well NH, its been nice but (85 replies) |
| Pelham? (24 replies) |
| Relocating to Nashua? Pelham? but working in MA (8 replies) |
| 30 mins around pelham (6 replies) |
| Driver ticketed for mountain of junk on roof (24 replies) |
| The truth about West Manchester? Manchester Locals... (19 replies) |
Latest news about races in Pelham, NH collected exclusively by city-data.com from local newspapers, TV, and radio stations
3.4% of Pelham, NH residents are foreign-born (1.4% born in Europe, 0.7% born in North America, 0.6% born in Latin America, 0.5% born in Asia), which is 47.5% less than the foreign-born rate of 5.0% across the entire state of New Hampshire.
Race distribution in Pelham

- 10,54496.6%White alone
- 1051.0%Hispanic
- 1141.0%Asian alone
- 720.7%Two or more races
- 480.4%Black alone
- 230.2%American Indian alone
- 80.07%Other race alone
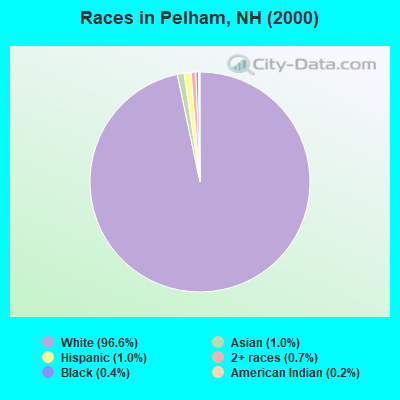
2000
2022
-
- 1,175,25295.1%White alone
- 20,4891.7%Hispanic
- 15,8031.3%Asian alone
- 11,6060.9%Two or more races
- 8,3540.7%Black alone
- 2,6980.2%American Indian alone
- 1,2540.1%Other race alone
- 3300.03%Native Hawaiian and Other
Pacific Islander alone

-
- 1,208,10186.6%White alone
- 63,4794.5%Hispanic
- 60,7244.4%Two or more races
- 36,5192.6%Asian alone
- 17,9311.3%Black alone
- 6,6150.5%Other race alone
- 1,0140.07%American Indian alone
- 8480.06%Native Hawaiian and Other
Pacific Islander alone

Income and house value in Pelham
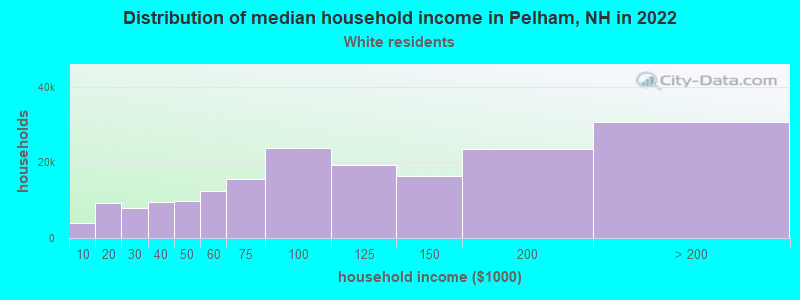
- Median household income in 2022
- $125,075White non-Hispanic householders
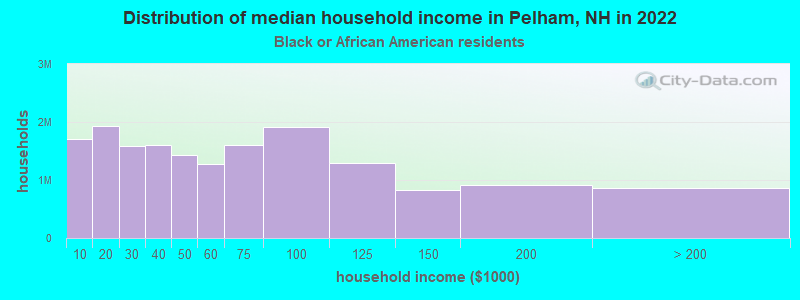
- $47,723Black householders
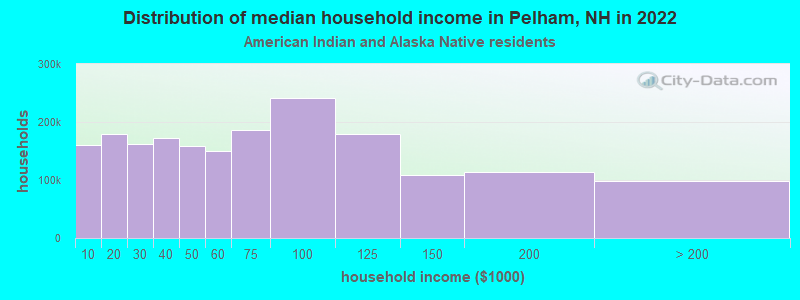
- $117,711American Indian and Alaska Native householders
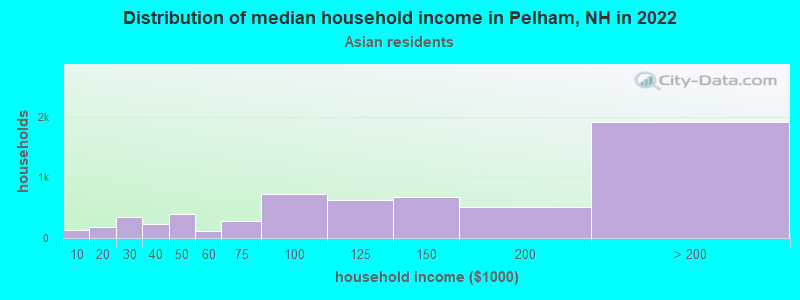
- $58,348Asian householders
- $148,491Some other race householders
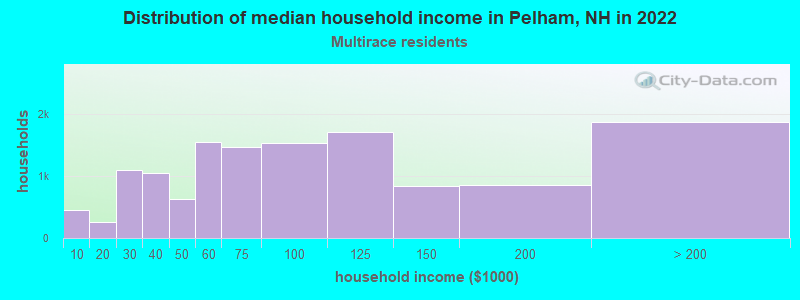
- $97,019Two or more races householders
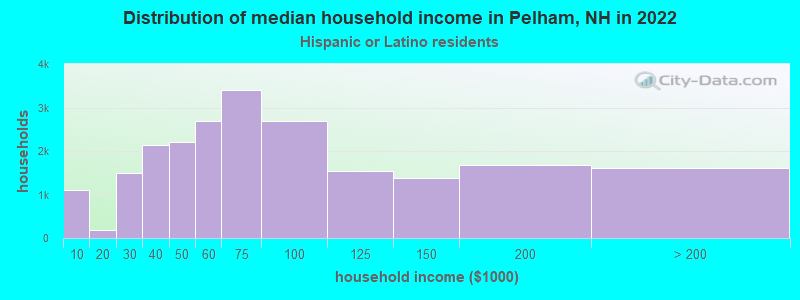
- $149,136Hispanic or Latino race householders
- Median 2022 house value
- $522,381White Non-Hispanic householders
- $418,928Black or African American householders
- $476,068Asian householders
- $264,348Two or more races householders
- $437,573Hispanic or Latino householders
Household income for White non-Hispanic householders
Household income for Black householders
Household income for American Indian and Alaska Native householders
Household income for Asian householders
Household income for Two or more races householders
Household income for Hispanic or Latino race householders
Foreign-born residents in Pelham
370 residents are foreign born (1.4% Europe, 0.7% North America, 0.6% Latin America, 0.5% Asia).
| This city: | 3.4% |
| New Hampshire: | 4.4% |
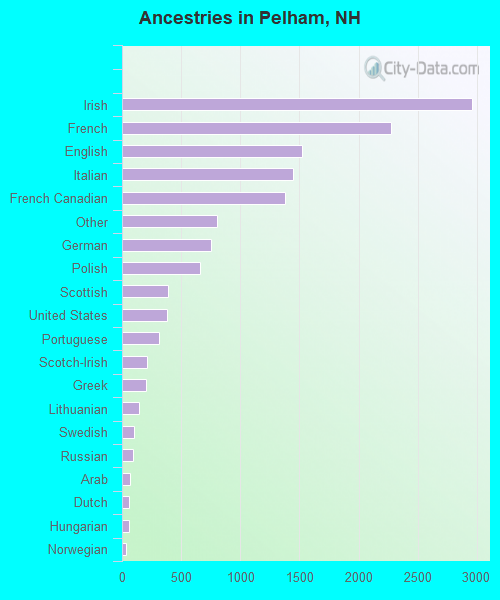
Ancestries in Pelham

- 2,95521.2%Irish
- 2,27116.3%French
- 1,52010.9%English
- 1,44510.4%Italian
- 1,3749.9%French Canadian
- 8075.8%Other
- 7505.4%German
- 6624.8%Polish
- 3872.8%Scottish
- 3802.7%United States
- 3092.2%Portuguese
- 2121.5%Scotch-Irish
- 2031.5%Greek
- 1441.0%Lithuanian
- 1050.8%Swedish
- 940.7%Russian
- 670.5%Arab
- 570.4%Dutch
- 570.4%Hungarian
- 380.3%Norwegian
- 230.2%Welsh
- 210.2%Slovak
- 210.2%Ukrainian
- 150.1%Czech
- 80.06%Danish
- 70.05%West Indian
- 40.03%Swiss
Zip codes: 03076.