Oregon, IL (Illinois) Houses and Residents
| Oregon: | $140,164 |
| Illinois: | $251,600 |
Total population: 3,605 (All urban)
Houses: 1,869 (1,757 occupied: 1,116 owner occupied, 663 renter occupied)
| % of renters here: | 37% |
| State: | 33% |
Housing density: 920 houses/condos per square mile
Median price asked for vacant for-sale houses and condos in 2022 in this county: $112,424.
Median contract rent in 2022: $629 (lower quartile is $466, upper quartile is $734)
Median rent asked for vacant for-rent units in 2022: $595
Median gross rent in Oregon, IL in 2022: $798
Housing units in Oregon with a mortgage: 589 (21 second mortgage, 0 home equity loan, 21 both second mortgage and home equity loan)
Houses without a mortgage: 21
Median household income for houses/condos with a mortgage: $85,907
Median household income for apartments without a mortgage: $68,287
Median monthly housing costs: $778
Compare current foreclosures near Oregon, IL:
| Photo | Address | Area | Beds / Baths | Price | Details |
|---|---|---|---|---|---|

|
#1
S 2nd St
Oregon, IL 61061
|
- sq. feet
|
- baths - beds |
$43,900
|
show details |

|
#2
S 7th St
Oregon, IL 61061
|
1,638 sq. feet
|
- baths - beds |
show details | |

|
#3
N Jeffrey Ln
Oregon, IL 61061
|
1,910 sq. feet
|
- baths - beds |
show details | |

|
#4
S Bradley Ln
Oregon, IL 61061
|
2,057 sq. feet
|
- baths - beds |
show details | |

|
#5
N 4th St
Oregon, IL 61061
|
- sq. feet
|
- baths - beds |
show details | |

|
#6
S 2nd St
Oregon, IL 61061
|
- sq. feet
|
- baths - beds |
show details | |

|
#7
N 5th St
Oregon, IL 61061
|
- sq. feet
|
- baths - beds |
show details | |

|
#8
Clay St
Oregon, IL 61061
|
- sq. feet
|
- baths - beds |
show details | |

|
#9
Phyllis Ave
Rochelle, IL 61068
|
1,056 sq. feet
|
1 baths 3 beds |
show details | |

|
#10
N 15th St
Rochelle, IL 61068
|
- sq. feet
|
1 baths 3 beds |
show details |
| Photo | Address | Area | Beds / Baths | Price | Details |
|---|---|---|---|---|---|

|
#11
Chicago Ave
Dixon, IL 61021
|
1,000 sq. feet
|
2 baths 3 beds |
show details | |

|
#12
S Mckendrie Ave
Mount Morris, IL 61054
|
2 sq. feet
|
2 baths 3 beds |
show details | |

|
#13
W Fulton St
Polo, IL 61064
|
1,378 sq. feet
|
1 baths 3 beds |
show details | |

|
#14
Institute Blvd
Dixon, IL 61021
|
1,064 sq. feet
|
1 baths - beds |
show details | |

|
#15
Central Pl
Dixon, IL 61021
|
1,016 sq. feet
|
1 baths - beds |
show details | |

|
#16
Jackson Ave
Dixon, IL 61021
|
605 sq. feet
|
1 baths - beds |
show details | |

|
#17
W 1st St
Dixon, IL 61021
|
1,001 sq. feet
|
1 baths - beds |
show details | |

|
#18
Park Ln
Dixon, IL 61021
|
1,008 sq. feet
|
1 baths - beds |
show details | |

|
#19
Squires Ave
Dixon, IL 61021
|
1,383 sq. feet
|
1 baths - beds |
show details | |

|
#20
N Brinton Ave
Dixon, IL 61021
|
1,088 sq. feet
|
1 baths - beds |
show details |
| Photo | Address | Area | Beds / Baths | Price | Details |
|---|---|---|---|---|---|

|
#21
W 1st St
Dixon, IL 61021
|
1,240 sq. feet
|
1 baths - beds |
show details | |

|
#22
N Ottawa Ave
Dixon, IL 61021
|
- sq. feet
|
1 baths 3 beds |
show details | |

|
#23
W 4th St
Dixon, IL 61021
|
1,199 sq. feet
|
1 baths - beds |
show details | |

|
#24
Herman Rd
Franklin Grove, IL 61031
|
1,704 sq. feet
|
1 baths - beds |
show details | |

|
#25
S Dixon Ave
Dixon, IL 61021
|
768 sq. feet
|
1 baths - beds |
show details | |

|
#26
S Peoria Ave
Dixon, IL 61021
|
1,004 sq. feet
|
1 baths - beds |
show details | |

|
#27
Chicago Ave
Dixon, IL 61021
|
968 sq. feet
|
2 baths - beds |
show details | |

|
#28
Naylor Rd
Franklin Grove, IL 61031
|
1,612 sq. feet
|
1 baths - beds |
show details | |

|
#29
Monroe Ave
Dixon, IL 61021
|
936 sq. feet
|
1 baths - beds |
show details | |

|
#30
Us Highway 52
Amboy, IL 61310
|
2,292 sq. feet
|
1 baths - beds |
show details |
| Photo | Address | Area | Beds / Baths | Price | Details |
|---|---|---|---|---|---|

|
#31
Sangamon Ln
Dixon, IL 61021
|
1,300 sq. feet
|
- baths - beds |
show details | |

|
#32
Lincoln Hwy
Rochelle, IL 61068
|
1,746 sq. feet
|
- baths - beds |
show details | |

|
#33
W Maple St
Franklin Grove, IL 61031
|
- sq. feet
|
2 baths 6 beds |
show details | |

|
#34
Main St
Rochelle, IL 61068
|
2,400 sq. feet
|
- baths - beds |
show details | |

|
#35
Sunset Ln
Mount Morris, IL 61054
|
1,352 sq. feet
|
- baths - beds |
show details | |

|
#36
Garfield Dr
Rochelle, IL 61068
|
962 sq. feet
|
- baths - beds |
show details | |

|
#37
E Canfield Rd
Chana, IL 61015
|
2,100 sq. feet
|
- baths - beds |
show details | |

|
#38
S 1st Ave
Forreston, IL 61030
|
2,053 sq. feet
|
- baths - beds |
show details | |

|
#39
N 8th St
Rochelle, IL 61068
|
1,213 sq. feet
|
- baths - beds |
show details | |

|
#40
Autumnwood Ln
Davis Junction, IL 61020
|
2,400 sq. feet
|
- baths - beds |
show details |
| Photo | Address | Area | Beds / Baths | Price | Details |
|---|---|---|---|---|---|

|
#41
W Oregon St
Polo, IL 61064
|
1,244 sq. feet
|
- baths - beds |
show details | |

|
#42
N Seminary Ave
Mount Morris, IL 61054
|
3,310 sq. feet
|
- baths - beds |
show details | |

|
#43
E Roosevelt Rd
Stillman Valley, IL 61084
|
1,728 sq. feet
|
- baths - beds |
show details | |

|
#44
S Walnut Ave
Forreston, IL 61030
|
2,536 sq. feet
|
- baths - beds |
show details | |

|
#45
N Junction Rd
Davis Junction, IL 61020
|
1,288 sq. feet
|
- baths - beds |
show details | |

|
#46
Woolf Ct
Rochelle, IL 61068
|
1,196 sq. feet
|
- baths - beds |
show details | |

|
#47
E Lincoln St
Mount Morris, IL 61054
|
2,228 sq. feet
|
- baths - beds |
show details | |

|
#48
S Wendell Dr
Rochelle, IL 61068
|
1,150 sq. feet
|
- baths - beds |
show details | |

|
#49
Betty Pl
Mount Morris, IL 61054
|
1,617 sq. feet
|
- baths - beds |
show details | |

|
Check over 1 million property listings on Foreclosure.com!
|
browse all offers | |||

Latest news about housing in Oregon, IL collected exclusively by city-data.com from local newspapers, TV, and radio stations

 | How many years until Illinois is sprawled out? (16 replies) |
| Advice on affordable apartments in Naperville area (4 replies) |
| Why are SO many Illinois folk attracted to Arizona? (292 replies) |
| illinois taxes and people who are moving out of the state (400 replies) |
| Moving to IL - is there any future? (202 replies) |
| Tiny Home as secondary home on property? (22 replies) |

Median year apartment built: 1947
Household type by relationship:
Households: 3,908- Male householders: 1,013 (451 living alone), Female householders: 711 (185 living alone)
751 spouses (751 opposite-sex spouses), 65 unmarried partners, (51 opposite-sex unmarried partners), 1,053 children (901 natural, 8 adopted, 143 stepchildren), 0 grandchildren, 0 brothers or sisters, 63 parents, 0 foster children, 0 other relatives, 114 non-relatives
- In group quarters: 136
Size of family households: 508 2-persons, 288 3-persons, 135 4-persons, 27 5-persons, 49 6-persons, 5 7-or-more-persons.
Size of nonfamily households: 671 1-person, 92 2-persons, 8 5-persons.
582 married couples with children.
219 single-parent households (72 men, 147 women).
96.7% of residents of Oregon speak English at home.
0.8% of residents speak Spanish at home (100% speak English very well).
1.7% of residents speak other Indo-European language at home (100% speak English very well).
0.4% of residents speak Asian or Pacific Island language at home (100% speak English very well).
0.1% of residents speak other language at home (100% speak English very well).
Foreign born population: 41 (1.0%)
(100.0% of them are naturalized citizens)
| Here: | 7.0 |
| State: | 6.4 |
| Here: | 4.6 |
| State: | 4.1 |

- Bedrooms in owner-occupied houses and condos in Oregon, Illinois
- 18no bedroom
- 01 bedroom
- 2342 bedrooms
- 5503 bedrooms
- 1984 bedrooms
- 1165+ bedrooms

- Bedrooms in renter-occupied apartments in Oregon, Illinois
- 0no bedroom
- 2511 bedroom
- 1352 bedrooms
- 2313 bedrooms
- 464 bedrooms
- 05+ bedrooms

- Cars and other vehicles available in Oregon in owner-occupied houses/condos
- 74no vehicle
- 2981 vehicle
- 5142 vehicles
- 1883 vehicles
- 244 vehicles
- 175+ vehicles

- Cars and other vehicles available in Oregon in renter-occupied apartments
- 165no vehicle
- 2991 vehicle
- 1772 vehicles
- 03 vehicles
- 04 vehicles
- 225+ vehicles

- Rooms in owner-occupied houses in Oregon, Illinois
- 181 room
- 02 rooms
- 03 rooms
- 354 rooms
- 2135 rooms
- 2276 rooms
- 1257 rooms
- 1948 rooms
- 3049+ rooms

- Rooms in renter-occupied apartments in Oregon, Illinois
- 01 room
- 902 rooms
- 1243 rooms
- 1024 rooms
- 925 rooms
- 1836 rooms
- 317 rooms
- 438 rooms
- 09+ rooms


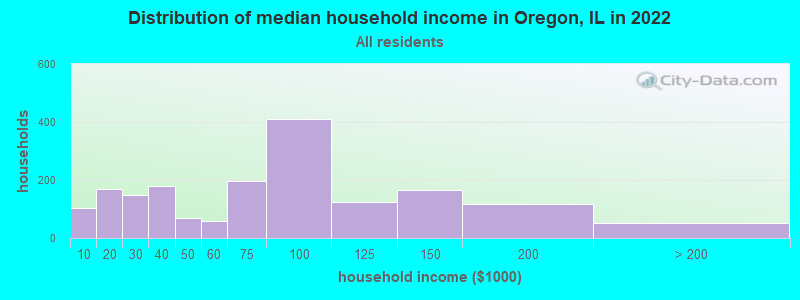
Oregon, IL household income distribution

- 102Less than $10,000
- 170$10,000 to $19,999
- 149$20,000 to $29,999
- 180$30,000 to $39,999
- 69$40,000 to $49,999
- 60$50,000 to $59,999
- 197$60,000 to $74,999
- 409$75,000 to $99,999
- 125$100,000 to $124,999
- 164$125,000 to $149,999
- 118$150,000 to $199,999
- 51$200,000 or more
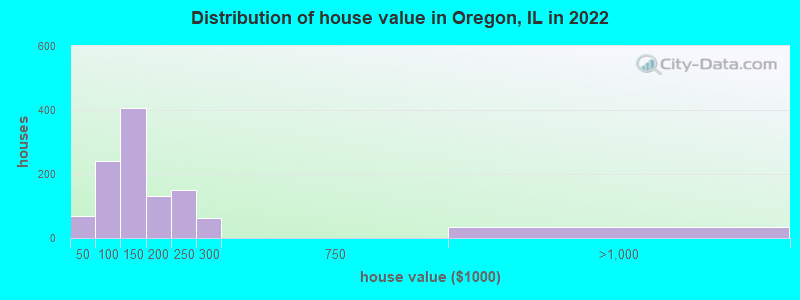
Home value of owner - occupied houses in 2022 in Oregon, IL
-
- 13Less than $10,000
- 17$15,000 to $19,999
- 37$40,000 to $49,999
- 9$50,000 to $59,999
- 13$60,000 to $69,999
- 85$70,000 to $79,999
- 70$80,000 to $89,999
- 24$90,000 to $99,999
- 188$100,000 to $124,999
- 218$125,000 to $149,999
- 48$150,000 to $174,999
- 81$175,000 to $199,999
- 149$200,000 to $249,999
- 61$250,000 to $299,999
- 34$750,000 to $999,999
Rent paid by renters in 2022 in Oregon, IL
-
- 27$150 to $199
- 100$400 to $449
- 103$450 to $499
- 14$500 to $549
- 34$550 to $599
- 42$600 to $649
- 12$650 to $699
- 188$700 to $749
- 43$750 to $799
- 21$900 to $999
- 35$1,250 to $1,499
- 22No cash rent


Percentage of workers working in this county: 58.1%
Number of people working at home: 44 (2.9% of all workers)
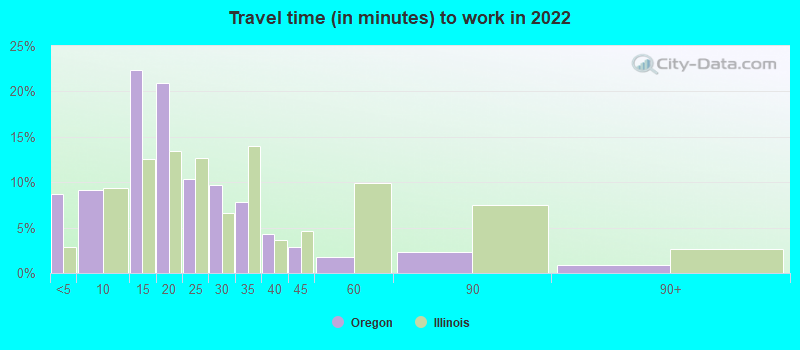
Travel time to work (commute)
- Less than 5 minutes: 159
- 5 to 9 minutes: 136
- 10 to 14 minutes: 261
- 15 to 19 minutes: 71
- 20 to 24 minutes: 232
- 25 to 29 minutes: 121
- 30 to 34 minutes: 164
- 35 to 39 minutes: 0
- 40 to 44 minutes: 107
- 45 to 59 minutes: 115
- 60 to 89 minutes: 22
- 90 or more minutes: 50
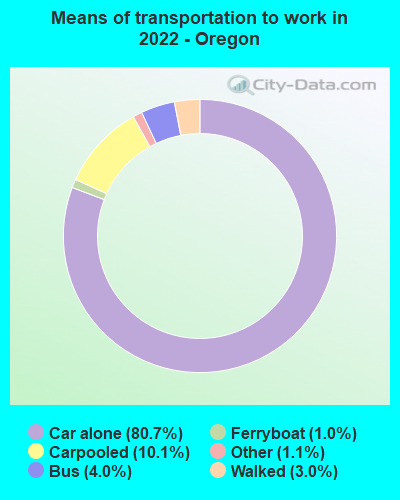
Means of transportation to work:
- Drove a car alone: 1,419 (76.4%)
- Carpooled: 189 (10.2%)
- Bus: 65 (3.5%)
- Ferryboat: 18 (1.0%)
- Taxi: 21 (1.1%)
- Walked: 54 (2.9%)
- Worked at home: 44 (2.4%)

- Unemployment by race in 2022
- Unemployment rate for White non-Hispanic residents
- 5.9%Males
- 1.5%Females

- Year of entry for the foreign-born population in Oregon, Illinois
- 02010 or later
- 02000 to 2009
- 01990 to 1999
- 431980 to 1989
- 01970 to 1979
- 50Before 1970

First ancestries reported:
- German: 450 (25.9%)
- American: 229 (13.2%)
- English: 167 (9.6%)
- Italian: 101 (5.8%)
- European: 76 (4.4%)
- Polish: 68 (3.9%)
- Swedish: 59 (3.4%)
- Scotch-Irish: 46 (2.7%)
- Irish: 40 (2.3%)
- Dutch: 22 (1.3%)
- Scandinavian: 10 (0.6%)
- Slovak: 9 (0.5%)
- French: 6 (0.3%)
- French Canadian: 5 (0.3%)
- British: 3 (0.2%)
Most common places of birth for foreign-born residents (%):
| Oregon: | 56.1% (23) |
| Illinois: | 0.1% (1,954) |
| Oregon: | 31.7% (13) |
| Illinois: | 0.6% (10,943) |
| Oregon: | 29.3% (12) |
| Illinois: | 34.7% (626,958) |
Place of birth for U.S.-born residents:
- This state: 3,272
- Other state: 567
- Northeast: 0
- Midwest: 336
- South: 163
- West: 66
92.5% of Oregon residents lived in the same house 1 years ago.
Out of people who lived in different houses, 43.6% lived in this county.
Out of people who lived in different counties, 76.8% lived in Illinois.
| Oregon: | 92.5% |
| State average: | 88.3% |
Education attainment for males 25 years and older:
- No schooling: 26
- Nursery to 4th grade: 83
- 5th and 6th grade: 5
- 7th and 8th grade: 0
- 9th grade: 0
- 10th grade: 53
- 11th grade: 0
- 12th grade, no diploma: 24
- High school graduate (or equivalency): 599
- Less than 1 year of college: 109
- Some college more than 1 year, no degree: 246
- Associate degree: 182
- Bachelor's degree: 183
- Master's degree: 79
- Professional school degree: 0
- Doctorate degree: 0

Education attainment for females 25 years and older:
- No schooling: 0
- Nursery to 4th grade: 0
- 5th and 6th grade: 0
- 7th and 8th grade: 9
- 9th grade: 4
- 10th grade: 9
- 11th grade: 0
- 12th grade, no diploma: 1
- High school graduate (or equivalency): 501
- Less than 1 year of college: 84
- Some college more than 1 year, no degree: 169
- Associate degree: 160
- Bachelor's degree: 154
- Master's degree: 104
- Professional school degree: 0
- Doctorate degree: 10


Housing units in structures:
- One, detached: 1,353
- One, attached: 22
- Two: 167
- 3 or 4: 44
- 5 to 9: 107
- 10 to 19: 110
- 20 to 49: 64
Housing units lacking complete kitchen facilities in 2022: 1.7%
House/condo owner moved in on average 12 years ago
Renter moved in on average 8 years ago

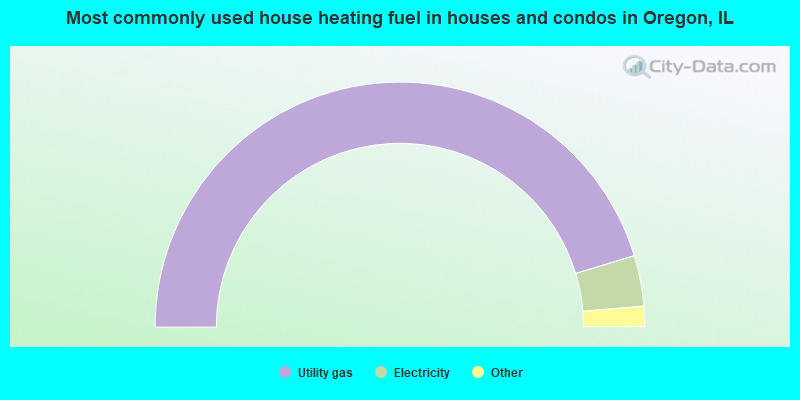
- 90.8%Utility gas
- 6.7%Electricity
- 1.4%Bottled, tank, or LP gas
- 1.2%Wood
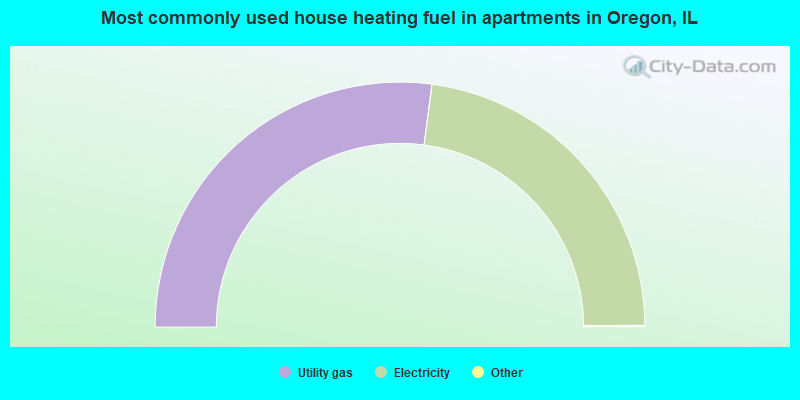
- 54.3%Utility gas
- 45.7%Electricity
Private vs. public school enrollment:
| Here: | 8.4% |
| Illinois: | 13.3% |
| Here: | 0.0% |
| Illinois: | 9.9% |
| Here: | 8.3% |
| Illinois: | 27.4% |


